APOLLOTYRE – Reversal in Play After 5-Wave Decline
# 📊 \ APOLLOTYRE – Bullish Reversal on 60-Min Chart\
🔍 \ Completed 5-Wave Down → ABC Correction → Support Reaction\
---
## 🟦 \ Support Zone: ₹439.52 – ₹444.40\
📌 This critical demand zone includes:
• TS3 Low
• End of corrective wave
• Strong volume cluster (smart money reaction)
➡️ Price bounced after touching this zone, suggesting accumulation and bullish intent.
---
## 🟨 \ Immediate Resistance: ₹460–₹465 at minor wave C completion zone\
🚧 First supply zone where price may pause or face intraday rejection.
✅ A clean breakout above ₹465 can open doors for a sharper move higher.
---
## 🎯 \ Major Target Zone: ₹482–₹488\
• Swing target zone above ₹460
• If momentum builds above ₹460, expect buyers to drive price toward this zone
---
## 📝 \ Trade Setup: Building a Bullish Structure\
📈 \ Long Entry:\ Around ₹444–₹447 or on a dip near ₹440 with bullish confirmation
🎯 \ Targets:\
• T1: ₹455
• T2: ₹464–₹468
❌ \ Stop Loss:\ Close below ₹438 (beneath Decision Point & TS3 low) hourly closing basis
---
## 🧠 \ Trade Logic & Structure\
• 5-wave downtrend completed → corrective ABC finished
• Reversal triggered from a confluence support zone
• Ideal risk/reward with confirmation via bullish candle or volume spike
• Wait for confirmation on lower timeframes (15–30 min) for early entry
---
## ⚠️ \ Risk Management Tips:\
• Keep SL tight and well-defined
• Avoid chasing breakout if price consolidates below ₹444 without conviction
• Scale in position only if price holds above entry zone
---
📌 \ Conclusion:\
APOLLOTYRE is setting up for a potential swing reversal. If ₹450 is crossed with strength, ₹465–₹482-488 becomes a realistic upside target. Trade with SL discipline and wait for volume-led breakout.
-
Stocktobuy

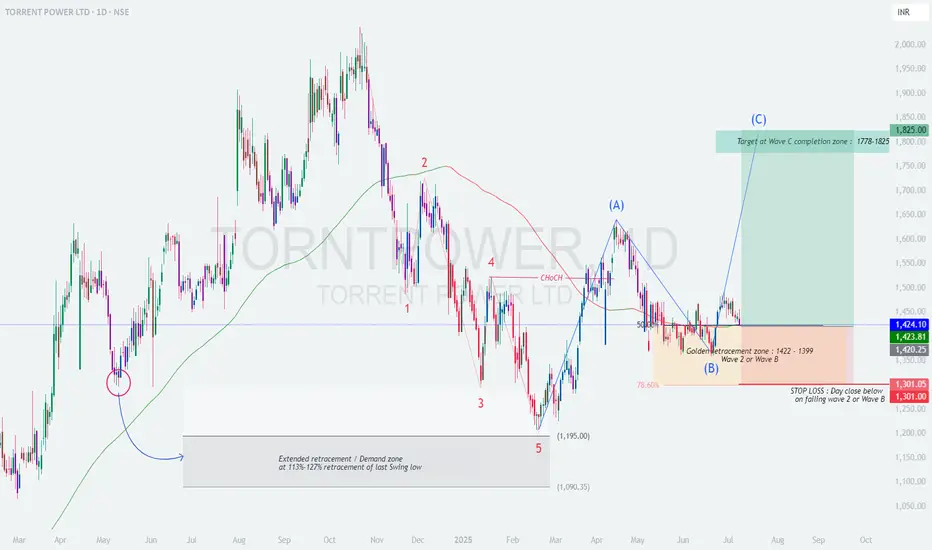
TORNTPOWER – Wave C Rally Loading from Golden Fib Zone?
After a 5-wave fall and clean ABC correction, price is poised for a potential Wave C breakout.
Golden retracement zone held strong – is this the beginning of a bullish continuation toward ₹1825?
🧩 Elliott Wave Structure:
Full 5-wave impulse decline completed → Wave 5 bottom at ₹1195
Sharp Wave A rally confirms initial trend reversal
Wave B retraced to Golden Zone (50–78.6%) → ₹1399–1422
Structure now favoring development of Wave C
📌 Key Confluences:
Golden Zone Support: Price holding firm at ₹1399–1422
CHoCH (Change of Character): Clear structure shift after Wave 5 bottom, confirming trend reversal
Price action above CHoCH level = bullish intent
Support + Fib + CHoCH = high-conviction reversal case
🎯 Targets:
Wave C Completion Zone: ₹1778–1825
Upside potential: ~28.5% from current levels
🛑 Stop-Loss & Risk Control:
Stop-loss: Day close below ₹1301
Risk:Reward: 3.4+
📈 Summary:
5-wave decline + ABC setup = classic reversal blueprint
CHoCH confirms structure flip from bearish to bullish
Low-risk swing opportunity from high-probability zone
Wave C often delivers strong directional moves – and with CHoCH in place, the foundation looks ready!
#TORNTPOWER #WaveC #CHoCH #ElliottWave #SwingTrade #GoldenZone #TrendReversal
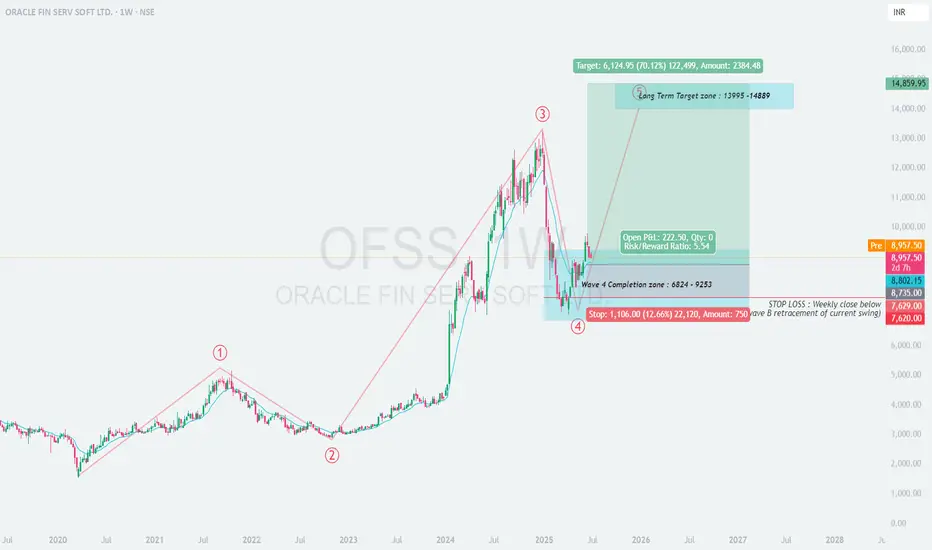
OFSS : Turning Back?📊 Technical Analysis: OFSS – Weekly Chart
🌀 Elliott Wave Count
The chart shows a classic impulsive 5-wave Elliott structure.
Currently, Wave 4 seems to have completed in the zone of ₹6824–₹9253.
The current price action indicates the beginning of Wave 5, targeting significant upside.
🟦 Wave 4 Completion Zone: ₹6824–₹9253
Strong buying interest observed in this zone.
Multiple bullish candles from the support band indicate trend resumption.
Wave structure suggests upside momentum may now pick up.
🟩 Long-Term Target Zone: ₹13,995 – ₹14,889
Based on the projected Wave 5 extension, the upside potential is nearly +70% from current levels.
Ideal for long-term investors and positional traders.
📝 Trade Setup
✅ Entry:
Current Market Price (CMP) ~ ₹8,957
🎯 Targets:
T1: ₹13,995
T2: ₹14,889
❌ Stop Loss:
Weekly close below ₹7,629 (Wave B retracement & structure invalidation)
📈 Risk-Reward Ratio: ~5.54
🔒 Risk per share: ₹1,106
🚀 Potential Gain per share: ₹6,124
🧠 Trade Logic
Strong Elliott wave structure favors Wave 5 continuation.
Risk is well-defined and acceptable for the expected return.
Ideal case of “buying into the start of an impulsive wave”.
📌 Summary:
OFSS has completed its Wave 4 corrective phase and is now positioned for a strong Wave 5 rally. Long-term investors may consider accumulating near current levels for a target of ₹14,800+, maintaining a strict SL below ₹7,620 on a weekly close basis.
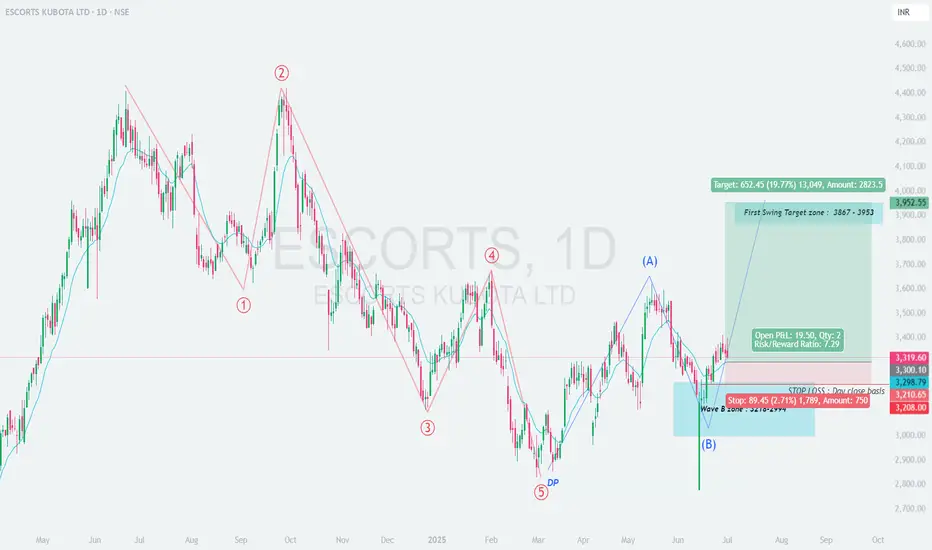
ESCORTS – Positional Swing Trade Setup (Daily Chart)
# 📊 \ ESCORTS – Positional Swing Trade Setup (Daily Chart)\
🧩 \ Elliott Wave Completion + ABC Corrective Breakout\
---
## 🌀 \ Wave Structure Insight:\
• Completed \ 5-wave impulsive decline\
• Followed by an \ ABC corrective pattern\
• Wave (B) appears to have bottomed in the \ ₹3120–3190\ Demand Zone
➡️ Reversal signs seen with strong price rejection and higher-low formation
---
## 🟦 \ Support Zone – ₹3120 to ₹3190\
🔹 Strong confluence support
🔹 Marked Demand Zone + ABC Wave (B) low
🔹 Bullish structure forming above this zone
---
## 🟩 \ Swing Target Zone: ₹3867 – ₹3953+\
🎯 Target 1: ₹3867
🎯 Target 2: ₹3953+ (full ABC projection)
⚡️ \~20% potential upside from breakout zone
---
## 📝 \ Trade Setup & Plan:\
📈 \ Entry:\ Around ₹3319–₹3330 (Post-breakout confirmation)
🎯 \ Targets:\
• T1: ₹3867
• T2: ₹3953+
❌ \ Stop Loss:\ Close below ₹3208 (below Wave B low)
📏 \ Risk-Reward Ratio:\ \~7.29 (ideal for positional traders)
---
## 🧠 \ Trade Logic:\
• Wave (B) has likely completed with a volume-backed reversal
• A sustained move above ₹3330 confirms bullish bias
• Pullback to ₹3240–₹3280 zone may offer a second entry
• Suitable for swing/positional setups with trend-following bias
---
📌 \ Conclusion:\
ESCORTS is setting up for a probable medium-term rally with a strong base in place. A move above ₹3330 with volume confirms the breakout. As long as ₹3208 holds, the trade offers high reward potential toward ₹3953.
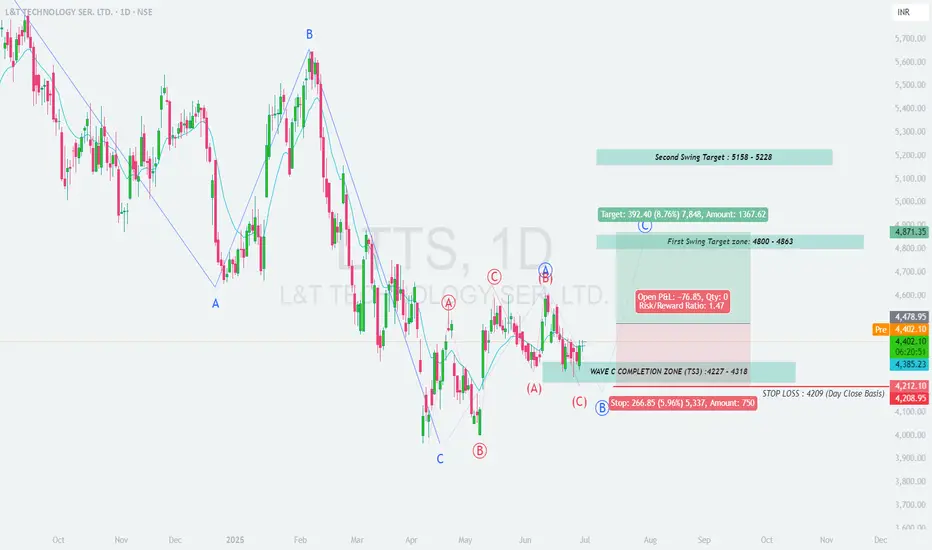
LTTS : Completing Wave B or Starting Corrective Wave 5?
## 📊 **LTTS Daily Chart Analysis**
### 🧩 **Price Structure Overview**
* The chart shows a completed **ABC correction** pattern.
* Price has recently bounced from a key \ support demand zone\ , marked by the blue and yellow boxes.
* A bullish wave structure is potentially forming, indicating trend reversal.
---
## 📉 **Support Zones**
* 📌 \ Primary Support Zone:\ ₹4280–₹4320 (yellow box)
* 📌 \ Structure Support (TS3 \ ):\ \~₹4225
Price recently reacted from these support areas with higher lows, hinting at buying interest and strength building.
---
## 📈 **Immediate Resistance / Supply Zones**
* 🟨 \ Minor Resistance Zone:\ ₹4620–₹4700 (yellow box)
* 🟦 \ Primary Resistance Zone / Target 1:\ ₹4800–₹4863
* 🟩 \ Extended Upside Target Zone:\ ₹5450–₹5650 (green box)
---
## 📝 **Trade Idea: Positional Long**
### ✅ \ Entry:\
* Around CMP (₹4405) or on dips towards ₹4300–₹4320 with bullish confirmation.
### 🎯 \ Targets:\
* \ T1:\ ₹4620
* \ T2:\ ₹4800–₹4863
* \ T3 (Extended):\ ₹5450–₹5650 (if trend sustains)
### ❌ \ Stop Loss:\
* Daily close below \ ₹4225\ (below TS3 low)
---
## 🧠 **Trade Logic & Strategy**
* Price has respected the support zones and formed a possible reversal structure.
* If the stock breaks above the ₹4620–₹4700 zone, it can accelerate toward the ₹4800+ levels.
* Conservative traders can enter after a daily close above ₹4620.
---
## 📌 **Conclusion**
LTTS is setting up for a potential **bullish swing move**.
A structure-based entry near support with defined SL offers a favorable **risk-to-reward** setup for positional traders.
Happiest mind bottom fishing Happiest mind looks good 👍 weekly or monthly basis very strong movement are coming next week's time. Entry 600 create a sl around 10%

BUY JSWENERGYBuy entry for JSWENERGY as it has made a flag pattern also it has touched the trendline and might go up 10% - 12%.

DLINKINDIA Daily Timeframe Analysis for long
NSE:DLINKINDIA has taken strong support from major zone and breakout trendline with 7 consolidation range Break Out.
Can go long 555-567 range with SL of 530.
Major Targets Highlighted in Blue lines, sub targets in grey lines.

ENGINERSIN Daily timeframe analysis
NSE:ENGINERSIN strong breakout after taking support from major zone.
Can go long , add more till 190 with SL 182 only.
Major Targets Highlighted in Blue lines, sub targets in grey lines.

Shakti Pump aiming for a base breakout.#positionalidea #shaktipump:
Looks good positionally if it breaks out of the base. Watch for base/Darvas box breakout for long opportunity.
🟢Trading above 50 DMA
🟢Good Relative Strength
🟢Good ROCE, ROE
🔴Circuit stock. Tends to hit UC/LC.
🔴Volume Needs improvement.
This is just a view and not a recommendation. Trade at your discretion.
➡️Market Cap---₹ 9,757 Cr.
➡️Current Price---₹ 4,870
➡️Stock P/E---29.7
➡️ROCE---31.4 %
➡️ROE---24.2 %

SHORT TERM SWING OPPORTUNITY IN MTAR TECHNOLOGIES LTD."MTAR TECHNOLOGIES LTD" is about to change it's weekly structure with a trendline support valid since 2021. Confirmation is above 2200 on closing basis. If the trade goes as planned, it is going to give a return of almost15% which is good. Stop loss will be planned once entry is activated. Target is calculated using the XABCD Pattern of Harmonics. Profit should be booked between 2500 and 2543 as it happens to be the PRZ area of the XABCD Pattern. Above 2600, it is going to test it's ATH again.

Is IEX ready for a 100% upmove? Charts says YESIs Indian Energy Exchange (IEX) all set to fire up?
We are expecting big targets based on the following key technical points:
Great Correction (Fib):
The price underwent a deep correction of more than 61.8%, almost reaching the 0.786 Fibonacci retracement level from the top.
Price Action Structure Change:
The price has changed structure since it broke the previous high on the monthly time frame and sustained weekly candle.
Ichimoku Confirmation:
There is a strong TS & KS breakout, and it looks poised to break the cloud as well. A strong base has been created, and a breakout has occurred.
Fib Channel + Fib Extension:
The price respected the channel bottom and reversed strongly. Based on the channel targets, there is a high chance of hitting 360+ in the coming months.
Wave Analysis and Targets:
The stock is in either Wave C or Wave 3. The minimum targets for Wave C are 287 (61.8%) and 394 (100%). Any move beyond this is a bonus.
Use Ichimoku (Daily Time Frame) for Higher Profits:
Disclaimer: We are not SEBI registered. The content presented here is based on our personal opinions. Conduct your own research and consult with a qualified financial advisor before making any investment decisions.

SONACOMS Bullish breakout predictionSona BLW Precision Forgings, an India-based automotive technology company, designs, manufactures, and supplies engineered automotive systems and components, including differential assemblies, gears, and EV Traction motors.
If we look at the chart:
The market has broken to the upside with very good volume. The market has broken the trendline to the upside. Also, the market is receiving support at 200 EMA. After the support, it has consolidated and then given a bullish hammer.
We can make an entry with Risk:Reward: 1:2.6.
Plan of Action:
Buy: 651-655
Stop loss: 614
Final Target: 747

bullish breakout of weekly flag and pole pattern in IRFCA Bullish Flag and Pole pattern is visible on the Daily chart of NSE:IRFC
The Flag and Pole pattern is a bullish continuation pattern and it is visible in charts after a meaningful appreciation in the price.
MACD gave Positive crossover on Daily, Weekly and Monthly chart. So, expecting the momentum to continue.
One can create a fresh position in the scrip as per the levels mentioned on the chart.
Risk Disclaimer:
The trading ideas and analyses presented here are for educational purposes only and do not constitute financial advice. Trading and investing in financial markets involve risk. You should carefully consider your own financial situation, risk tolerance, and investment objectives before making any investment decisions.
The information provided in this analysis is based on my personal interpretation of market conditions and the available data at the time of writing. It is subject to change without notice, and I cannot guarantee the accuracy, completeness, or timeliness of the information provided.
Trading and investing carry the risk of substantial losses, and past performance is not indicative of future results. Always be aware that markets can be unpredictable, and prices may move against your trade or investment.
It is advisable to seek advice from a qualified financial professional and to conduct your own research before making any investment decisions. You should only invest funds that you can afford to lose.
I am not responsible for any trades or investments made based on the information presented in this analysis. By reading and using this information, you acknowledge and accept that you are solely responsible for any losses you may incur.

rossellind long setupstock : rossellind
trade : long (cash segment)
buy @ 515 above
sl @ 473
target @ 600
note :
this information is for education only

bajajcon long trade stock : bajajcon (bajaj consumer)
trade : long (cash segment)
buy @ 260 above
sl @ 243
target @ 300
note :
this information is for education only

tajgvk breakout with high volume stock : tajgvk (tajgvk hotels)
trade : long (cash segment)
buy @ 422 above
sl @ 378
target1 @ 470
target 2 @ 495
target 3 @ 550
note :
this information is for education only

nlcindiastock : nlcindia
trade : long (cash segment)
buy @ 294 above
sl @ 234
target @ 290
note :
this information is for education only

asahisongstock : asahisong
trade : long (cash segment)
buy @ 396 above
sl @ 372
target @ 445
note :
this information is for education only

BREAKOUT IN CDSL 📌SWING TRADE FOR NEXT WEEK🚀
Hello Traders⚡
I am a Swing Trader by Passion i only trade on Momentum Stock's.
📌I Post Daily SWING CHARTS Analysis on My Trading view profile..
So let's Start
📌TRADE ANALYSIS OF -CDSL-
• Potential Breakout Chart
• VCP Pattern
• Short Range Consolidation
• Price Can Take Retest from support Line
• Overall The Price Is Moving In HH-HL Formation
• Volume Buildup Near BO Zone
• Looks Good For 10-20% Upside Levels After The Breakout
📌 If you have any questions about any stock you can comment on post 📱
📌Disclaimer:-
This all chatrs analysis are only for educational purposes only
I do not provide any CALL or Tips

Technical Analysis for MTAR Technologies
Chart Pattern: Trendline Support
Trade Type: Reversal Trade
Risk-Reward Ratio: 1:4
Trade Duration: One year
Stop Loss (SL): ₹1612 for risk management
Target: ₹2800

Silver looking Charminglooking really bullish if it breaks out and sustain above 30 then we can see the targets shown in the chart and I can see it may touch all time high this time after 2011
Get Ready for Big Move in the Silver
Investment and Trading is Subject to market risk. take independent advice before investing or trading into it

Syngene ConsolidationI found one of the most potential stock to invest with highly potential uptrend
Stock already consolidated for a longer period of time from and formed four bottom which I have mentioned in the charts which is good sign but yes we will have to wait for breakout of the stock and once it get broken out the stock we may achieve the targets mentioned in the chart.
Take independent advice before investing or trading as it's subject to market risk.
