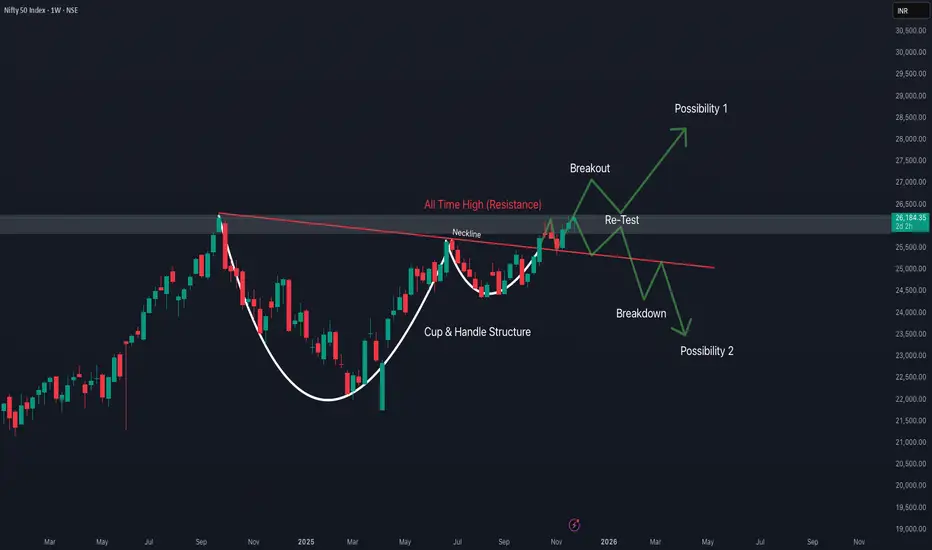
Weekly Price Action in Nifty 50The chart shows a classic Cup & Handle pattern
The cup is wide and smooth – a strong long-term accumulation pattern.
The handle is small, healthy, and formed near resistance → a sign of strength.
These patterns on the weekly chart typically lead to multi-month rallies.
The chart structure is strongly bullish unless Nifty falls below 25,500.
Structure
BITCOIN NEED BREATHE CRYPTO:BTCUSD
BTC need take relief of selling because selling is continuously happened so one little bounce is possible and that bounce works as retest of channel breakdown.
Reverse Scenario:
Formation of any bottom pattern
V shape recovery
Long consolidation after with volume brake out.
All chances is possible but there are low possibility
🧠 Always DYOR (Do Your Own Research)
⚖️ This is not financial advice or suggestion
👉 “Risk Is Real 💸 Stay Practical🚀”
💬 Please feel free to ask any questions (It's Free)

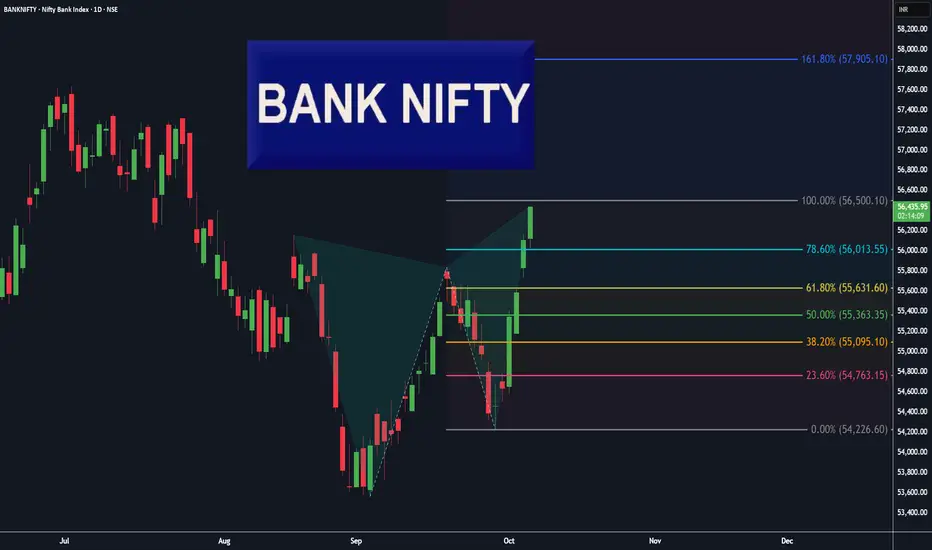
BankNifty Daily, Butterfly pattern completed!Beautiful Butterfly 🦋 pattern has completed on Daily chart of BankNifty.
Expect some profit booking or neutral trend in coming days up-to 55840 level.
Most near level is the re-test of 78.6% level ( 56013 ), for a new UP trend ( investors ).
" Buy 🟢 " above 56013 with the stop loss 🔻 of 55840, for the
🎯 Target 1: 56300
🎯 Target 2: 56500
🎯 Target 3: 57000
🎯 Target 4: open.
" Sell 🔴 " below 55631with the stop loss 🔺 of 55843, for the
🎯 Target 1: 55363
🎯 Target 2: 55095
🎯 Target 3: 54763
🎯 Target 4: open.
Smart Levels is Smart Trading. 👨🎓
⚠ RISK DISCLAIMER :
All content provided by "TradeWithKeshhav" is for information & educational purposes only.
It does not constitute any financial advice or a solicitation to buy or sell any securities of any type. All investments / trading involve risks. Past performance does not guarantee future results / returns.
Always do your own analysis before taking any trade.
Regards :
@TradeWithKeshhav & team
Happy Trading and Investing!
Nifty 50 Daily, Trend Based Fibonacci Extension (Natural levels)Hey Traders, I hope you all are doing well in your life.
Market is nature's response and Price is the God.
Let's check the market with the help of natural levels tool : Trend Based Fibonacci Extension .
After forming a ' W ' pattern on Daily chart, Nifty50 has given a pull-back ( base for Fib-Extension level tool, 24587 ).
Most near level is the re-test of 38.2% level ( 24980 ), for a new UP trend ( investors ).
" Buy 🟢 " above 25110 with the stop loss 🔻 of 24980, for the
🎯 Target 1: 25402
🎯 Target 2: 25650
🎯 Target 3: 26260
🎯 Target 4: 26500.
" Sell 🔴 " below 24960 with the stop loss 🔺 of 25110, for the
🎯 Target 1: 24880
🎯 Target 2: 24780
🎯 Target 3: 24680
🎯 Target 4: 24500.
Smart Levels is Smart Trading. 👨🎓
⚠ RISK DISCLAIMER :
All content provided by "TradeWithKeshhav" is for information & educational purposes only.
It does not constitute any financial advice or a solicitation to buy or sell any securities of any type. All investments / trading involve risks. Past performance does not guarantee future results / returns.
Always do your own analysis before taking any trade.
Regards :
@TradeWithKeshhav & team
Happy Trading and Investing!

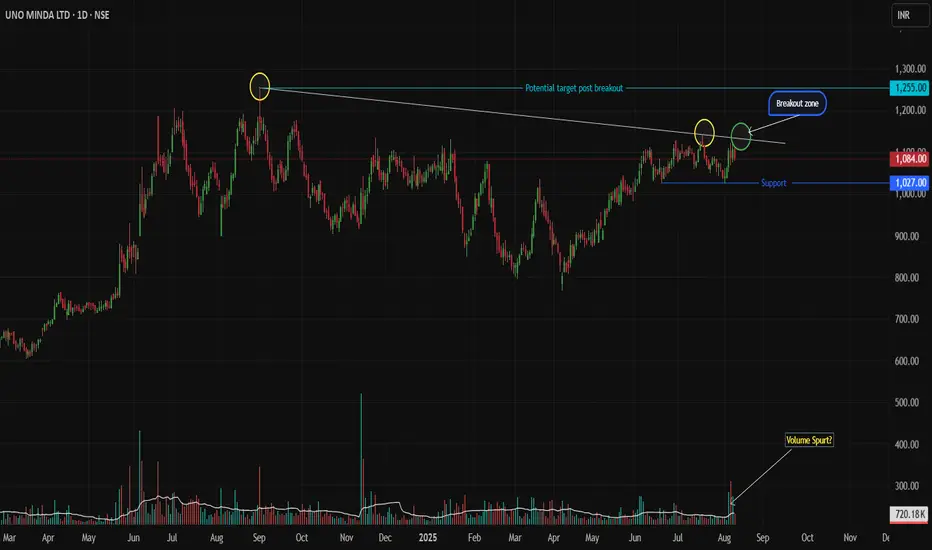
Uno Minda: Triple Trendline Test - Breakout or Pullback Setup Uno Minda Price Action Setup
(Daily Timeframe | Pure Price Action + Volume)
Key Structure
Resistance Trendline: Tested twice (02-Sep-2024 & 17-Jul-2025). Price now approaches it for the 3rd attempt.
Support Zone: Strong base at 1027 (recent swing low).
Long-Term Trend: Bullish (higher highs/lows).
Trade Scenarios
SCENARIO 1 : Trendline Breakout
Trigger:
Daily breakout candle closes above the resistance trendline.
Candle must be strong bullish (full-bodied green) with volume > 20-day average.
Entry: On confirmation of breakout (next candle open/close above breakout candle’s high).
Stop Loss: Low of the breakout candle.
Targets:
First: 1255 (take partial profits).
Trail balance with trailing SL (e.g., below recent swing lows).
SCENARIO 2 : Pullback to Support
Trigger:
Price retests 1027 support, followed by a strong bullish reversal candle (e.g., Bullish Engulfing/Hammer) with rising volume.
Entry: After reversal candle closes (confirmation).
Stop Loss: Below the low of the reversal candle.
Targets:
First: 1130 (take partial profits).
Trail balance aggressively.
Risk Management
Position Size: Risk ≤ 1% capital per trade.
Avoid chasing: Enter only on confirmed triggers.
Invalidation: Exit if price closes below SL levels.
Disclaimer
This idea is educational only. Not financial advice. Trading carries high risk. Past performance doesn’t guarantee future results. Always test strategies in a demo account. Consult a financial advisor before trading.
Boost 👍 if helpful! Comment below for other stocks you want analyzed.
Keep it price-driven. Trade safe! 💡
ABCapital’s Daily Retest: Bullish Bounce IncomingOn the Daily timeframe, price is revisiting the ₹244–₹248 zone, which had capped rallies three times before the breakout on 17 June 2025. After carving out a classic rounding bottom, ABCapital surged—now it’s offering a second chance to enter:
- Zone to Watch: ₹244–₹248 (prior resistance → new support)
- Timeframe: Daily
- Trend: Strongly bullish in both short and long term
- Upcoming Catalyst: Q2FY26 earnings on 4 August 2025
- Entry Strategy:
1. Look for bullish price action (pin‑bar, bullish engulfing, etc.) on daily candles
2. Verify with a volume pickup on the bounce before initiating a long 👍
Why It Works
- Daily retests of former resistance zones often lead to reliable bounces
- Rounding bottom reflects deep accumulation by smart money
- Daily trend remains intact until broken with conviction
Risk Management
• Stop‑loss just below ₹242
• Trail stops higher as price confirms strength
Targets
- Short‑term: ₹260
- Long‑term: ₹280+ and keep trailing.
🚀 A textbook daily‑timeframe retest in a powerful uptrend—perfect for fresh entries or scaling in.
Disclaimer: This is not financial advice. Conduct your own due diligence and manage risk prudently.
If this resonates, 👍 Boost, 💬 Comment, and 📝 Share your take!
❓ Got another stock in mind? Feel free to ask me which ticker you’d like analyzed next!
Ask ChatGPT

Deepak Fertilizers - Cup and Handle ContinuationAs you all can see there is a beautiful cup followed by a handle on the Weekly timeframe.
After the pattern broke out, the stock managed the market sell off pretty well by retesting its previous supply zone (now demand zone) and maintained the sideways trend without spoiling the pattern.
This sudden surge implies that the stock is ready to continue its uptrend.
Talking about fundamentals:
- High Management Efficiency with a high ROCE of 17.10%
- The company has a high Debt to EBITDA ratio of 1.88 times
- Healthy long term growth as Operating profit has grown by an annual rate 40.09%
- Positive results in Dec 24
- OPERATING PROFIT TO INTEREST(Q) Highest at 4.94 times
- NET SALES(HY) At Rs 5,325.74 cr has Grown at 24.53 %
- DEBT-EQUITY RATIO(HY) Lowest at 0.67 times
- With ROCE of 14.4, it has a Fair valuation with a 1.9 Enterprise value to Capital Employed
- The stock is trading at a discount compared to its average historical valuations
- Over the past year, while the stock has generated a return of 106.57%, its profits have risen by 0.5%
- High Institutional Holdings at 20.38%. Their stake has increased by 0.7% over the previous quarter.

Bear Market Survival Guide : Strategy vs Area of TradingI make educational content videos for swing / positional trading

Nifty laying traps... another one for sellers...Hello Traders!
The market is constantly trapping sellers without moving to the downside. Right now, nothing in draw on liquidity is obvious. It, frankly, can go either ways . And what does it mean when we can frame both sides of market using ICT concepts? It means that we have LOW PROBABILITY conditions . I'm sitting on the sidelines until the market gains clarity, favouring buyside delivery.
As long as the invalidation low of 22725 holds, my bias would remain bullish . Once that low is taken, I'm not interested in price and would wait for the market to provide more info.
When it looks that it can go either ways, the market structure gets filthy and PRECISION leaves the chat. WAIT FOR MORE CLARITY . Or gamble . It's absolutely your choice .
Have a safe trading day.
GLGT.

HDFC AMC on support HDFC AMC looks good reason --
* Fundamentals Strong
*price is near about its Previous all time high

Parallel channel breakout with retest in Laurus LabsNSE:LAURUSLABS
A bullish parallel channel breakout has happened with a retest at 550 levels.
Currently on a weekly level stock can go past 600 with a buying price at 570-580 levels & subsequently increase beyond 600.
A SL of 450 with a higher target of 700, 900 & 1100 can be achievable in 1 1-year time frame.

$BTC Price Forecast: $75K, $85K, or $108K?Currently, I see three potential scenarios for BTC:
1. BTC is forming lower highs and may retest the previous resistance around the $108,000 level. After that, it could pull back to the $100,000 area before making a new all-time high.
2. BTC might retest the $90,000 level and then move upward. Alternatively, if it loses support at $90,000, it could drop to $85,000 before starting an upward trend.
3. In a worst-case scenario, BTC could undergo a significant correction, dropping as low as $75,000.

USDT.D BULLISH DIVERGENCE SET TO BLEED BTCCRYPTOCAP:USDT.D has formed a bullish divergence and a clear double bottom with proper higher lows, signaling a potential surge toward the 4% to 4.10% resistance area. This movement could lead to a significant drop in BTC and altcoins, as USDT.D and the crypto market are inversely correlated.


USDT.D RSI Oversold, Expected Bounce to 5%-5.5%, Bearish for BTCCRYPTOCAP:USDT.D shows signs of a potential bounce as RSI has reached oversold territory, indicating a likely move up to the 5%-5.5% area.
With #USDT.D rising, we expect #Bitcoin and altcoins to face downward pressure due to the inverse relationship between USDT dominance and the broader crypto market.
Watching for confirmation of this bounce could provide shorting opportunities in CRYPTOCAP:BTC & #crypto .

BITCOIN FORMED BULLISH DIVERGENCE FUELING TO 75KScenario 1: CRYPTOCAP:BTC Moves Up with Strong Volume After a Rate Cut
Bullish Divergence Support: The bullish divergence suggests that #Bitcoin is gaining strength, indicating a potential upward move.
Volume Confirmation: If BTC moves up with solid volume post-rate cut, it could break through 74k and potentially head higher. Increased volume after the rate cut could be a sign that institutional or retail investors are confident in the rally, driving prices above previous resistance levels.
Target: If this scenario plays out, BTC could surpass the 74k mark, especially if the broader market sentiment is favorable post-rate cut.
Scenario 2: BTC Reaches 73k, Then Faces Another Correction
Resistance at 73k: If BTC reaches 73k but struggles to break above it, this would indicate a strong resistance zone. A pullback could follow as the market hesitates or prepares for another consolidation phase.
Correction Potential: In this case, CRYPTOCAP:BTC may correct before attempting another rally. This could be a short-term dip that sets the stage for a more significant breakout once the market rebalances.
Target: If the price reaches 73k but can't break it, then a pullback would likely bring BTC back into a lower range for a while before making another attempt at the next breakout.
Key Factors to Watch:
1. Volume: As you noted, volume is crucial. A strong volume push above resistance (like 73k) would favor Scenario 1.
2. Macro Events: The rate cut and overall macroeconomic factors could heavily influence the market. If the rate cut signals more liquidity or favorable conditions for risk assets like Bitcoin, Scenario 1 becomes more probable.
3. Market Sentiment: The overall sentiment in both crypto and traditional markets will play a role. If broader financial markets are stable or bullish, Bitcoin could push past the resistance levels.
Ultimately, monitoring the price action around the 73k and 74k levels, as well as volume trends, will help clarify which scenario is more likely.


Swing Stock retestes the previous level from where it gave breakout now giving a reversal signal after form my point of you this stock is very bullish now.
As a swing trader 10To12% is very easy in this stock at this level

Swing Last in 2015 this stock given breakout but at retest level it failed and came down to 335
Then tried multiple times to give breakout at the same level of from where it falled in 2015
But this time in 2024 this green BO candel closed above the resistance line and while retesting it sustained it support line from where it falled in 2015.
When reversal came it closed above its resistance line in Day Tf also in week Tf also
BULLISH

BAJAJ FINANCEHello and welcome to this analysis
After reversing from a bearish harmonic Gartley pattern its now gone on to test its previous breakout level.
In lower time frame its forming a bullish RSI divergence. Sustaining above 7400 it could retest 7700 and more provided it does not break 7200.
Happy trading and investing

ASHOK LEY LAND Getting Attractive For LongAshok Ley Land
On Retracement Mode After Respecting the tgt of 265±
Longterm Investors
Can accumulate till 185.
Looks good in Parabolic UPTREND PATTERN & ELLIPTICAL BREAKOUT ALSO SEEN.
(Based on Elliptical structure 207± support looks good)
TARGETS EXPECTED ARE MARKED IN THE CHART.
Shared it for Reference Purpose Based on CHART PATTERN.
Kindly do Your Analysis From Your Side.
This is not a BUY or SELL RECOMMENDATION from my side.

Retesting it's Breakout and About to Break Major Levels NSE:TECHM is retesting its resistance on a weekly timeframe, if 1530-1574 is sustained it can easily go to ATH Levels of 1838. Keep in Radar
Check out my other stock ideas below until this trade gets activated, I would love your feedback.
Disclaimer: This analysis is intended solely for informational and educational purposes and should not be interpreted as financial advice. It is advisable to consult a qualified financial advisor or conduct thorough research before making investment decisions.

Can you again win with JIOFIN ?After the breakout from the descending channel, retest seems to be complete.
This company needs no introduction. Right !!!
