SUNPHARMA FACING HUDRLE NEAR RESISTANCE ZONESunPharma has formed a bearish pattern and until it sustains above 1260, will remain weak and we expect to see 1190 and 1175 on the downside.
To motivate us, Please like the idea If you agree with the analysis.
Happy Trading!
Sunpharmatarget

Sunpharma Price ActionBuy Sunpharma If Any Weekly Close Above 1105
SL - 1063 ( Weekly Closing Basis )
Target - Open

Bearish Harmonics In SunpharmaSell PRZ
Bearish Cypher - 1045.15
Bearish Shark - 1057.8
SL - 1073
Target - 1026/1006
If SL Triggers.
Sell PRZ
Bearish Alt Shark - 1088.5
SL - 1107
Target - 1026/1006

SUN PHARMA | SHORT @ 990 - 995Short Sun Pharma @ 990 - 995 for the target of 930.
To motivate us, Please like the idea If you agree with the analysis.
Happy Trading!
InvestPro India Team

SUN PHARMA | BIG UPSIDE ABOVE 970Sun Pharma in bullish momentum and big upside targets will open if sustains above 970.
To motivate us, Please like the idea If you agree with the analysis.
Happy Trading!
InvestPro India Team

Sunpharma On HnS Patternlooking like after a long consolidation the scrip is papering to hit 1100. Keep the stock in radar and trade well.

Sunpharma might form a new high (26/09/22).Sunpharma on the weekly time frame has given a nice bullish engulfing candle and a nice 6% return this week.
The market has given a negative return but this stock has remained in green.
There is possibility of another up move in the coming week and the stock may form new 52 week high.
It is following the market movement. It has broken the resistance level of 900 and retest the levels.
Three points confirmation for a trade
1. Crossed 20 ema on the daily time frame.
2. Closing above the resistance level, high volume break out and closing above 200 ema on weekly time frame.
3. Candlestick pattern :- Bullish engulfing pattern.
If the stock breaks and closes above the levels of 925 on the daily time frame, a trade can be initiated.
Targets :- 940-45, 950
Wait for the stock price to cross the level. Watch for the price action near the levels before entering the trade.
A swing or intraday trades can be taken in the stock.

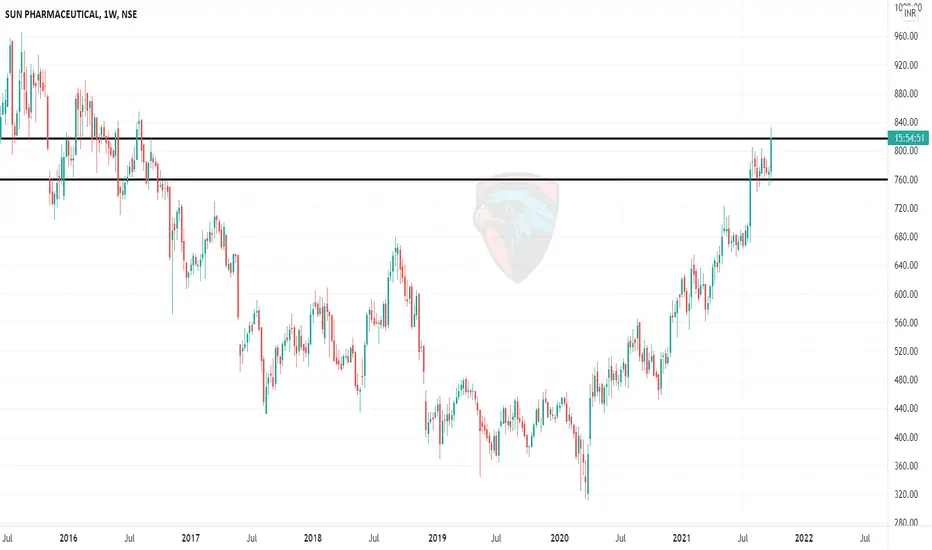
SUNPHARMA looking strongNSE:SUNPHARMA
SUNPHARMA looking with increase in volume, can be good for short term
buying can be done above 861 above the the resistance ZONE.

Sunpharma analysisPaper Trade recommendation only.
Looking Bullish from here.
Stuck in between Symmetric triangle.
If crossed & sustained above 850 then we will see 873 sooner.
Time frame 15 min.

Simple Trade Setup | SUN PHARMA | 02-05-2022 [INTRADAY]NSE:SUNPHARMA
Observations:
1) On 1day time frame, we can see it made inverted hammer in up trend and after making new high it was facing huge selling.
If it starts to trade below this candle's low which is 919.55 then the pressure of selling will start. And as per technical levels 920 is breakdown level and 900 is last major breakdown level of it.
Please refer below chart : 1day time frame.
-------------------------------------
Trade Setup for 02-05-2022
1) Don't Jump in to trade at the beginning of the market. Let it get settle for 15-20min first and judge the price action.
2) Everything is mentioned on the chart. I hope it is easy to understand.
3) All the levels will work as support, resistance, entry and exit w.r.t price action near that level.
4) Avoid gap up or gap down chase. Wait and trade between levels.
Please refer below chart for levels.
Hope I made it easy to understand it.
Do comment your doubt or suggestion.
Note: Trade with Strict SL. It may or may not hit all the levels. So one can book profit / loss at respective level considering how price action works near that level.

SunPharma Analysis | Sun Pharma Analysis | weekly view 20 april
Where you will invest for future returns?
FD / Mutual Fund / LIC Bond
Wow Descending Triangle formed.
Now we have to wait for breakout either side "15 min preference" should sustain first.
Condition 1: We will only look for Buying once 931 taken out reason being two levels will crossed (Price Action & Triangle).
Initial Target (IT) : 938.
Exit Target or starts trailing from here : 942.
Condition 2: Sell activates once 919 taken out & sustain.
Initial Target (IT) : 912
Exit Target or starts trailing from here : 907.45.
Note : Patience is the only key for success.

Simple Trade Setup | SUN PHARMA | 01-04-2022 [INTRADAY]NSE:SUNPHARMA
Observations:
1) 15min chart for reference.
Please refer below chart : 15min Time Frame.
2) Same chart on 1 day time frame.
Please refer below chart : 1day Time Frame.
-------------------------------------
Trade Setup for 01-04-2022
1) Don't Jump in to trade at the beginning of the market. Let it get settle for 15-20min first and judge the price action.
2) Everything is mentioned on the chart. I hope it is easy to understand.
3) All the levels will work as support, resistance, entry and exit w.r.t price action near that level.
4) Avoid gap up or gap down chase. Wait and trade between levels.
Please refer below chart for levels.
Hope I made it easy to understand it.
Do comment your doubt or suggestion.
Note: Trade with Strict SL. It may or may not hit all the levels. So one can book profit / loss at respective level considering how price action works near that level.


SUNPHARMA | SELL ONLY BELOW 870Sun Pharma has shown a good run-up and looking to play some retracement. Sell only if it sustains below 870 for the lower marked targets on the chart.
To motivate us, Please like the idea If you agree with the analysis.
Happy Trading!
InvestPro India Team

Simple Trade Setup | SUNPHARMA | 27-12-2021 [INTRADAY]NSE:SUNPHARMA
Trade Setup for Date: 27-12-2021
1) Don't Jump in to trade at the beginning of the market. Let it get settle for 15-20min first and judge the price action.
2) Everything is mentioned on the chart. I hope it is easy to understand.
3) All the levels will work as support, resistance, entry and exit w.r.t price action near that level.
4) Avoid gap up or gap down chase. Wait and trade between levels.
Please refer below chart for levels.
Hope I made it easy to understand it.
Do comment your doubt or suggestion.
Note: Trade with Strict SL. It may or may not hit all the levels. So one can book profit / loss at respective level considering how price action works near that level.

Simple Trade Setup | SUNPHARMA | 22-12-2021 [INTRADAY]NSE:SUNPHARMA
Trade Setup for Date: 22-12-2021
1) Don't Jump in to trade at the beginning of the market. Let it get settle for 15-20min first and judge the price action.
2) Everything is mentioned on the chart. I hope it is easy to understand.
3) All the levels will work as support, resistance, entry and exit w.r.t price action near that level.
4) Avoid gap up or gap down chase. Wait and trade between levels.
Please refer below chart for levels.
Hope I made it easy to understand it.
Do comment your doubt or suggestion.
Note: Trade with Strict SL. It may or may not hit all the levels. So one can book profit / loss at respective level considering how price action works near that level.

Simple Trade Setup | SUNPHARMA | 20-12-2021 [INTRADAY]NSE:SUNPHARMA
Observations:
1) On 1day time frame, it is trading below 100DMA but it took support from 21DMA.
Since short term average is below the long term averange, it is a sign of bearish.
But if it managed to trade above 100DMA then it will be again a buy trade.
21DMA is placed at 763.35 level and 100DMA is placed at 783.82.
We can see that level range of 760 is immediate suppport and level range of 785 is immediate resistace.
Please refer below chart : 1day Time Frame.
2) On 1 day time frame, we can see that it is trading at the bottom trendline of the parallel channel. If it maintain to keep the support from this trendline then we can see an upmove till middle trendline of parallel channel.
On breakdown of this bottom trendline it will be bearish.
Please refer below chart : 1day Time Frame.
-------------------------------------
Trade Setup for Date: 20-12-2021
1) Don't Jump in to trade at the beginning of the market. Let it get settle for 15-20min first and judge the price action.
2) Everything is mentioned on the chart. I hope it is easy to understand.
3) All the levels will work as support, resistance, entry and exit w.r.t price action near that level.
4) Avoid gap up or gap down chase. Wait and trade between levels.
Please refer below chart for levels.
Hope I made it easy to understand it.
Do comment your doubt or suggestion.
Note: Trade with Strict SL. It may or may not hit all the levels. So one can book profit / loss at respective level considering how price action works near that level.

Simple Trade Setup | SUN PHARMA | 01-11-2021 [ INTRADAY]NSE:SUNPHARMA
Observations:
1) On daily time frame, it just closed at 50DMA.
50DMA is placed at 795.19 level.
Please refer below chart : 1day Time Frame.
2) Also on daily time frame, as we already know it has been trading in up trend parallel channel.
And it took support from middle trendline of parallel channel.
Please refer below chart : 1day Time Frame.
3) On 1hr time frame, we can see head and shoulder pattern. Necl line is 795-800 level range.
Scenario -1 If it opens above this neckline and goes down then gets support from this neckline then it will be buy trade.
Scenario -2 If it opens below this neckline and goes up then faces resistance from this neckline then it will be short trade.
Please refer below chart : 1hr Time Frame.
-------------------------------------
Trade Setup for Date 01-11-2021:
1) Don't Jump in to trade at the beginning of the market. Let it get settle for 15-20min first and judge the price action.
2) Everything is mentioned on the chart. I hope it is easy to understand.
3) All the levels will work as support, resistance, entry and exit w.r.t price action near that level.
4) Avoid gap up or gap down chase. Wait and trade between levels.
Please refer below chart for levels.
Hope I made it easy to understand it.
Do comment your doubt or suggestion.
Note: Trade with Strict SL. It may or may not hit all the levels. So one can book profit / loss at respective level considering how price action works near that level.

Simple Trade Setup | SUN PHARMA | 26-10-2021 [ INTRADAY]NSE:SUNPHARMA
Observations:
let's take look at NIFTY PHARMA index.
1) On Daily time, we can see that it took good reverse from 200DMA and made dragon fly doji.
As per the textbook knowledge, it should work as trend reversal.
We might see good upmove in most of Pharma stock now.
Please refer below chart : 1day Time Frame.
-------------------------------------
Now let's look at SUN PHARMA.
1) On 1 Day time frame, today it made kind of Doji candle and also it took support from 50DMA range and closed above 810 level.
Please refer below chart : 1day Time Frame.
-------------------------------------
All the levels and most of the trade setup still remains the same as per previous.
Trade Setup for Date 26-10-2021:
1) Don't Jump in to trade at the beginning of the market. Let it get settle for 15-20min first and judge the price action.
2) Everything is mentioned on the chart. I hope it is easy to understand.
3) All the levels will work as support, resistance, entry and exit w.r.t price action near that level.
4) Avoid gap up or gap down chase. Wait and trade between levels.
Please refer below chart for levels.
Hope I made it easy to understand it.
Do comment your doubt or suggestion.
Note: Trade with Strict SL. It may or may not hit all the levels. So one can book profit / loss at respective level considering how price action works near that level.

Simple Trade Setup | SUNPHARMA | 22-10-2021 [ INTRADAY ]NSE:SUNPHARMA
Observations:
1) On 1 day time frame, it hold and closed above 21DMA. 21DMA is placed at 811.67 level range.
Level range from 810-812 will work as good support now.
Breakdown of it will lead it to down move.
Please refer below chart : 1day Time Frame.
-------------------------------------
Trade Setup for Date 22-10-2021:
1) Don't Jump in to trade at the beginning of the market. Let it get settle for 15-20min first and judge the price action.
2) Everything is mentioned on the chart. I hope it is easy to understand.
3) All the levels will work as support, resistance, entry and exit w.r.t price action near that level.
4) Avoid gap up or gap down chase. Wait and trade between levels.
Please refer below chart for levels.
Hope I made it easy to understand it.
Do comment your doubt or suggestion.
Note: Trade with Strict SL. It may or may not hit all the levels. So one can book profit / loss at respective level considering how price action works near that level.

Simple Trade Setup | SUNPHARMA | 19-10-2021 [ INTRADAY]NSE:SUNPHARMA
Trade Setup for Date 19-10-2021:
Most of the levels will remains the same as per previous setup.
1) Don't Jump in to trade at the beginning of the market. Let it get settle for 15-20min first and judge the price action.
2) Everything is mentioned on the chart. I hope it is easy to understand.
3) All the levels will work as support, resistance, entry and exit w.r.t price action near that level.
4) Avoid gap up or gap down chase. Wait and trade between levels.
Please refer below chart for levels.
Hope I made it easy to understand it.
Do comment your doubt or suggestion.
Note: Trade with Strict SL. It may or may not hit all the levels. So one can book profit / loss at respective level considering how price action works near that level.

Simple Trade Setup | SUNPHARMA | 11-10-2021 [INTRADAY]NSE:SUNPHARMA
Trade Setup for Date 11-10-2021:
1) Don't Jump in to trade at the beginning of the market. Let it get settle for 15-20min first and judge the price action.
2) Everything is mentioned on the chart. I hope it is easy to understand.
3) All the levels will work as support, resistance, entry and exit w.r.t price action near that level.
4) Avoid gap up or gap down chase. Wait and trade between levels.
Please refer below chart for levels.
Hope I made it easy to understand it.
Do comment your doubt or suggestion.
Note: Trade with Strict SL. It may or may not hit all the levels. So one can book profit / loss at respective level considering how price action works near that level.

Simple Trade Setup | SUNPHARMA | 01-10-2021[ INTRADAY]NSE:SUNPHARMA
Observations:
1) On 1hr time frame we can see parallel channel uptrend.
Please refer below chart : 1hr Time Frame.
-------------------------------------
Trade Setup for Date 01-10-2021:
1) Don't Jump in to trade at the beginning of the market. Let it get settle for 15-20min first and judge the price action.
2) Everything is mentioned on the chart. I hope it is easy to understand.
3) All the levels will work as support, resistance, entry and exit w.r.t price action near that level.
4) Avoid gap up or gap down chase. Wait and trade between levels.
Please refer below chart for levels.
Hope I made it easy to understand it.
Do comment your doubt or suggestion.
Note: Trade with Strict SL. It may or may not hit all the levels. So one can book profit / loss at respsective level considering how price action works near that level.