TATACONSUM | Trendline + Cup & Handle - Looks Potential for 20%TATACONSUM | Trendline + Cup & Handle Breakout - Looks good for 20% in short term
CMP : 838 (Dip : 810)
SL : 775
Target : 960, 1000 (Fib)
1:5+ risk reward setup
Supply_and_demand

ICIL | Simple triangle breakout - Looks potential for 20-40%ICIL | Simple triangle breakout - Looks potential for 20-40%
CMP : 156
SL : 145
Target : 188, 220
1:3 risk reward setup for first target

EURUSD on Strong Support EURUSD on Strong Support waiting for 4hr close above the previous close to go Long.
Note: Trading is Subjective to market risk. So, Trade Safe with risk management.

JYOTHYLAB | Looks potential for 25-30% JYOTHYLAB | Looks potential for 25-30%
CMP : 190 (Dip : 180)
SL : 170
Target : 235
1:4 risk reward setup
Weekly time frame chart - safe players keep in watch list and take the entry after seeing the Weekly candle close.

Evening StarAnother reversal pattern at important juncture,
It seems like profit booking has occurred at supply zone.
Evening Star formation :
The support holds at low of first candle and same level has been tested today
17300-350 level is the point of the control zone , it has maximum volume spread.
Price pattern has created a confluence zone ,
It would act as strong support but if it goes below it, heavy selling is likely to occur

LEMONTREE entering in to Demand Zone !!NSE:LEMONTREE
#NSE:LEMONTREE looking to be solid Demand Zone, where the High Consolidation point.
Looking to be entering in to that zone to bounce back.
Complete levels with targets marked on chart !!

Nifty AnalysisNifty retracing back after kissing 18,000 levels and breaking 1hr trendline. Gaps made between 12-16 August & 11-12 August are also filled today. Nifty spot is currently at support zone of 17480. Bounce from current support level will take Nifty to 17700, while a breakdown of this support can take prices to 17200 and below.

Basing and Breakout formation Basing : Its accumulation phase where smart money comes in, it acts as a base.
Here price may follow the previous trend or shows reversal
Always take partial position, don't get trap by infusing entire position.
Volume activity remains low and you may see some heavy buying at support.
Psychology : participants are not ready to participate actively, it lacks enthusiasm.
Breakout phase :
Here, It may break the support or resistance The bigger the base, the stronger the rally can be.
If it breaks resistance add up your position and if it breaks support cut out your position.
Psychology : Here you will see the moment in price activity with higher spikes in volume.
Here they get the direction.

simple supply demand conversion tradeA good green candle should be at support zone for taking entry.
Entry- 1760
Aggressive SL- 1704 (3%)
Safe SL- 1680 (4.5%)
Target-1890,1934
because at 1930-1940, supply may resume so for safer side book your profit.

IGL | Simple trendline breakout - Looks potential for 25%IGL | Simple trendline breakout - Looks potential for 25%
CMP : 380
SL : 355
Target : 460
1:4 risk reward setup

#RUSHIL DECOR LONGTrade Or Invest Wisely.
We Can Just Predict.
Please Like And Share If You Agree With The Idea
Disclaimer: I Am Not A SEBI Registered Advisor, So Before Entering On My View Please Ask Your SEBI Registered Advisor. Profit Is Your And Loss Is Your.

ICICIPRULI | Trendline breakout - Looks potential for 25%ICICIPRULI | Trendline breakout - Looks potential for 25%
CMP : 582 (Dip : 570)
SL : 545
Target : 710
1:3+ risk reward setup

Nifty Market Prediction for 5 Aug, A Range boundIf you observe today's closing is in between the day's high and day's low, So for next there is high chances that market will be range bound after opening.
Just see the 1D TF NSE:NIFTY

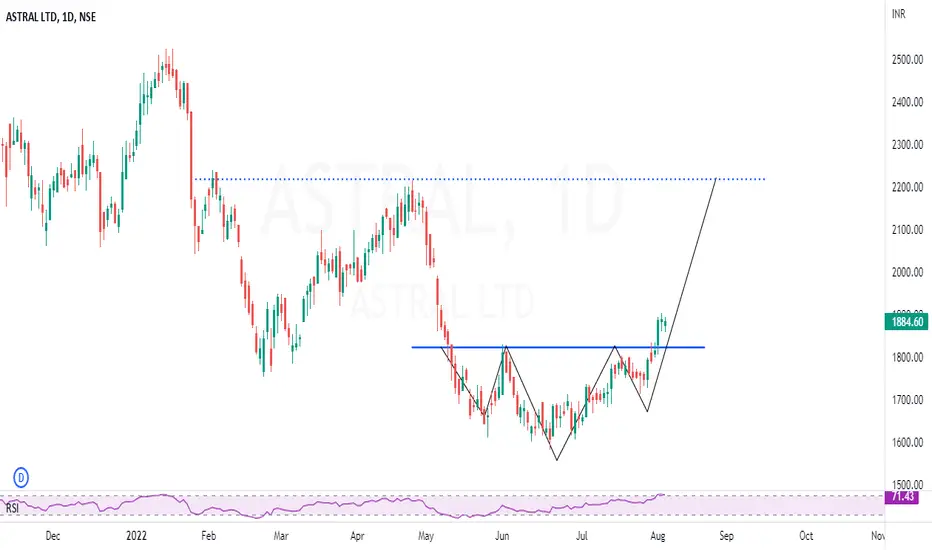
ASTRAL | Simple INHS pattern - Looks potential for 20%ASTRAL | Simple INHS pattern - Looks potential for 20%
CMP : 1885 (Dip : 1820)
SL : 1750
Target : 2200
1:4 risk reward setup
g,u for short hi im prasad supply and demand analysiser i share for you guys this very useful to you

SBI LifeSBI Life is at its all-time high, with solid candle and volume any pullback is buying opportunity, 1300 is a Do or Die level

SAPPHIRE | Flag setup - Potential for 30%SAPPHIRE | Flag setup - Potential for 30%
CMP : 1148 (Dip : 1100)
SL : 1060
Target : 1450
Pros : Flag, RSI, Risk reward
Cons : Wick on 6th July candle, My last 4 flag setup's failed when posted :)
1:4+ risk reward setup

KPRMILL | Channel breakout ahead - Potential for 25-30%KPRMILL | Channel breakout ahead - Potential for 25-30%
CMP : 578
SL : 530
Target : 750
1:4 risk reward setup

WILL DELTA CORP BOUNCE FROM FAVOURITE SMA?Trade Or Invest Wisely.
We Can Just Predict.
Please Like And Share If You Agree With The Idea
Disclaimer: I Am Not A SEBI Registered Advisor, So Before Entering On My View Please Ask Your SEBI Registered Advisor. Profit Is Your And Loss Is Your.

#EUR AUD # SELL PLAN I am looking to sell EUR AUD below 1.48800 and targeting to 1.48000 price broke major structure and continuation of down trend and also liquidated previous high and expecting an drop. we have a nice previous support on below 1.48000 and rest of stoploss must need to be a liquidation.

Nifty - 1 Hr Time Frame Support and ResistanceHi Traders,
Hereby sharing you the 1 Hour timeframe Support and Resistance levels in Nifty which is going to be the levels for this week.
Blue zones are Support levels and Orange Zones are Resistance levels.
Happy Trading!!

support and resistance for kotak bankits having next support of 1718.40 followed by 1696.50
and up side resistance of 1743.50 and 1755

$CAD CHF $ possible buy forecast I am looking to buy #CAD CHF# this week,, Expecting an retracement 0.75000 and continuation to the upside. We have confluences with major HEAD AND SHOULDER reversal pattern and price broke major resistance level and closed above with support and creating strong resistance with rejection. thanks.
