Sun Pharma trades sideways within a defined rangeTopic Statement:
Sun Pharma has remained in a sideways zone throughout the year, presenting recurring opportunities for accumulation at key technical levels.
Key Points:
1. The stock is rangebound between 1550 and 1800, with no clear breakout direction so far
2. It consistently takes strong support at the 23.6% Fibonacci retracement level at 1568
3. The stock can be accumulated when it dips below the 50-day EMA, with heavier investment opportunities when it falls below the 200-day EMA
Support and Resistance

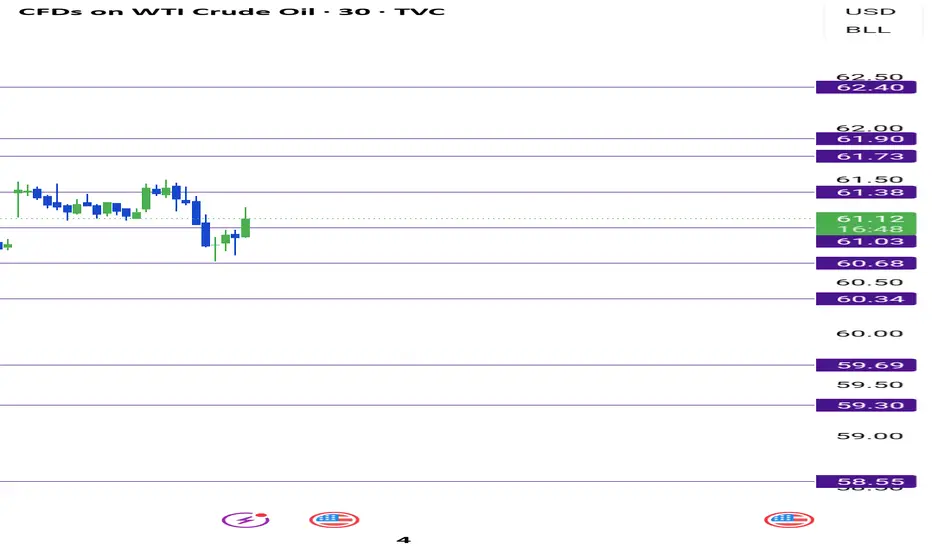
US OIL SUPPORT, RESISTANCE & TRENDLINE ANALYSIS Hello guyz hope uall r doing well. I am on a travelling spree so I apologize for not providing consistent updates.
Just trade along with the given levels provided. Do not be over greedy. Exit your trade each time it touches a level and book your profits. Don't loose your capital.
I shall provide more sharp and accurate updates when I will be home.
Nifty Intraday Analysis for 03rd November 2025NSE:NIFTY
Index has resistance near 25950 – 26000 range and if index crosses and sustains above this level then may reach near 26200 – 26250 range.
Nifty has immediate support near 25550 – 25500 range and if this support is broken then index may tank near 25350 – 25300 range.

Banknifty Intraday Analysis for 03rd November 2025NSE:BANKNIFTY
Index has resistance near 58200 – 58300 range and if index crosses and sustains above this level then may reach near 58700 – 58800 range.
Banknifty has immediate support near 57400 - 57300 range and if this support is broken then index may tank near 56900 - 56800 range.

Finnifty Intraday Analysis for 03rd November 2025 NSE:CNXFINANCE
Index has resistance near 27350 - 27400 range and if index crosses and sustains above this level then may reach near 27600 - 27650 range.
Finnifty has immediate support near 26950 – 26900 range and if this support is broken then index may tank near 26700 – 26650 range.

XAUUSD SUPPORT, RESISTANCE & TRENDLINE ANALYSISHello guyz hope uall r doing well. I am on a travelling spree so I.apologize for not providing consistent updates.
However, my levels shall remain the same and you'll can trade within the levels confidently.
Go for LONG only if it stays below 3980. If it breaks 3980 then you can plan for SHORT positions with a max target of 3929.

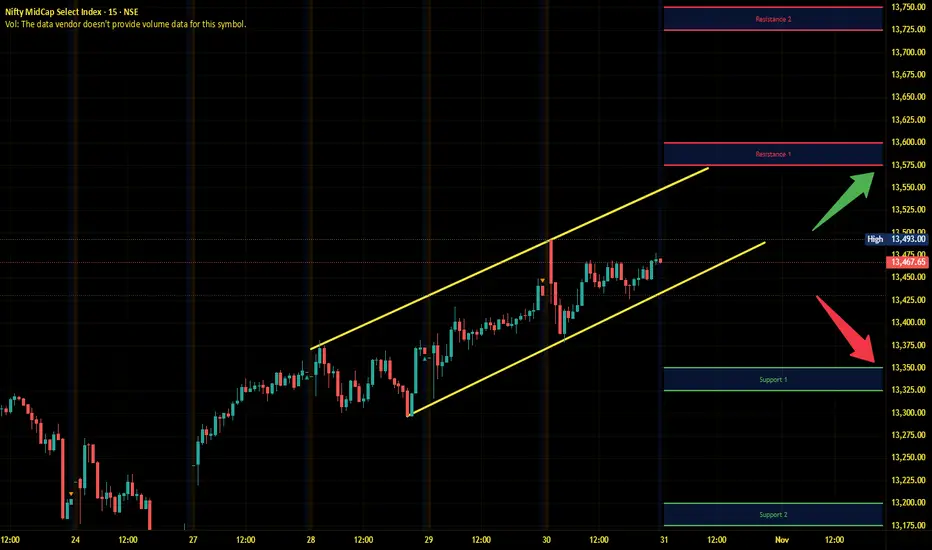
Midnifty Intraday Analysis for 03rd November 2025NSE:NIFTY_MID_SELECT
Index has immediate resistance near 13575 – 135600 range and if index crosses and sustains above this level then may reach 13725 – 13750 range.
Midnifty has immediate support near 13350 – 13325 range and if this support is broken then index may tank near 13200 – 13175 range.

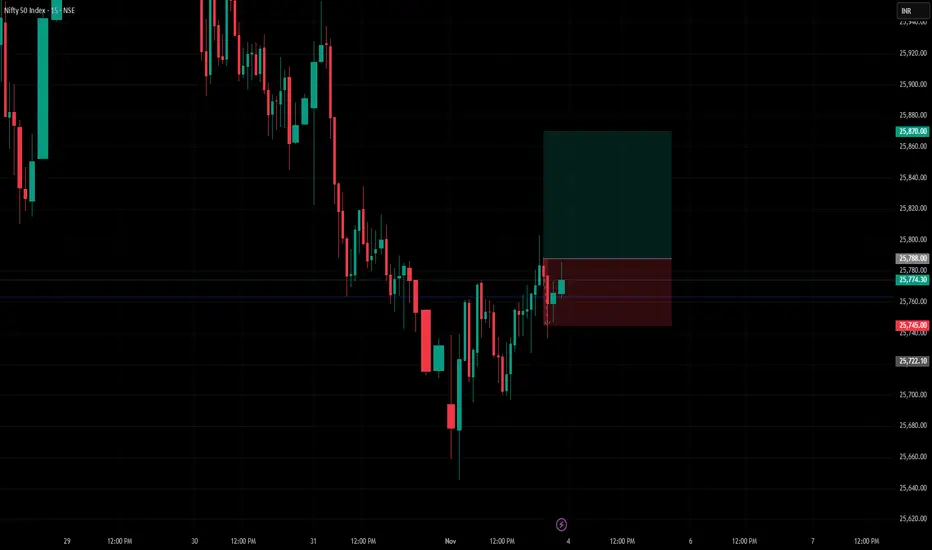
Nifty Intraday Long, Stop Loss and Target Levels markedExpecting bulls to be aggressive if nifty crosses strong above 25788 and the target will be 25870.
In case if nifty falls below 25745, then the bears will take the control.
Accordingly marked the chart with long, target and stop loss points
FIL 4H Technical Analysis — Cycle & Key Levels Overview📊 Cycle Structure:
HWC (Higher Wave Cycle): Bullish 🔽
MWC (Middle Wave Cycle): Range 🔁
LWC (Lower Wave Cycle): Bearish 🔼
📌 Market Context & Structure:🔽
FIL is moving within a box-like consolidation after a recent upward move.
Volume shows slight weakening, suggesting potential for a controlled breakout.
Key resistance is around 0.0245–0.0250, previously tested 3 times.
A trendline on the 4H chart has had 4 touches; the 3rd touch aligns with this resistance, reinforcing its significance.
🎯 Trade Considerations:
Long Opportunity: Breakout above 0.0250 could provide a solid long entry if confirmed with volume.
Short / Pullback: If price fails at the trendline or resistance, short-term pullbacks are possible. Keep stops tight due to LWC bearish pressure.
The current box could act as an accumulation zone; watching for a confirmed breakout is key.
📌 If you want a specific coin analyzed, drop a comment and I’ll do it for you.
⚠️ Without proper risk management, you're just a ticking time bomb.
— PXA

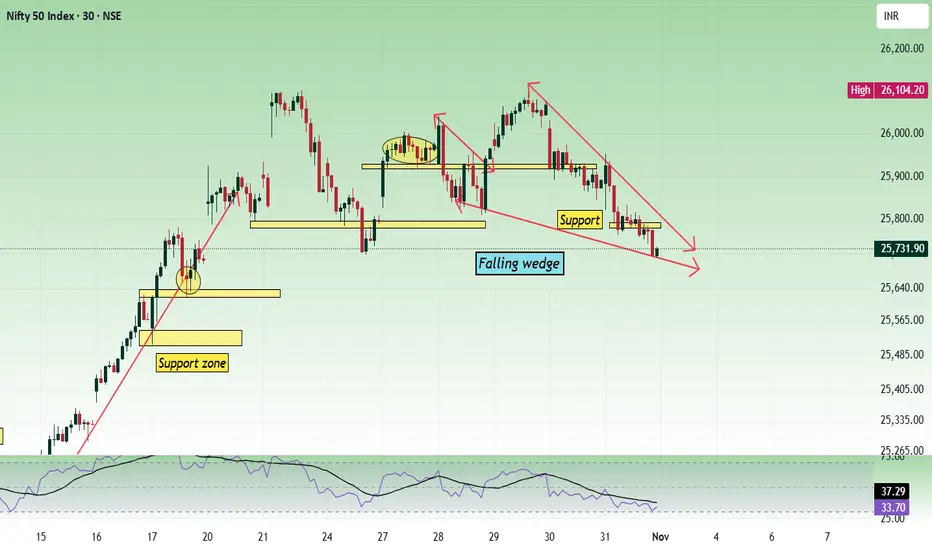
Nifty - Weekly Review Nov 3 to Nov 7Nifty in the lower time frame has formed a falling wedge, which is a bullish sign and also price is at the important crucial zone 25700. In the daily time frame, the price is showing bearish strength.
If the price breaks the 25680 - 25720 zone with bearish strength, 25500 can be tested.
Buy above 25740 with the stop loss of 25690 for the targets 25780, 25840, 25900, 25940, 25980, 26040 and 26080.
Sell below 25640 with the stop loss of 25690 for the targets 25600, 25560, 25520, 25460, 25400, 25360 and 25320.
Important levels to watch are 25500, 25700 and 25900 zones.
Always do your analysis before taking any trade.
Bharti Airtel is still in a bull run?Major trend of the stock is bullish and repitition of a previous pattern is a possibility.
In this trade I will be trading a pattern, in fact 2 candle and 5 candle patterns.
Rising Three Method is there in the monthly charts
Bullish engulfing pattern formation on the 3 month chart.
Entry:- 1970
Risk :- 1880 (4.523960-%)
Reward :- 2360 (19.8%)
R:R is good, pattern setup is good.
Wait for the price to approach around my buying area.

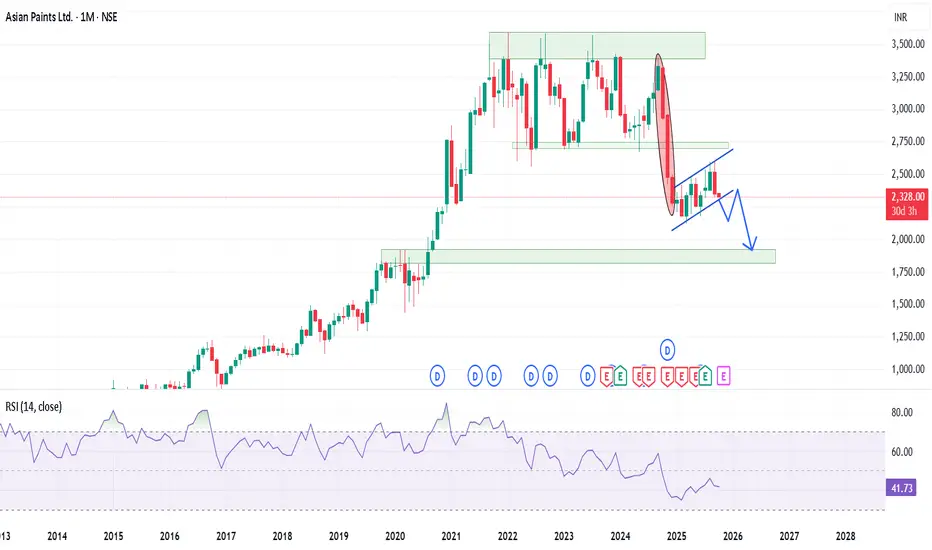
Good bearish setup on the higher time frame.Asian paints is one of the leading paint manufacturer in country and for the last few months the stock is trading in a parallel channel there are chance of it trying to retest the previous support zone of around 2700 levels before entering into another bearish leg.
Fundamentally stock shows some negativity as ~45% YoY decline in consolidated net profit in Q4 FY25.
Revenue slipped 4.3% YoY in this quater. Net profit fell 23.3% YoY in Q3 FY 2025.
Technically too the stock look to form bearish Flag and Pole pattern with a possible retracement to around 1700-1800 levels in upcoming months.
RSI is around in between on the monthly charts which is not in confluence.
BBand shows that the stock is trading below the median line of the band and chance of it travelling to the lower band it possible as stock it below the median line for around 11 months.
Exponential moving averages : 100 EMA on the monthly charts is providing good support to the stock while 20 & 50 EMA are acting as the resistance on the same time frame.
Target are different as per the trading setup.
Support and Resistance
Entry only once the channel is breached and retested.
Targe : 1815-1925 zone.
Bollinger Band
Entry has been triggered as per the BB strategy.
Target : 1935
EMA
As per the EMA strategy, there will be multiple entries in the stock.
Entry will be made once the stock closed below the 100 EMA.
Target : 200 EMA.
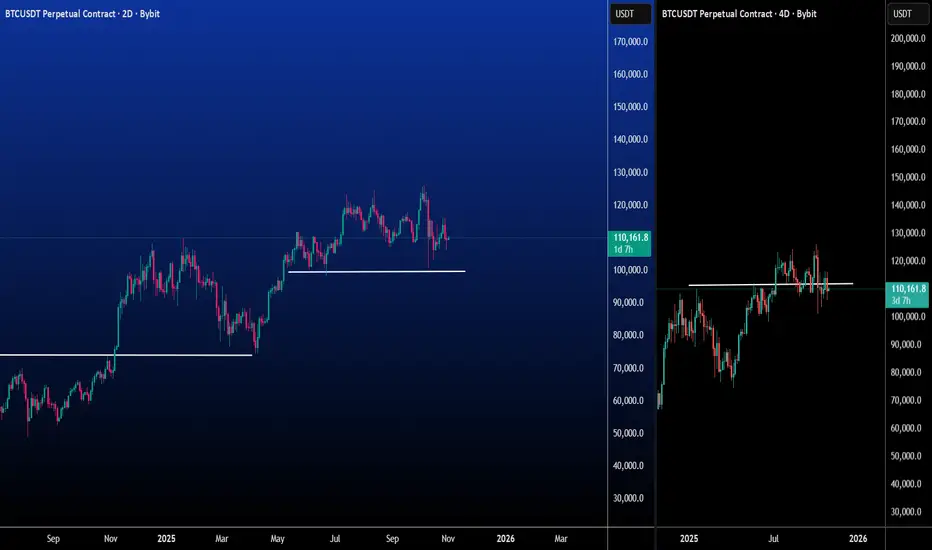
ByBit BTCUSDT Chart ( Mid Term Trade )Welcome Back To My Page.
Very Simple Chart.
-> First Trend Line
-> Second Trend Line
As we see the the pullback from the first Trend Line in Left Graph, Right Side Graph shows that Price got rejected from it's ATH and looking to take the support at Second Trend Line.
Like If your view align with my view.
Make sure any strong new now capable to Dump the price so take this advantage as December arrives soon.
Note : This is not a financial advice. Made just for Educational purpose
Tamilnad Mercantile Bank – 1D Chart | Strong Resistance Zone🟢 Tamilnad Mercantile Bank (TMB) – 1D Chart | Strong Resistance Zone Ahead
📊 Chart Setup:
TMB is testing its major 1-year resistance zone around ₹510, a key level that has capped price movements for months. A strong daily close above ₹510 could trigger momentum towards higher targets.
🔹 Resistance: ₹510 (Major 1-year resistance)
🔹 Targets on Breakout: ₹535 / ₹600
🔹 Supports: ₹466 / ₹440
🔹 View: Price consolidating near breakout zone. Sustained close above ₹510 can signal trend continuation.
🏦 Fundamental Update – Q2 FY26 Results Highlights:
Tamilnad Mercantile Bank delivered steady performance with profit growth and improved asset quality.
• Net Profit: ₹318 Cr ↑ (▲4.95% YoY)
• Total Business: ↑11.40%
• Deposits: ₹55,421 Cr ↑12.32%
• Advances: ↑10.5%
• Net Interest Income: ₹597 Cr ↑0.17%
• Gross NPA: ↓ to 1.01%
• Net NPA: ↓ to 0.26%
• Capital Adequacy Ratio (CAR): Strong at 30.96%
➡️ Stable performance, improving asset quality, and strong capital base add confidence to the technical setup.
📈 For educational purpose only. Not a buy/sell recommendation.

USOIL A good opportunity for long in USOIL inverse head and shoulders at 4h time frame looking forward for good targets next week. Let's see how it goes

Nifty Intraday Analysis for 31st October 2025NSE:NIFTY
Index has resistance near 26050 – 26100 range and if index crosses and sustains above this level then may reach near 26250 – 26300 range.
Nifty has immediate support near 25725 – 25675 range and if this support is broken then index may tank near 25500 – 25450 range.

Banknifty Intraday Analysis for 31st October 2025NSE:BANKNIFTY
Index has resistance near 58400 – 58500 range and if index crosses and sustains above this level then may reach near 58900 – 59000 range.
Banknifty has immediate support near 57600 - 57500 range and if this support is broken then index may tank near 57100 - 57000 range.

Finnifty Intraday Analysis for 31st October 2025 NSE:CNXFINANCE
Index has resistance near 27550 - 27600 range and if index crosses and sustains above this level then may reach near 27775 - 27825 range.
Finnifty has immediate support near 27175 – 27125 range and if this support is broken then index may tank near 26950 – 26900 range.

Midnifty Intraday Analysis for 31st October 2025NSE:NIFTY_MID_SELECT
Index has immediate resistance near 13575 – 135600 range and if index crosses and sustains above this level then may reach 13725 – 13750 range.
Midnifty has immediate support near 13350 – 13325 range and if this support is broken then index may tank near 13200 – 13175 range.
XAU/USD – Gold Maintains Short-Term Uptrend, Target $4,108🔍 Market Context
Gold continues to uphold a short-term uptrend structure after forming a clear Change of Character (ChoCH) around the 3,926 USD zone.
Buyers are in control as prices consistently create higher lows and react positively at the Order Block + Supporting Trendline zone.
As long as prices remain above the 3,940–3,926 USD area, the uptrend structure is preserved.
💎 Key Technical Zones
• Order Block Bullish: 3,926 USD → main support zone, confluence with rising trendline.
• Fair Value Gap (FVG): 3,942 – 3,972 USD → potential liquidity absorption zone.
• Resistance Zone: 4,032 USD → short-term resistance, needs to be broken to confirm continued uptrend.
• Liquidity Zone: 4,108 USD → expansion target if the above resistance is breached.
🎯 Trading Scenarios
1️⃣ BUY Setup – Prioritise catching the retracement from support zone
• Entry: 3,942 – 3,926 USD
• Stop Loss: 3,910 USD
• Take Profit:
– TP1: 3,972
– TP2: 4,032
– TP3: 4,064
– TP4: 4,108
✳️ “Buy the discount” – Prioritise orders in the confluence zone of OB + FVG to follow Smart Money flow.
2️⃣ SELL Scalp – Short-term at resistance zone
• Entry: 4,032 – 4,048 USD
• Stop Loss: 4,060 USD
• Take Profit:
– TP1: 4,010
– TP2: 3,972
– TP3: 3,942
✳️ “Sell the premium” – Activate only if clear price rejection signals appear at resistance.
💬 Summary
The current structure still leans towards bullish short-term with the 3,926 USD zone as the key invalidation zone .
As long as prices stay above the trendline, the immediate target is the 4,108 USD liquidity zone.
Optimal strategy: Buy on dip – Sell on reaction.
“Smart Money buys fear, sells greed — follow the footprints, not the noise.”
⏰ Timeframe: 1H
📅 Update: 31/10/2025
✍️ Analysis by: Captain Vincent

XAU/USD – Gold Eyes 4,100$ as Safe-Haven Demand Holds Firm🔍 Market Context
Gold continues to attract buyers for the second consecutive day, as renewed safe-haven demand supports a modest recovery from last week’s lows near 3,890$.
While the Fed’s hawkish stance keeps the Dollar firm, concerns over a prolonged US government shutdown and weaker macro sentiment have limited further USD gains — allowing gold to stabilize above the 3,970–3,990$ zone.
Still, with mixed fundamentals in play, traders remain cautious ahead of next week’s US data releases and policy speeches.
📊 Technical Outlook (H1–H4)
Gold has successfully broken its short-term downtrend, reclaiming momentum from the 3,933–3,973$ liquidity zone.
Price is now consolidating below the psychological 4,000$ handle, forming a clean breakout–retest structure.
Key Levels:
• Immediate Support: 3,973$ – 3,933$ (Breakout & Retest Zone)
• Resistance 1: 4,035$ – 4,050$
• Resistance 2 / Target: 4,114$ – 4,127$ (Fibo 1.618 extension)
• Extended Bull Target: 4,148$+ if momentum sustains
Invalidation: A breakdown below 3,930$ would invalidate the bullish scenario and re-open short-term downside liquidity toward 3,890$.
🎯 Trading Outlook
If gold holds the breakout above 3,970$, the bias remains bullish —
buyers may continue driving price toward 4,100$+, aligned with fib extensions and prior supply structure.
However, any hawkish narrative from Fed speakers could trigger intraday pullbacks before continuation.
⚜️ MMFLOW Insight:
“Smart money never rushes the breakout — it builds conviction where liquidity confirms direction.”

UNIONBANK | Cup & Handle breakout aheadUNIONBANK | Cup & Handle breakout ahead
CMP : 149
Something interesting is coming up from this counter

XAUUSDGold rejected from the support area broke the Trendline and formed a pattern head and shoulders shorting gold here.
Tp - 3959
