UNIONBANK | Cup & Handle breakout aheadUNIONBANK | Cup & Handle breakout ahead
CMP : 149
Something interesting is coming up from this counter
Support and Resistance

XAUUSDGold rejected from the support area broke the Trendline and formed a pattern head and shoulders shorting gold here.
Tp - 3959

XAUUSDGold has been showing bullish signs break of pattern and and Trendline keeping it simple and in higher time frame as well gold is showing bullish signs.
Buy @ 4000
Tp - 4054
Extended Tp 4086

XAUUSDA good Buy setup was waiting for the Trendline break , previous demand zone was there a correction was required that was my login that brought my bias for long please follow if you like my idea

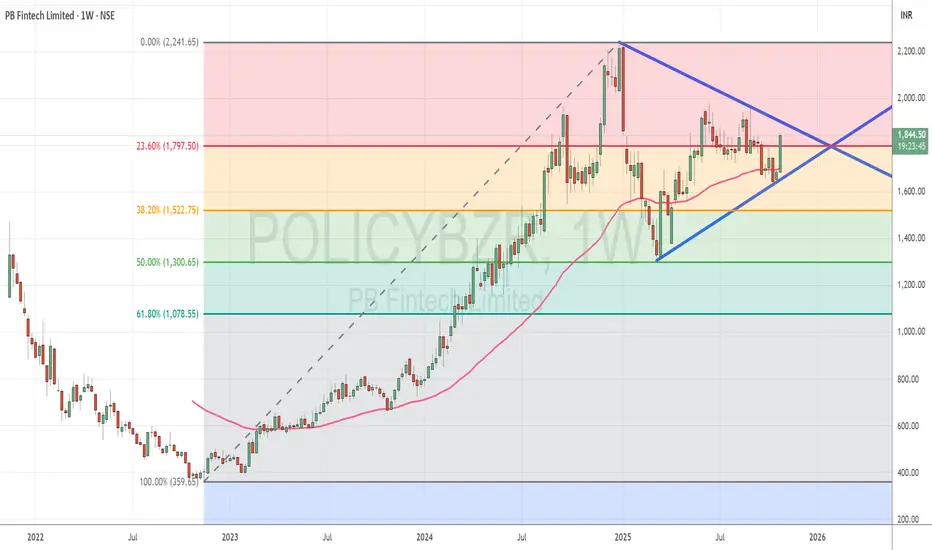
PB Fintech attempts recovery after first major correctionTopic Statement:
PB Fintech Ltd (PolicyBazaar) is recovering from its first significant correction following a steady bull run, with price action now approaching key resistance levels.
Key Points:
1. The stock retraced to the 50% Fibonacci level at 1300, where it found strong support and began to stabilize
2. A wedge candlestick pattern is forming, and a breakout in either direction could determine the next trend
3. The price faces stiff resistance at the 2000 mark, which may act as a ceiling unless bullish momentum drives a breakout
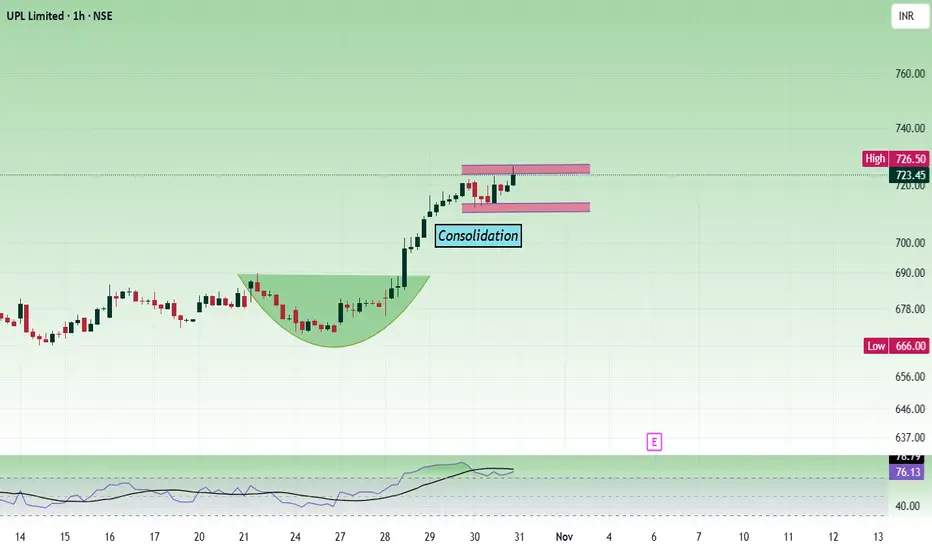
UPL - Multi time frame analysisThe price is consolidating between the range of 710 to 720. Buying levels are 710, 720, depending on your trading style. As per the daily chart, the price is giving a trend line breakout.
Buy above 715 to 718 with the stop loss of 705 for the targets 724, 736, 748 and 756.
If the price shows bearish strength and falls down, check how it is reacting at the 700 zone and take the trade.
Always do your analysis before taking any trade.
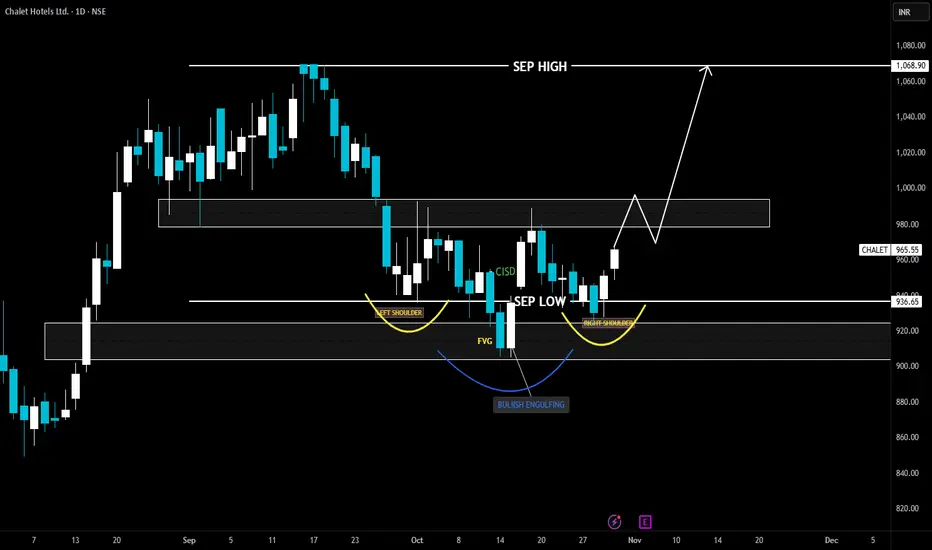
CHALET HOTELS TECHNICAL ANALYSISLooking at the chart, it’s pretty clear the stock has been in a short-term downtrend after forming a peak around the September high near ₹1,068, but it has now started to stabilize and show signs of reversal.
We can see a classic inverse head and shoulders pattern forming —
Left Shoulder around early October,
Head near mid-October (the lowest point), and
Right Shoulder forming recently.
At the head, there’s a bullish engulfing candle, which signals strong buying interest and potential reversal. The neckline (resistance turned support) sits roughly around ₹936–940, and the price has broken above it, confirming the bullish structure.
📊 Price Structure & Zones
Support (SEP LOW): ₹936
→ This level held multiple times, showing buyers are active here.
Immediate Resistance / Supply Zone: ₹980–₹995
→ Expect some profit booking or sideways action in this region.
Major Resistance (Target): ₹1,068 (September high)
→ If price sustains above ₹995, it can easily rally toward this zone.
⚙️ Trading Plan
✅ Entry Options
Aggressive Entry:
Around current price (₹960–965) since breakout is confirmed.
Conservative Entry:
Wait for a pullback to ₹940–950 zone and buy on a bullish candle confirmation.
🛡️ Stop-Loss (SL):
Keep SL below ₹925, under the right shoulder / recent swing low.
→ If price falls below this, the pattern fails.
🎯 Targets
Target 1: ₹985–995 (intermediate resistance zone)
Target 2: ₹1,068 (measured move from inverse head & shoulders pattern)
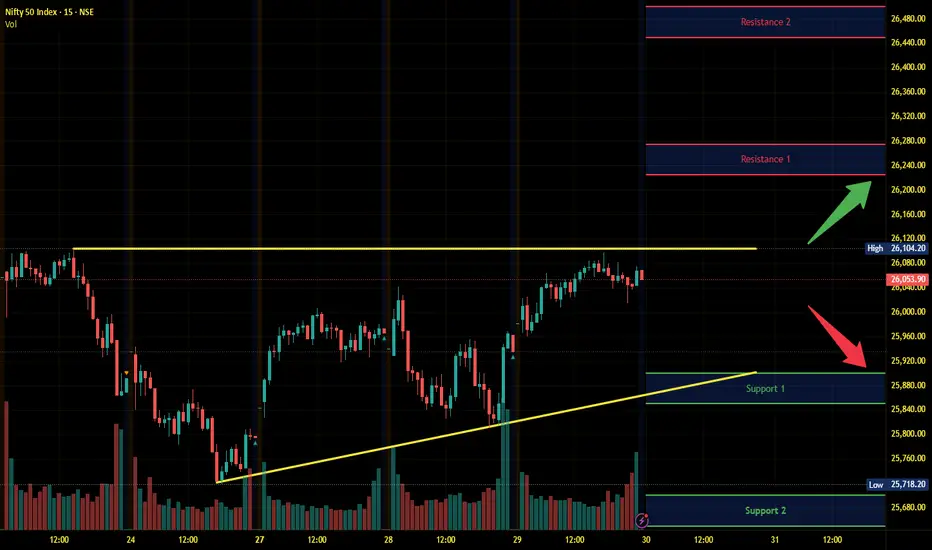
Nifty Intraday Analysis for 30th October 2025NSE:NIFTY
Market volatility is expected after the US FOMC meeting scheduled tonight, particularly in response to any rate cuts and the Federal Reserve's commentary.
Index has resistance near 26225 – 26275 range and if index crosses and sustains above this level then may reach near 26450 – 26500 range.
Nifty has immediate support near 25900 – 25850 range and if this support is broken then index may tank near 25700 – 25650 range.
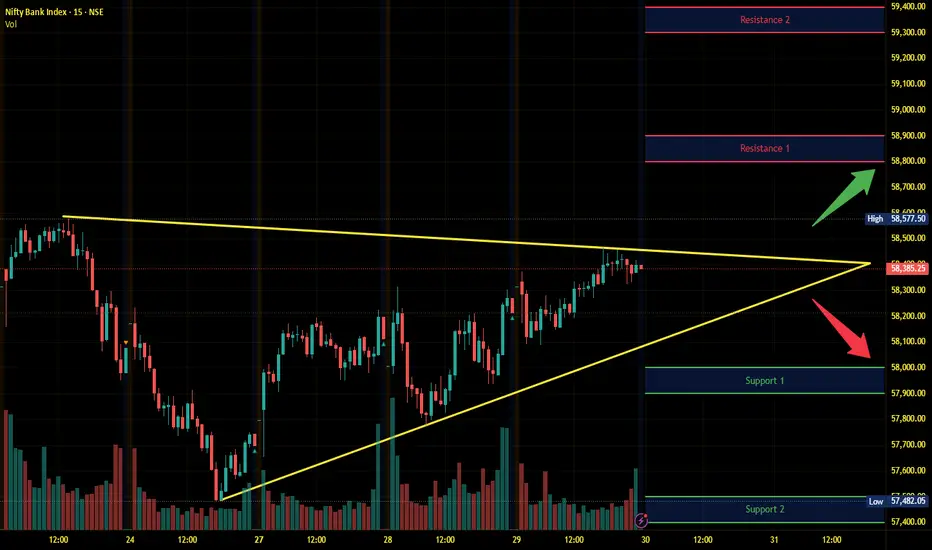
Banknifty Intraday Analysis for 30th October 2025NSE:BANKNIFTY
Market volatility is expected after the US FOMC meeting scheduled tonight, particularly in response to any rate cuts and the Federal Reserve's commentary.
Index has resistance near 58800 – 58900 range and if index crosses and sustains above this level then may reach near 59300 – 59400 range.
Banknifty has immediate support near 58000 - 57900 range and if this support is broken then index may tank near 57500 - 57400 range.
Finnifty Intraday Analysis for 30th October 2025NSE:CNXFINANCE
Market volatility is expected after the US FOMC meeting scheduled tonight, particularly in response to any rate cuts and the Federal Reserve's commentary.
Index has resistance near 27775 - 27825 range and if index crosses and sustains above this level then may reach near 28000 - 28050 range.
Finnifty has immediate support near 27375 – 27325 range and if this support is broken then index may tank near 27150 – 27100 range.

Midnifty Intraday Analysis for 30th October 2025NSE:NIFTY_MID_SELECT
Market volatility is expected after the US FOMC meeting scheduled tonight, particularly in response to any rate cuts and the Federal Reserve's commentary.
Index has immediate resistance near 13575 – 135600 range and if index crosses and sustains above this level then may reach 13725 – 13750 range.
Midnifty has immediate support near 13325 – 13300 range and if this support is broken then index may tank near 13175– 13150 range.

Sensex - Monthly Expiry Analysis Oct 30After a few minutes of market opening, the price did not move much but consolidated in a narrow range. Now the price is testing 85k. In an hourly time frame, the price is forming a W pattern, which is bullish.
If the price sustains above the resistance zone at 85200 - 85260, we can get good movement as per the W pattern.
Buy above 85020 with the stop loss of 84860 for the targets 85140, 85280, 85360, 85520, and 85660.
Sell below 84700 with the stop loss of 84840 for the targets 84580, 8460, 84360, 84200 and 84100.
Expected expiry day range is 84300 to 85400.
Sensex options are highly volatile, and you know whether you can handle it or not.
Always do your analysis before taking any trade.

IOC ASCENDING TRIANGLE BREAKOUTIOC breaking ascending triangle weekly basis
with huge volume this week
RSI bullish above 60
trading above 20 week ema
target1 180 target 2 can be 196
NO BUY/SELL RECOMENDATION

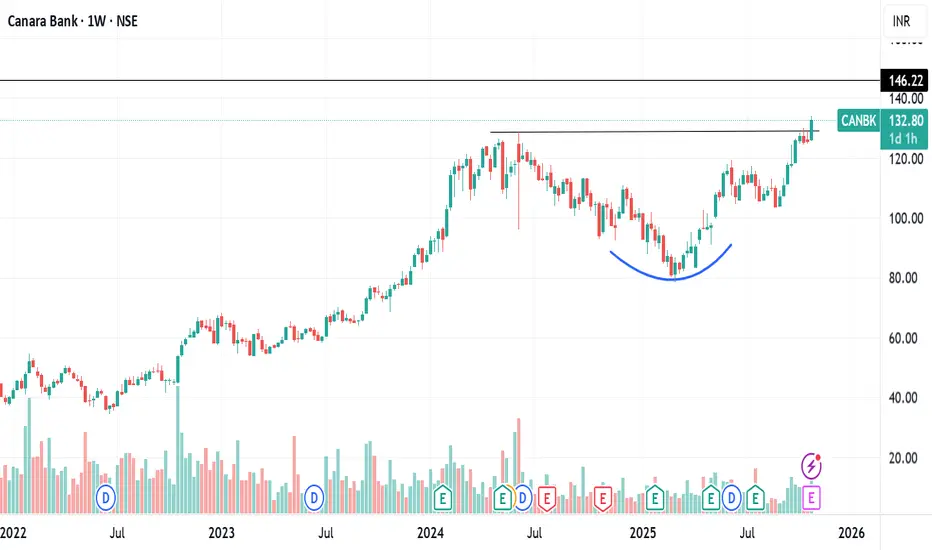
CANARA BANK ROUNDING BOTTOM BREAKOUTCanara bank breaking rounding bottom weekly
with huge volume this week
RSI above 60 bullish
heading towards 15 yr high
q2 net profit rises 19% +ve
target 146 then can lead to ATH 164 also
NO BUY/SELL RECOMENDATION
Gold Extends Decline Below $4,000 as Risk Appetite Returns🔍 Market Context
Gold continues to weaken as renewed optimism over US–China trade relations reduces safe-haven demand.
Despite the Fed’s dovish tone after the latest FOMC meeting, the Dollar remains relatively capped, offering limited support to bullion.
However, the technical landscape remains bearish — the decisive break below the $4,000 handle signals a continuation of the downside structure that’s been unfolding since early in the week.
📊 Technical Analysis
• Structure: Clear downtrend across H1–H4, with consistent lower highs and controlled liquidity sweeps.
• Key Resistance: 3,985 – 4,000 (former support now turned supply).
• Short-Term Targets:
– 3,925 – 3,930 → initial liquidity pocket.
– 3,880 – 3,860 → extended bearish target aligned with Fibo 1.618 extension.
• Invalidation: Only a confirmed break & hold above 4,020 – 4,030 would shift bias neutral-to-bullish.
🎯 Trading Outlook
If gold retests the 3,985–4,000 zone and fails to reclaim it, sellers are likely to extend control toward 3,920 or lower ahead of the FOMC-driven volatility.
Momentum remains bearish as long as the market trades below the 4,000 pivot — liquidity below 3,900 may attract smart money before any meaningful rebound.
⚜️ Summary
This decline isn’t random — it’s a structural reset.
The market is rebalancing after months of overextended bullish sentiment.
Watch how price reacts between 3,920–3,880 — this zone could define the next shift in gold’s short-term direction.
📊 MMFLOW TRADING Insight:
“Smart money doesn’t chase candles — it waits for liquidity to shift.”
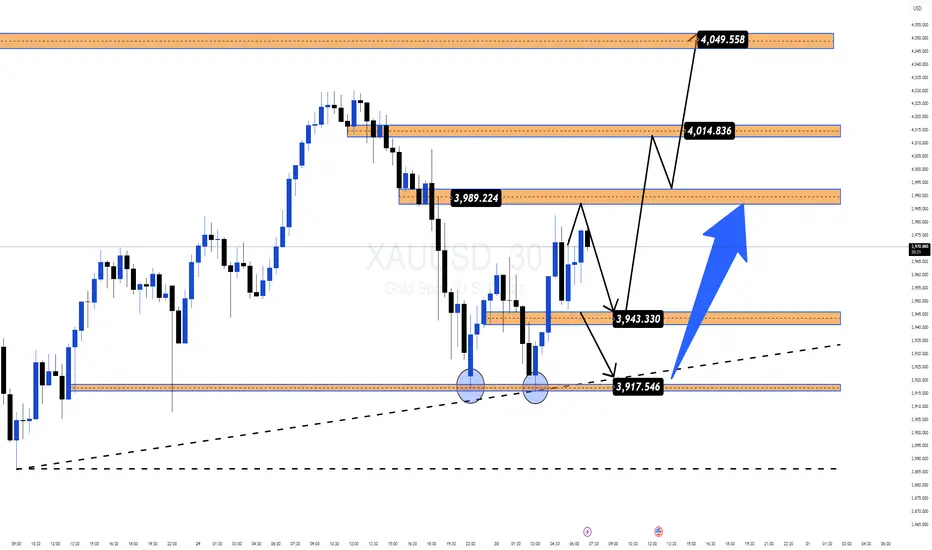
XAU/USD – Gold in Equilibrium Zone: Sell Opportunities Around...🔍 Market Context
Gold is currently consolidating within a triangle structure , showing short-term accumulation before a potential breakout.
Buyers are trying to maintain a minor bullish structure, but the series of lower highs indicates that sellers still hold the upper hand.
At the moment, price is reacting within the FVG 3,942–3,979 USD area, staying below the descending trendline.
If this zone fails to break, selling pressure may return.
💎 Key Technical Levels
• Bearish Order Block: 4,022 USD → main supply zone, aligning with the descending trendline.
• FVG Zone 1: 3,979 USD → short-term liquidity test area.
• FVG Zone 2: 3,942 USD → potential retracement zone before further downside.
• Bullish Order Block: 3,882 USD → key support aligning with long-term bullish trendline.
• Liquidity Zone: 3,789 USD → extended target if main support breaks.
🎯 Trading Scenarios
1️⃣ Sell Setup – Reaction from Resistance Zone
• Entry: 4,012 – 4,022 USD
• Stop Loss: 4,035 USD
• Take Profit:
– TP1: 3,979
– TP2: 3,942
– TP3: 3,900
– TP4: 3,882
– TP5: 3,789
✳️ “Sell the premium” – utilise supply and FVG reactions following Smart Money flow.
2️⃣ Buy Setup – Reaction from Demand Zone
• Entry: 3,882 USD
• Stop Loss: 3,865 USD
• Take Profit:
– TP1: 3,910
– TP2: 3,942
– TP3: 3,979
– TP4: 4,012
– TP5: 4,022
✳️ “Buy the discount” – valid when strong absorption or reversal signal forms near the lower OB.
💬 Summary
Current structure remains short-term bearish , yet the market is balanced.
The most efficient approach is to sell near premium zones (4,022) and buy back near discount (3,882) .
Expected range in the next 24–48 hours: 3,880–4,020 USD .
💡 Tagline:
“Trade where institutions act — not where retail reacts.”
⏰ Timeframe: 1H
📅 Updated: 30/10/2025
✍️ Analysis by: Captain Vincent

Resistance Breakout in BPCLBPCL has exhibited a notable resistance breakout on the daily chart, closing above ₹348 and marking a positive uptrend. This move is accompanied by a significant surge in the 350 November call option, up over 50%, confirming bullish sentiment. The breakout is supported by strong candle structure and aligns both spot and option price action, suggesting momentum continuation. Traders may consider BPCL for momentum-based strategies, monitoring for a move towards the next resistance. As always, disciplined risk management is advised when entering trades after key breakouts. This setup strengthens the bullish outlook for BPCL short-term.

Gold Rebounds Toward OB, but Deeper Correction May Follow🔍 Market Context
After forming a Change of Character (ChoCH) and a clear Break of Structure (BoS) to the downside, gold dropped sharply from 4,080–4,100 USD, confirming a shift from bullish to bearish structure.
Price is now making a technical rebound, forming Lower Highs toward the Order Block 4,012 USD — aligning with a small Fair Value Gap (FVG) , suggesting new selling pressure may emerge.
This rebound is seen as a “pullback retest supply” within a completed bearish setup.
If the 4,012 USD supply zone reacts strongly, price may extend its drop toward lower liquidity pools.
💎 Key Technical Structure
BoS (bearish): confirms a break below prior bullish structure.
Order Block (OB): 4,010–4,020 USD → main supply area confluencing with FVG.
FVG zone: 3,985–4,010 USD → technical retracement zone.
Supply Zone: 3,891–3,895 USD → temporary support, may be swept.
Liquidity Zone: 3,850–3,860 USD → key liquidity target.
📈 Trading Scenarios
1️⃣ SELL Setup – Retest OB 4,010–4,020 USD
Entry: 4,010 – 4,020
SL: 4,035
Take Profit: 3,985 - 3,965 - 3,945 - 3,915 - 3,890/Open
✅ Condition:
Wait for price to retest FVG–OB with clear bearish confirmation (strong rejection, bearish engulfing, or minor ChoCH on M15).
➡️ Trend-follow setup – sell after price retests supply zone.
2️⃣ BUY Setup – Reversal at Liquidity Zone 3,850 USD
Entry: 3,850 – 3,860
SL: 3,830
TP1: 3,870 - 3,885 - 3,900 - 3,920 - 3,940/Open
✅ Condition:
Wait for strong absorption or bullish reversal signal (long-tail rejection or bullish ChoCH on M15–H1).
➡️ Counter-trend scalp setup for reversal traders.
⚠️ Risk Management
Prioritise SELLs below 4,035 USD.
BUYs only valid with confirmation at Liquidity Zone.
Avoid mid-range trading (3,920–3,970) to reduce noise.
💬 Conclusion
Gold remains in a bearish trend after breaking prior bullish structure.
As long as price stays below 4,035 USD , downside momentum prevails.
Next major target: 3,891 – 3,851 USD .
👉 Strategic Plan:
Sell 4,010–4,020 | SL 4,035 | TP 3,985 → 3,890 🎯
Buy 3,850–3,860 | SL 3,830 | TP 3,870 → 3,940 🎯
💎 Price never lies — liquidity always reveals the truth.
⏰ Timeframe: 1H
📅 Updated: 29/10/2025
✍️ Analysis by: Captain Vincent

XAUUSDI posted a buy side trade today i was looking for correction and found this perfect short setup Trendline break and supply zone keeping setup simple.

ADA 1H Technical Snapshot — Short Bias via Cycles, Long Opportun📊 Cycle Structure:
HWC (Higher Wave Cycle): Bearish 🔽
MWC (Middle Wave Cycle): Range 🔁
LWC (Lower Wave Cycle): Bullish 🔼
📌 Overall View: The cycles suggest a short bias, but we take direction from BTC and BTC.D, which opens a potential short-term long opportunity.
📐 Market Context:
BTC is in a strong support zone and BTC.D is currently bearish.
ADA is at the third touch of its trendline and resistance at 0.6844 (which has seen 3 previous touches).
This resistance may react, providing a good entry for a short-term long.
🎯 Trade Plan (Short-term Long):
Long position is taken and will be held until price reacts to the resistance.
Given BTC.D’s status, this is more favorable for altcoins.
Stop-loss and risk management must be applied to control the position in case of a weak reaction or breakout.
📌 If you want a specific coin analyzed, drop a comment and I’ll do it for you.
⚠️ Without proper risk management, you're just a ticking time bomb.
— PXA | Cycle & Structure-Based Trading

BTC SUPPORT, RESISTANCE & TRENDLINE ANALYSIS Just follow the levels and the trendline.
I am travelling so just follow the levels for good and positive returns.
The bias remains Bullish.
Only if it breaks 111730 then we can plan for 110380 and 1095750.

US OIL SUPPORT, RESISTANCE & TRENDLINE ANALYSISI hope whosoever followed my levels should have captured some good moves.
My levels shall remain the same as posted on my previous post.
