Banknifty Intraday Analysis for 16th October 2025NSE:BANKNIFTY
Momentum is shifting upward.
Index has resistance near 57200 – 57300 range and if index crosses and sustains above this level then may reach near 57700– 57800 range.
Banknifty has immediate support near 56400 - 56300 range and if this support is broken then index may tank near 55900 - 55800 range.
Support and Resistance

Finnifty Intraday Analysis for 16th October 2025NSE:CNXFINANCE
Momentum is shifting upward.
Index has resistance near 27250 - 27300 range and if index crosses and sustains above this level then may reach near 27450 - 27500 range.
Finnifty has immediate support near 26925– 26875 range and if this support is broken then index may tank near 26725 – 26675 range.

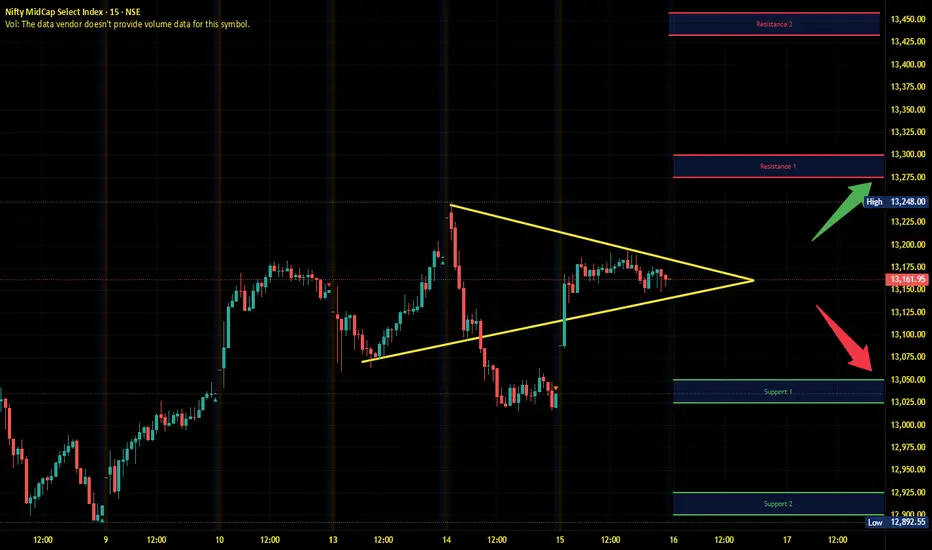
Midnifty Intraday Analysis for 16th October 2025NSE:NIFTY_MID_SELECT
Momentum is shifting upward.
Index has immediate resistance near 13275 – 13300 range and if index crosses and sustains above this level then may reach 13425 – 13450 range.
Midnifty has immediate support near 13050 – 13025 range and if this support is broken then index may tank near 12925 – 12900 range.
BITCOIN 1HRSWING TRADE
- EARN WITH ME DAILY 10K-20K –
BITCOIN Looking good for Downside..
When it break level 110338 and sustain.. it will go Downside...
SELL @ 110338
Target
1st 105685
2nd 100862
Enjoy trading traders.. Keep add this STOCK in your watch list..
Big Investor are welcome..
Like this Post??? Hit like button..!!!
Follow me for FREE Educational Post and Alert..

Gold Plan | Where will gold drop today?🔍 Market Context
Gold continues to maintain a short-term upward trend following a series of Break of Structure (BoS) , confirming active buying from lower zones.
Currently, the price is approaching the ATH GOLD zone and heading towards the Liquidity Sell Zone 4,281 USD – a densely liquid area where short-term sell reactions from major players may occur.
After a hot rise, technical correction risks are starting to increase. Lower zones like 4,186 – 4,152 – 4,130 USD will be potential “accumulation zones” for institutional buyers in the upcoming pullback.
💎 Technical Analysis
ATH GOLD: 4,275 – 4,280 USD
Liquidity Sell Zone: 4,281 – 4,285 USD → high liquidity resistance area, may trigger short-term reversal reactions.
Liquidity Zone $$$: 4,186 – 4,152 USD → crucial support area in the uptrend, where technical reactions are expected.
FVG – BoS Zone: 4,152 – 4,148 USD → “price balance” zone yet to be filled, likely to be retested.
OB Deep Zone: 4,130 – 4,120 USD → deep demand zone converging with Fibo 0.786 – ideal area for large capital to re-accumulate.
Overall structure remains bullish , but in the premium zone – an area where institutions typically distribute orders to gain liquidity before adjusting.
📈 Trading Scenarios
1️⃣ Main Scenario – Sell reaction at Liquidity Zone 4,281 USD
When the price hits the 4,275 – 4,281 USD zone and clear reversal signals appear (rejection candles, bearish engulfing, or minor structure break),
→ open short-term sell orders (scalp/intraday).
Target: 4,186 → 4,152 USD.
Stop Loss: above 4,285 USD.
➡️ This is a typical “liquidity sweep – technical reaction” scenario, capitalising on short-term sell-offs at high liquidity peaks.
2️⃣ Secondary Scenario – Buy back following the main trend after correction
When the price corrects to the 4,186 – 4,152 USD zone or deeper to OB Deep 4,130 USD ,
and clear upward confirmation signals appear (strong rejection or minor BoS increasing again),
→ open buy orders in line with the main trend.
Target: 4,230 → 4,275 USD.
Stop Loss: below 4,120 USD.
➡️ Trend-following scenario – waiting for price correction to discount zones to accumulate in line with the larger trend.
⚠️ Risk Management
Do not FOMO buy when the price is hitting the 4,275 – 4,281 USD zone.
Prioritise short-term sells with clear confirmations or buys at lower OB zones.
Keep light volume when trading against the main trend.
Observe reactions at the 4,186 zone – this is the key level of the day.
💬 Conclusion
Gold is at the peak of the current rise , short-term profit-taking pressure may appear around the 4,281 USD zone.
If strong reactions occur, a correction to the 4,186 – 4,152 USD zone is reasonable for market rebalancing.
The larger trend remains upward , so lower OB zones will be reasonable buy opportunities for the next wave.
👉 Reasonable Strategy:
Sell reaction at 4,281 USD when reversal signals appear.
Buy back at 4,186 – 4,152 – 4,130 USD when confirmation signals appear.

MGC _16/10/25_TP Hit Anticipation trade
Entry not taken hence as this trade occurred during non volume times
FYI .....
High Volume times ( all in IST hours )
Asian session - 530am to 7:30am
London session - 1130am to 2pm
NY session - 4pm to 8pm
London close - 930pm to 11pm

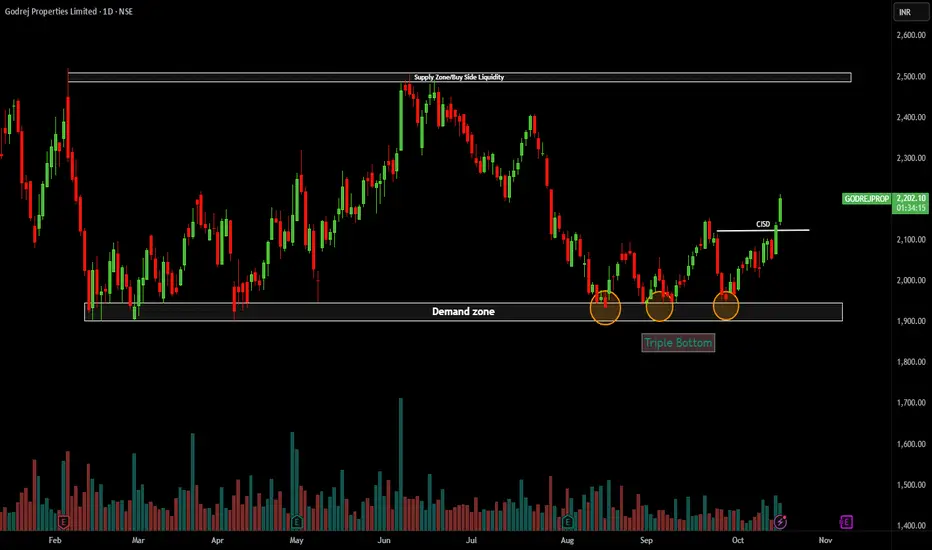
Goderaj Properties Technical analysisGodrej Properties has formed a triple bottom pattern at the demand zone (₹1,850–1,900), signaling strong accumulation and reversal from support. Price has broken above the CISD neckline (~₹2,100) with strong bullish candles and volume confirmation — indicating breakout strength.
Outlook:
Momentum remains bullish; next resistance lies near the supply zone ₹2,450–₹2,500.
Support: ₹2,080
Target: ₹2,400–₹2,500
Bias: Bullish above ₹2,100
XAUUSD : 16/10/25_TP Hit Overall trend is bullish
1. Entered a buy position during
2. Buy Candle formed near support and also fakeout formation
3. Entered near Sweeps

Gold Pulls Back From All-Time High – Correction Looks Limited📊 Market Overview
Gold slightly corrected from its all-time high near $4,239, showing early signs of a short-term pullback, but the overall trend remains bullish.
Despite the correction, fundamental sentiment still supports Gold:
💬 US–China trade tensions and geopolitical risks continue to fuel demand for safe-haven assets.
💵 The US Dollar remains under pressure amid expectations of a Federal Reserve rate cut later this year.
⚖️ Ongoing concerns about a possible US government shutdown further enhance Gold’s attractiveness.
These factors suggest that the current dip is likely a healthy correction within a strong uptrend, not a reversal.
🧠 Technical Structure (MMFLOW Wave View)
Gold has likely completed a minor Wave (V) on the M30 chart, forming a new ATH Zone near 4,239.
Currently, price is unfolding a corrective A–B–C pattern, expected to find support at key liquidity zones before resuming the uptrend.
Our model highlights two potential BUY setups and a short-term SELL scalp opportunity for today’s trading session.
🔑 Key Levels to Watch
🔵 BUY Setup 1
Zone: 4,184 – 4,182
SL: 4,178
TP: 4,188 – 4,192 – 4,196 – 4,200 – 4,210 – 4,220 – ???
🟢 BUY Setup 2 (Deeper Retrace)
Zone: 4,148 – 4,146
SL: 4,140
TP: 4,152 – 4,156 – 4,160 – 4,170 – 4,180 – 4,190 – 4,200
🔴 SELL SCALP Opportunity
Zone: 4,230 – 4,234
SL: 4,238
TP: 4,220 – 4,215 – 4,210 – 4,200 – 4,190 – ???
⚙️ MMFLOW Trading View
📈 Price is currently respecting Wave (A) of the correction.
We expect a possible (B) retracement toward 4,220 – 4,230, followed by (C) decline completing near 4,147 – 4,150 (Fibo 0.618 / CP Buy Zone).
From there, Smart Money may re-enter long positions targeting a fresh liquidity sweep toward the 4,285 SELL ZONE.
In short:
The uptrend remains intact, only a short-term correction is unfolding.
Patience is key — best opportunities will likely appear around 4,150 – 4,180 range.
The structure aligns perfectly with both technical confluence (Elliott + Liquidity Zones) and macro sentiment.
If the market holds above 4,140, Gold could aim for new highs toward 4,285 – 4,300 in the next few sessions.
However, traders should:
✅ Always use Stop Loss — volatility is high near record highs.
✅ Avoid overtrading in narrow pullback zones.
✅ Focus on reaction at key liquidity levels before entering.
⚡️ Summary
Gold remains technically bullish with limited downside correction.
Watch for price reaction around 4,184 and 4,147 — both zones represent strong liquidity areas where Smart Money may look to buy again.
After completing this correction, a new impulsive leg up toward 4,285+ could unfold, potentially marking the next all-time high.

XAUUSD – Safe-Haven Flows Continue to Support GoldMarket Context:
Gold has attracted strong buying for the fourth consecutive session, supported by a mix of global risk factors: renewed US–China trade tensions, rising geopolitical uncertainty, and growing fears of a prolonged US government shutdown.
Meanwhile, dovish expectations from the Federal Reserve are keeping the USD under pressure — further enhancing the appeal of gold as a non-yielding safe-haven asset.
During the Asian session, XAU/USD printed a fresh all-time high, with bulls now eyeing a potential extension toward the 4,200 USD/oz region amid escalating global concerns.
Technical Outlook (M30):
Gold continues to respect its ascending channel structure, maintaining dynamic support between 4,167 – 4,154.
As long as price holds above 4,139, the broader trend remains bullish, with the next liquidity target sitting at 4,240 – 4,241.
Key Zones to Watch:
Liquidity Sell Zone: 4,240 – 4,242
ATH Zone / Short-Term Resistance: 4,190 – 4,200
OBS Buy Zone – CP Trendline Support: 4,141 – 4,139
Secondary Buy Zone: 4,114 – 4,112
Trading Plan:
🔹 BUY Zone
Entry: 4.141 – 4.139
SL: 4.134
TP: 4.145 → 4.150 → 4.155 → 4.160 → 4.170 → 4.180
🔹 BUY Zone
Entry: 4.114 – 4.112
SL: 4.106
TP: 4.120 → 4.125 → 4.130 → 4.140 → 4.150
🔹 SELL Zone (Scalp Reaction)
Entry: 4.240 – 4.242
SL: 4.248
TP: 4.235 → 4.230 → 4.225 → 4.220 → 4.210 → 4.200
Summary:
The bullish market structure remains intact as long as price holds above the 4,139 zone.
Watch for potential long opportunities from 4,141 – 4,139, where the confluence of trendline and order block support could trigger fresh demand.
Bulls remain in control, targeting the 4,240 – 4,241 liquidity area in the coming sessions.
📊 What’s your take — will gold break above 4,200 or pause for a correction first?
👉 Follow MMFLOW TRADING for daily market structure insights and institutional-style setups.
🟣 Chart: XAUUSD M30 – Smart Money Flow structure highlighting liquidity pools, CP confluence and key buy/sell zones.

XAU/USD – Buyers Reclaim Structure, Targeting Liquidity Zone🔍 Market Context
After a strong Liquidity Sweep yesterday, gold has rebounded and formed consecutive Break of Structure (BoS) , confirming buyers have regained control.
The price has now filled the Fair Value Gap (FVG 4,191 – 4,202) and is heading towards the Sell Liquidity Zone 4,237 – 4,240 USD — a concentration of pending sell orders and stop-losses from previous short positions.
The current structure shows strong bullish momentum , however, the possibility of a correction from this high liquidity area is noteworthy.
💎 Technical Analysis
Liquidity Sweep: Completed, clearing liquidity below 4,070.
FVG (Fair Value Gap): 4,191 – 4,202 → filled, confirming price balance.
Sell Liquidity Zone: 4,237 – 4,240 → potential resistance zone, likely strong reaction.
OB Zone | Buy: 4,143 – 4,145 → nearby support, expected first reaction when price corrects.
OB Deep | Buy: 4,110 – 4,115 → deep demand zone, confluence with Premium Zone 4,156 – 4,118.
Overall Structure: The main trend remains bullish , with strong upward momentum but requires a technical correction for re-accumulation.
📈 Trading Scenarios
1️⃣ Main Scenario – Sell reaction at liquidity zone
When the price approaches the Sell Liquidity Zone 4,237 – 4,240 USD , observe candlestick reaction (rejection, bearish engulfing).
If confirmation signals appear, open a short-term sell order .
Target: OB Buy Zone 4,145 → 4,110 USD.
Stop Loss: above 4,245 USD.
➡️ This is a liquidity reaction setup, high probability when the market encounters resistance confluence with Fibonacci zone 0.786–1.0.
2️⃣ Alternative Scenario – Buy with trend from OB
If the price corrects to the OB Zone 4,143 – 4,145 USD and shows a clear reaction (strong rejection or minor structure break),
→ a buy with the main trend can be opened.
Target: return to 4,200 → 4,235 USD.
Stop Loss: below 4,130 USD.
If the price drops further, the OB Deep Buy 4,110 – 4,115 USD will be the final “liquidity attraction” zone for a new upward bounce.
⚠️ Risk Management
Avoid FOMO buying at 4,200+ as it is near the liquidity resistance zone.
Prioritise short-term sell at 4,237 if clear signals are present.
When price corrects to OB, wait for reaction before buying, do not bottom fish early.
💬 Conclusion
After completing the liquidity sweep, gold has confirmed a return to bullish structure with multiple consecutive BoS.
Currently, the price is approaching the liquidity zone 4,237 USD – a short-term correction is highly likely.
The 4,145 – 4,110 USD zone will be where buyers await reaction to accumulate orders and continue the medium-term uptrend.
👉 Reasonable Strategy:
Short sell at 4,237 USD if reversal signals are present.
Wait to buy at OB zone 4,145 – 4,110 USD when clear reaction occurs.

GOKULAGRO – A Strong Demand Zone Meets Classic Breakout Retest 📈 Market Insights 📈
In the world of price action, every rally and pullback leaves behind clues — and supply and demand zones are among the most telling. These zones are the footprints of institutions — areas where large players once entered or exited positions, creating visible imbalances on the chart. When price revisits these zones, it often reacts sharply, as unfilled orders get triggered once again.
🧩 Supply & Demand View 🧩
In the case of GOKULAGRO , we’re witnessing this principle in action. After a powerful rally that pushed the stock to fresh all-time highs, the inevitable profit-booking wave stepped in — giving birth to a clean supply zone near the top. This is where sellers briefly took control, pausing the bullish momentum and cooling off the rally.
Now, what’s particularly interesting is where the price has landed. It’s currently hovering around a strong demand zone — not just any support level, but the very origin of the rally that broke previous resistance barriers and fueled the stock’s breakout run. These areas are historically loaded with pending buy orders, and a return to them often sparks a renewed upward reaction.
Demand Zone Strength: Located at the base of a prior impulse move, signaling prior institutional buying.
Price Reaction Potential: Sharp reversals often emerge from such zones as demand reactivates.
Buyer Interest Area: This zone marks where large players previously entered the market aggressively.
🚀 Classical Chart View 🚀
From a traditional technical standpoint, the broader structure also paints a bullish narrative. The stock recently broke through a significant resistance level — a level that had previously capped price for weeks. The breakout was accompanied by a notable volume surge , suggesting strong conviction behind the move.
What’s unfolding now is a textbook example of “resistance turning into support.” As price revisits this breakout zone, selling pressure has notably declined — reflected in a visible drop in volume during the pullback. This reduced activity indicates that sellers are losing steam, and the correction might simply be a healthy retest rather than a reversal.
Old Resistance → New Support: A classic structural shift confirming bullish continuation.
Volume Behavior: Declining sell volume during the pullback suggests waning bearish momentum.
Zone Confluence: The overlap of the demand zone with this retested level strengthens the bullish setup.
✨ Final Takeaway ✨
Both analytical lenses — supply and demand as well as classical technical — align seamlessly here. GOKULAGRO has already found footing at a high-quality demand zone , one that previously launched a major impulse move. If buyers step in again from this region, the stock could well be gearing up for its next leg higher .
For those observing this setup, keeping a protective stop-loss below ₹162.5 could provide a sensible cushion beneath structural support.
💡 Risk Management Reminder 💡
Even the cleanest patterns can fail — that’s the reality of trading. What separates consistent traders from the rest is discipline . Always size your positions wisely and respect your stop-loss.
“The art of trading is not about being right all the time, but about losing less when you are wrong.”
🔄 Patience, consistency, and emotional control often beat bold predictions in the long run.🔄
Lastly, thank you for your support, your likes & comments. Feel free to ask if you have questions.
⚡ Keep learning, keep analyzing — because every chart tells a story! ⚡
This analysis is purely for educational purposes and should not be considered as trading or investment advice. I am not a SEBI-registered analyst.

Sensex Expiry Day Intraday Setup (16/10/2025) | 15-min TFHey traders! 👋 With today being the monthly expiry, we're set for some volatile moves. Here’s a clean price-action plan for the session based on the 15-minute chart.
The Big Picture:
All eyes are on the 82,400 level! This isn't just any level; it's the absolute battle zone for today. The price reaction here will give us our directional bias. 🎯
The Two Trading Scenarios:
🟢 BULLISH SCENARIO: The Defensive Bounce
What to Watch For: Price dips to 82,400 and forms a clear Bullish Hammer 🛎 candle, showing rejection and buyer strength.
The Trigger: Wait for a GREEN candle to close above the high of that hammer.
The Trade:
Action: Go LONG.
Initial Target: 82,700
Upside Bonus: If we also get a breakout and close above the white descending trendline, the next target is 83,078! 🚀
🔴 BEARISH SCENARIO: The Breakdown
What to Watch For: Price slices through 82,400 with a strong Thick Red Marubozu 📉 candle (big red body, tiny wicks). This shows powerful selling pressure.
The Trigger: Wait for the next candle to confirm the break by trading below the Marubozu's low.
The Trade:
Action: Go SHORT.
Target: 81,780
Final Word & Risk Management 🛡️
Patience is Key: Do not jump the gun! Wait for the clear confirmation candle after the initial signal.
Protect Your Capital: Always use a stop loss. For longs, place it below the swing low; for shorts, above the swing high.
This is Intraday: Manage your trade actively and don't carry this setup overnight.
Trade the plan, and let the price do the talking! 👍
Disclaimer: This is purely educational and based on price action. You are responsible for your own trades.

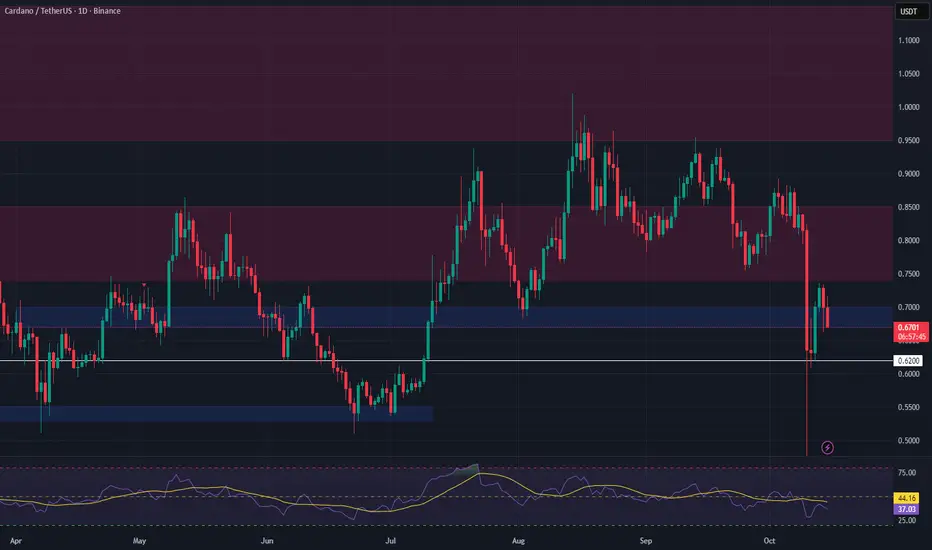
ADA Approaching Major Support – Spot Long Setup in ProgressCardano (ADA) is trending down toward a critical support zone at $0.67–$0.70, which could offer a low-risk entry for a laddered spot long position. The broader crypto market remains cautious, and near-term direction is still unclear—so position sizing and disciplined execution are essential.
🎯 Plan of Action:
Entry Zone: $0.67–$0.70 support, with staggered buys to improve cost basis.
Confirmation Required: Wait for signs of stabilization (e.g., bounce, volume support) before adding further.
Avoid chasing rallies if they lack volume follow-through.
📊 Targets & Risk Management:
Take Profits in Tiers:
First zone: $0.74–$0.85
Second zone: $0.95–$1.15
Stop Loss: Just below $0.62, invalidation of the support structure.
Keep allocation modest—ADA is still in a volatile downtrend.
💡 Reminder: This is a technical setup, not a prediction. Let the chart lead the decision, and stay adaptive to market conditions.
BUY TODAY SELL TOMORROW for 5%DON’T HAVE TIME TO MANAGE YOUR TRADES?
- Take BTST trades at 3:25 pm every day
- Try to exit by taking 4-7% profit of each trade
- SL can also be maintained as closing below the low of the breakout candle
Now, why do I prefer BTST over swing trades? The primary reason is that I have observed that 90% of the stocks give most of the movement in just 1-2 days and the rest of the time they either consolidate or fall
Resistance Breakout in ICICIGI
BUY TODAY SELL TOMORROW for 5%

XAUUSD: 15/10/25_ TP HitOver all Trend is bullish
1. Entered on a fakeout setup
2. Entered when candle retraced 50% of the fakeout candle
3. next candle took deep liquidity ( Fuelcandle has formed )
4. Waited for TP to hit

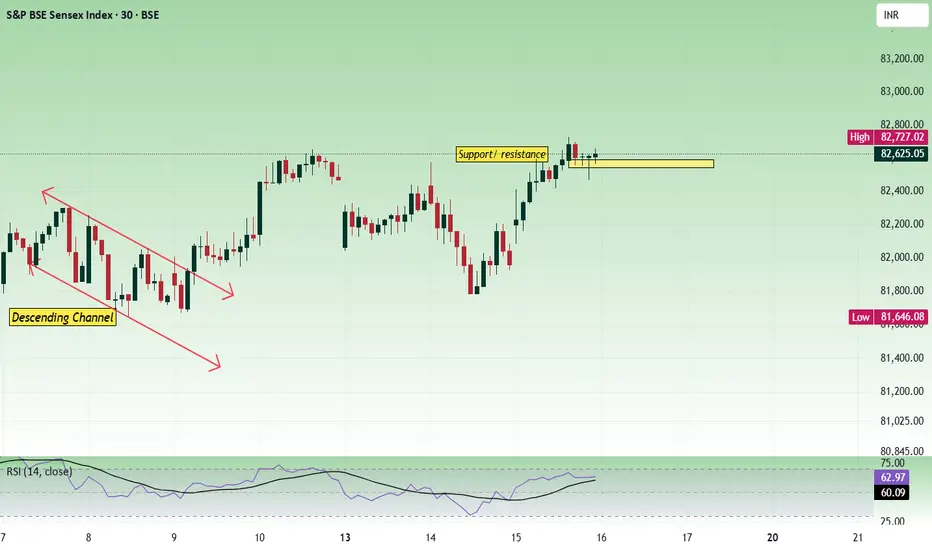
Sensex - Expiry day analysis Oct 16Price has taken support from 82500 and managed to close above it. Price has a higher probability of moving up as long as it sustains above 82500. At the same time, the price is facing trendline resistance in the daily chart.
Price can fall from trendline resistance if it gains bearish strength. Before taking a trade we should know where the nearby support/resistance is waiting for us to give diversion.
Buy above 82560 with the stop loss of 82420 for the targets 82660, 82800, 82920, 83040,83200 and 83320.
Sell below 82300 with the stop loss of 82420 for the targets 82200, 82080, 81940, 81800, 81680 and 81560.
Always do your analysis before taking any trade.
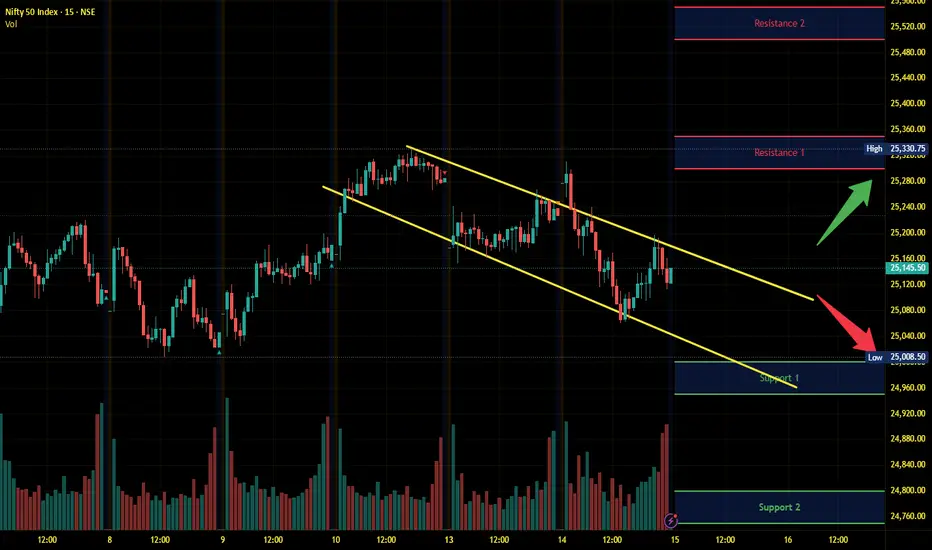
Nifty Intraday Analysis for 15th October 2025NSE:NIFTY
Index has resistance near 25300 – 25350 range and if index crosses and sustains above this level then may reach near 25500 – 25550 range.
Nifty has immediate support near 25000 – 24950 range and if this support is broken then index may tank near 24800 – 24750 range.
Banknifty Intraday Analysis for 15th October 2025NSE:BANKNIFTY
Index has resistance near 56900 – 57000 range and if index crosses and sustains above this level then may reach near 57400– 57500 range.
Banknifty has immediate support near 56000 - 55900 range and if this support is broken then index may tank near 55500 - 55400 range.

Finnifty Intraday Analysis for 15th October 2025NSE:CNXFINANCE
Index has resistance near 27025 - 27075 range and if index crosses and sustains above this level then may reach near 27250 - 27300 range.
Finnifty has immediate support near 26675 – 26625 range and if this support is broken then index may tank near 26450 – 26400 range.

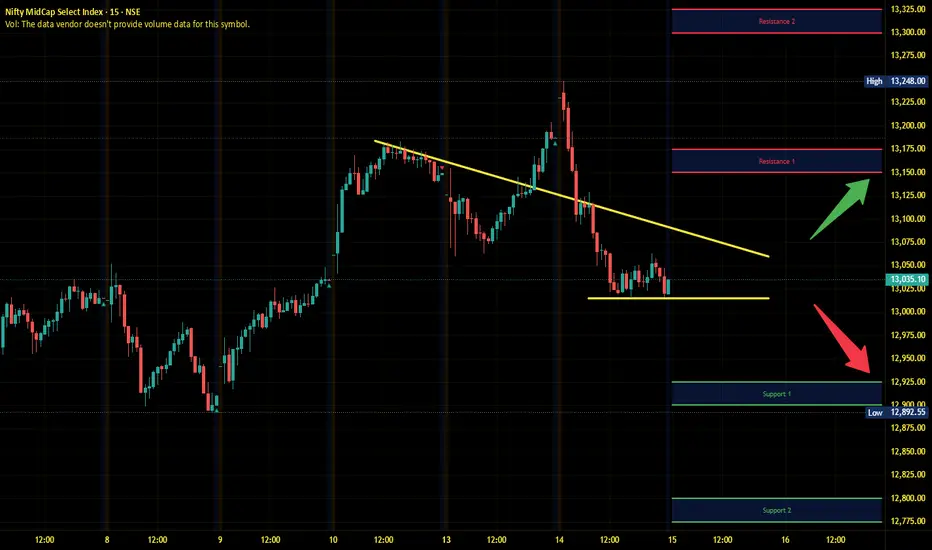
Midnifty Intraday Analysis for 15th October 2025NSE:NIFTY_MID_SELECT
Index has immediate resistance near 13150 – 13175 range and if index crosses and sustains above this level then may reach 13300 – 13325 range.
Midnifty has immediate support near 12925 – 12900 range and if this support is broken then index may tank near 12800 – 12775 range.
XAUUSD - TP hit _ 15/10/25Overall trend bullish
1. Candle broke out of the resistance
2. retested back to resistance and confirmed support
3. Entered during bottom wick
4. Closed full at TP level ( round level 4200 )

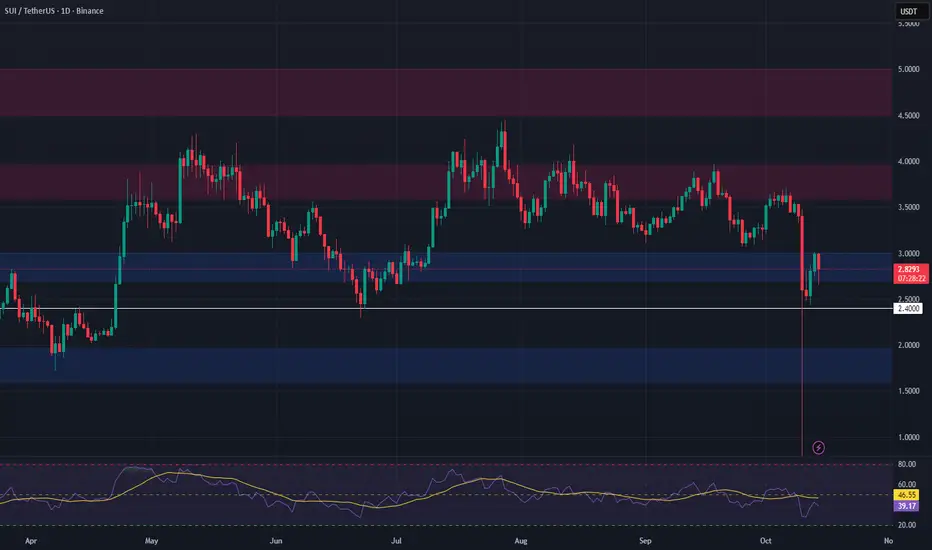
SUI – Swing Trade Setup from Key Support ZoneSUI is currently trading in a major support zone between $2.70 and $3.00, a level that has previously acted as a strong demand area. The price is consolidating here, and this could offer a high-probability long opportunity for swing traders watching for a potential bounce.
📈 Entry Zone: $2.70 – $3.00
🎯 Take Profit Targets:
• TP1: $3.60 – $3.95
• TP2: $4.50 – $5.45
🛑 Stop Loss: $2.40