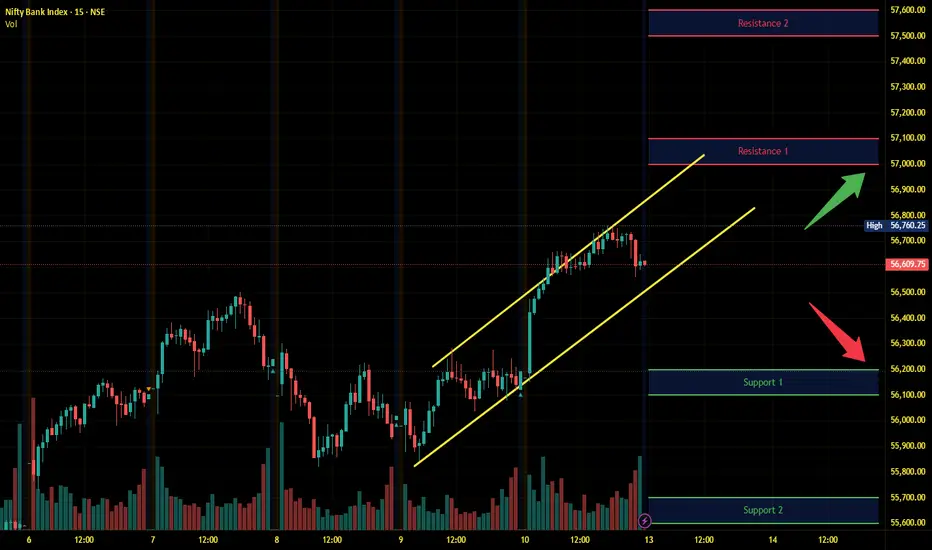
Banknifty Intraday Analysis for 13th October 2025NSE:BANKNIFTY
Index has resistance near 57000 – 57100 range and if index crosses and sustains above this level then may reach near 57500– 57600 range.
Banknifty has immediate support near 56200 - 56100 range and if this support is broken then index may tank near 55700 - 55600 range.
A gap-down opening is expected following the imposition of an additional 100% tariff by the US on Chinese imports effective November 1st. However, buying interest may emerge at lower levels as signals indicate possible finalisation of the India-US trade deal in the coming weeks.
Support and Resistance
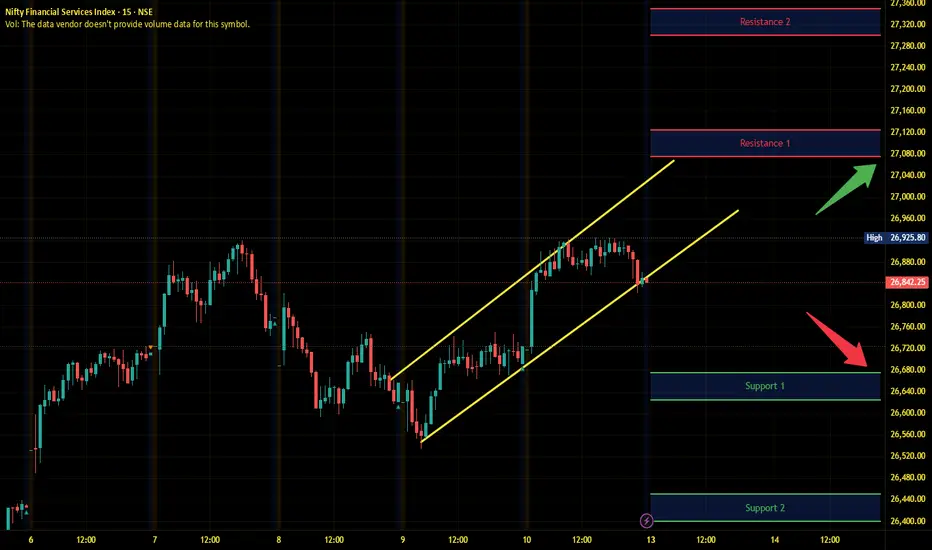
Finnifty Intraday Analysis for 13th October 2025NSE:CNXFINANCE
Index has resistance near 27075 - 27125 range and if index crosses and sustains above this level then may reach near 27300 - 27350 range.
Finnifty has immediate support near 26675 – 26625 range and if this support is broken then index may tank near 26450 – 26400 range.
A gap-down opening is expected following the imposition of an additional 100% tariff by the US on Chinese imports effective November 1st. However, buying interest may emerge at lower levels as signals indicate possible finalisation of the India-US trade deal in the coming weeks.
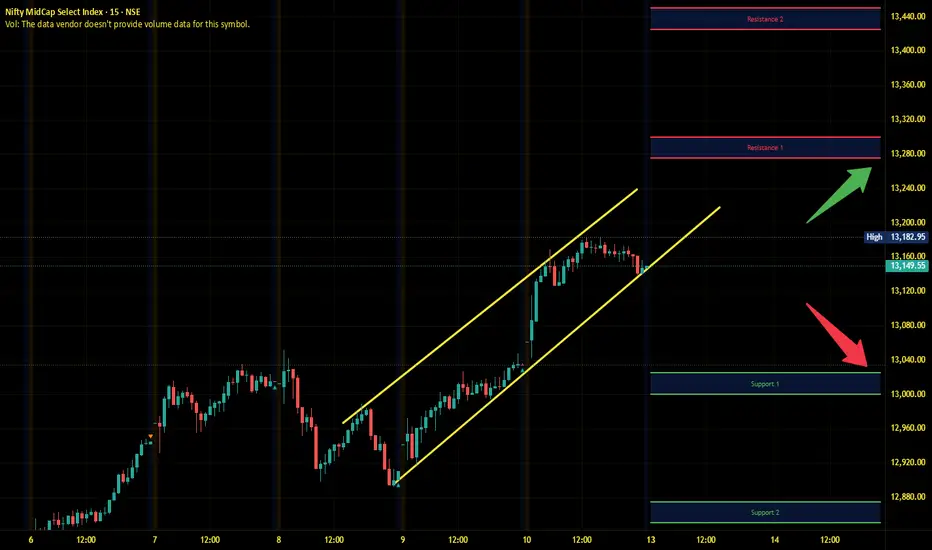
Midnifty Intraday Analysis for 13th October 2025NSE:NIFTY_MID_SELECT
Index has immediate resistance near 13275 – 13300 range and if index crosses and sustains above this level then may reach 13425– 13450 range.
Midnifty has immediate support near 13025 – 13000 range and if this support is broken then index may tank near 12875 – 12850 range.
A gap-down opening is expected following the imposition of an additional 100% tariff by the US on Chinese imports effective November 1st. However, buying interest may emerge at lower levels as signals indicate possible finalisation of the India-US trade deal in the coming weeks.
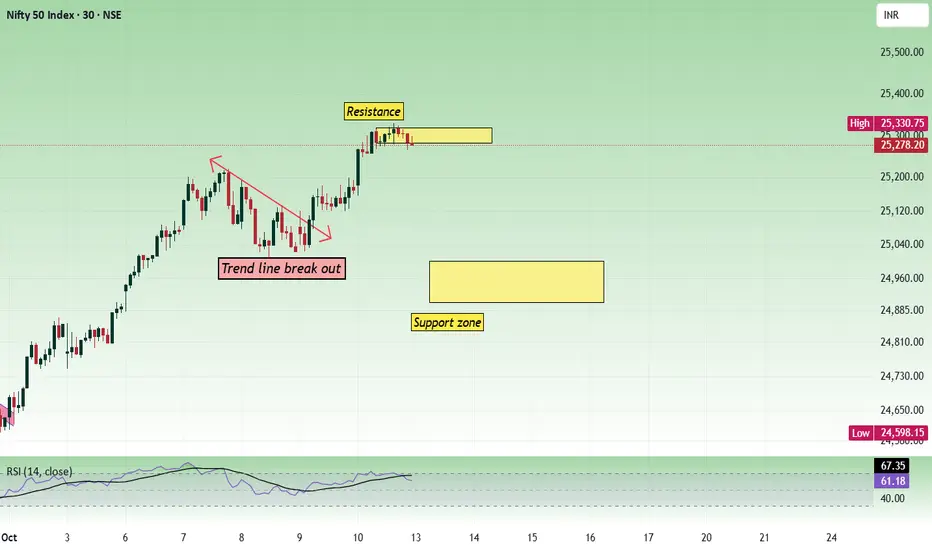
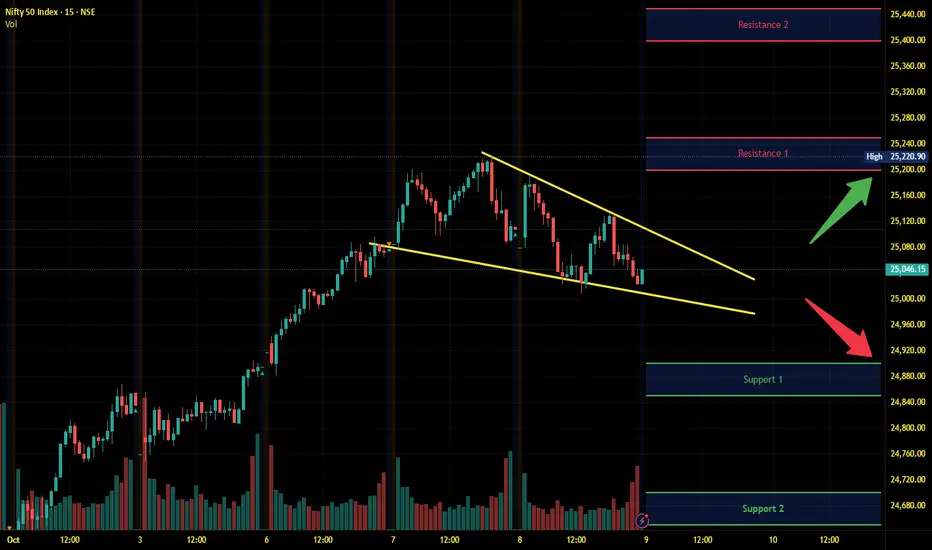
Nifty - Weekly Review Oct 13 to Oct 17Price has been facing resistance at the 25320 zone and has been unable to break through it on Friday. If we have a gap-down opening due to the weakness in global markets, 24900 - 25000 can act as a support zone. 24900 to 25000 can become choppy if there is no trend strength. If the support is broken, the next support will be 24600.
Let us assume we have a gap down opening near 25000.
Buy if there is any bullish strength above 25000 with the stop loss of 24950 for the targets 25040, 25080, 25120, 25200, 25280, 24320, 25360, and 24420.
Sell below 24880 with the stop loss of 24930 for the targets 24840, 24800, 24740, 24680, 24620, 24560, 24520, 24480, and 24400.
Always do your own analysis before taking any trade.
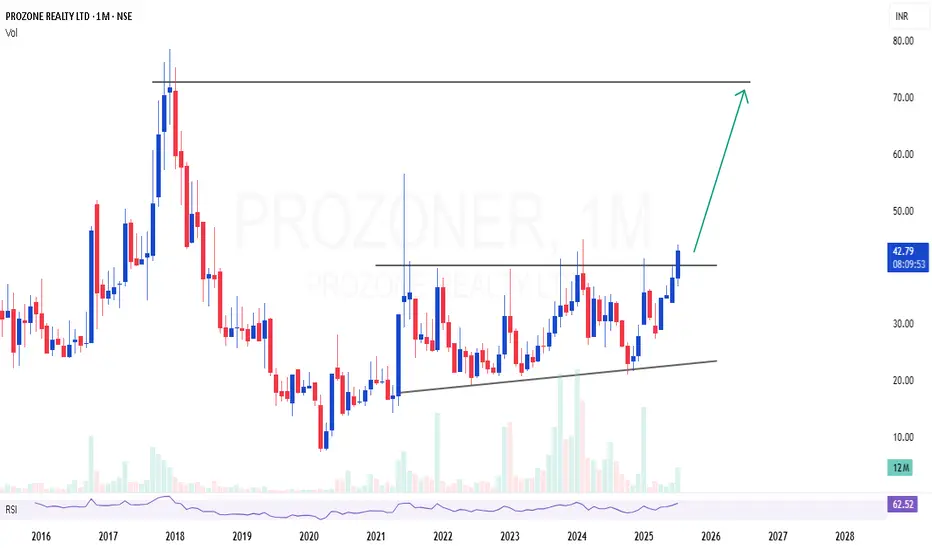
PROZONER | Excellent monthly breakout and closePROZONER | Excellent monthly breakout and close
Long consolidation and closed above the resistance in monthly time frame
Looks potential for 50-60% room
CMP : 42 (Dip : 35)
SL : 30
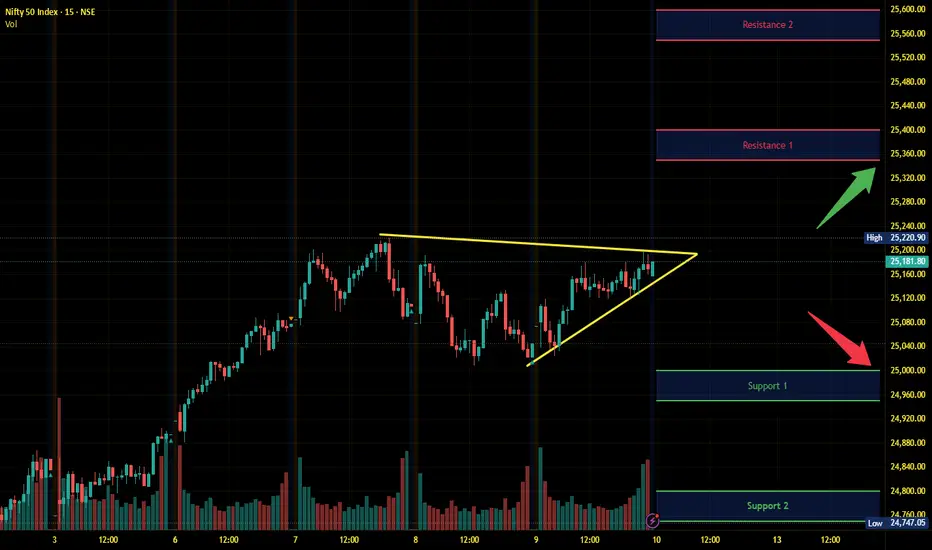
Nifty Intraday Analysis for 10th October 2025NSE:NIFTY
Index has resistance near 25350 – 25400 range and if index crosses and sustains above this level then may reach near 25550 – 25600 range.
Nifty has immediate support near 25000 – 24950 range and if this support is broken then index may tank near 24800 – 24750 range.
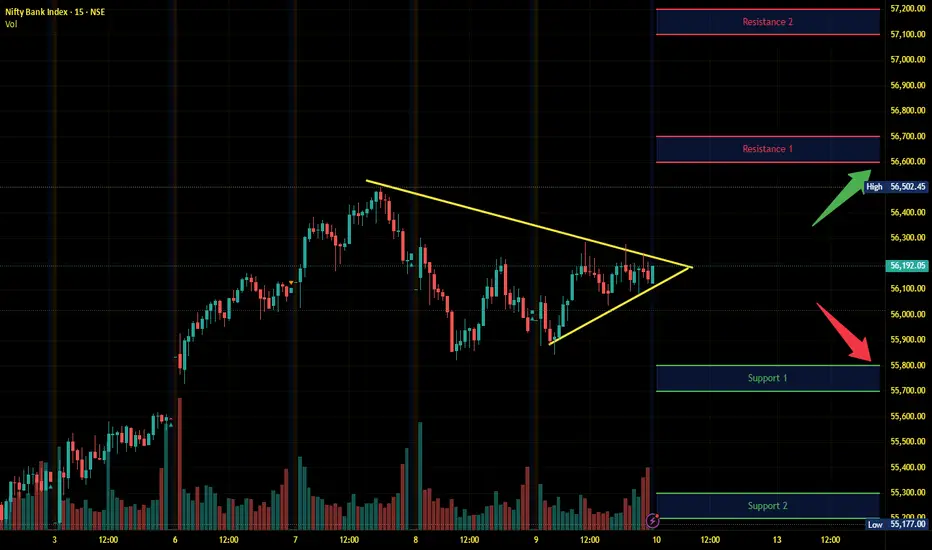
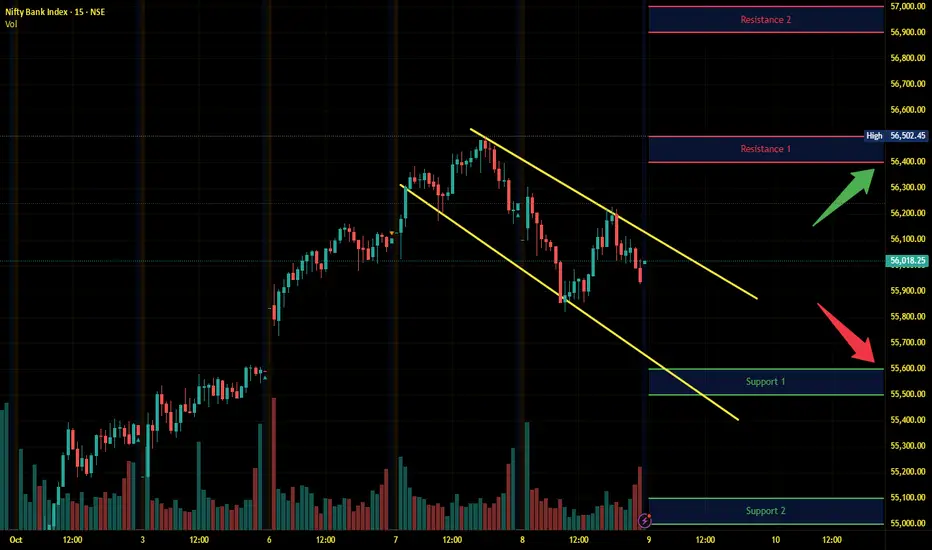
Banknifty Intraday Analysis for 10th October 2025NSE:BANKNIFTY
Index has resistance near 56600 – 56700 range and if index crosses and sustains above this level then may reach near 57100– 57200 range.
Banknifty has immediate support near 55800 - 55700 range and if this support is broken then index may tank near 55300 - 55200 range.
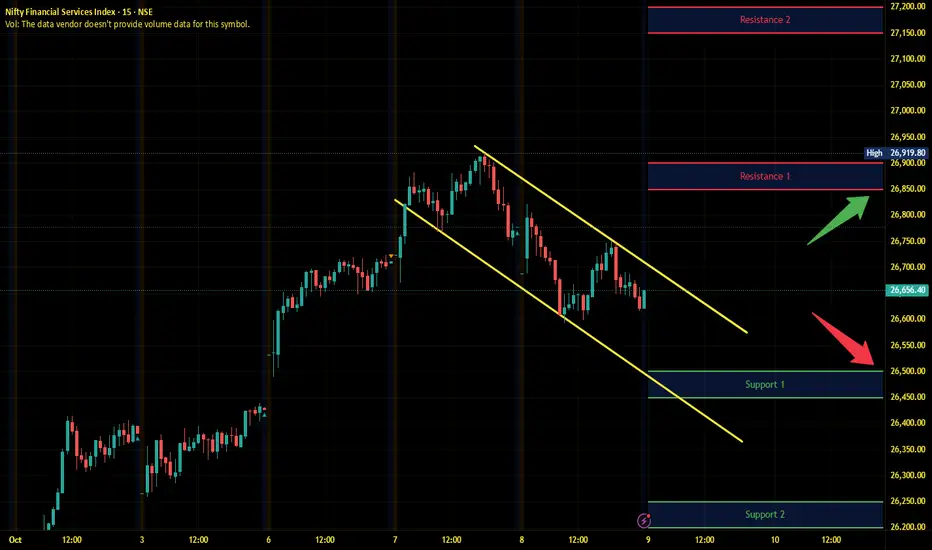
Finnifty Intraday Analysis for 10th October 2025NSE:CNXFINANCE
Index has resistance near 26900 - 26950 range and if index crosses and sustains above this level then may reach near 27150 - 27200 range.
Finnifty has immediate support near 26550 – 26500 range and if this support is broken then index may tank near 26300 – 26250 range.

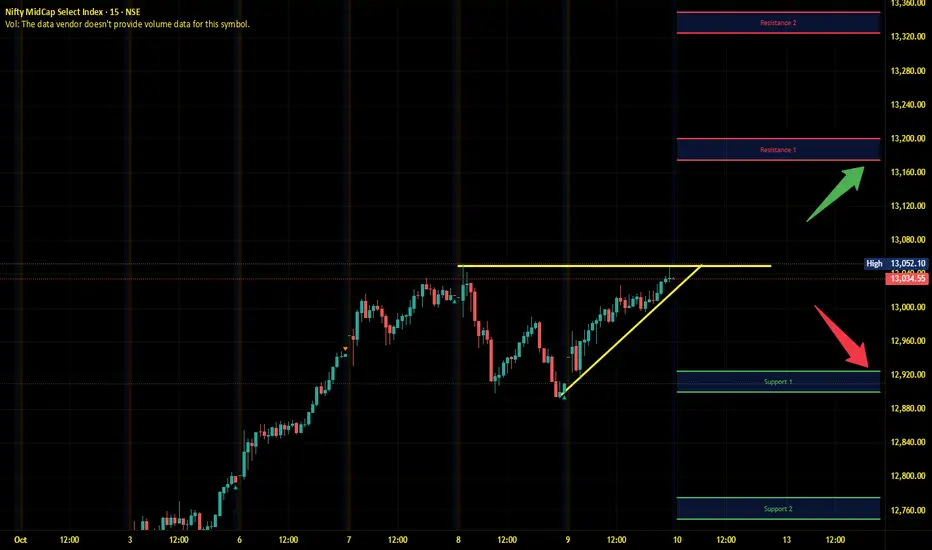
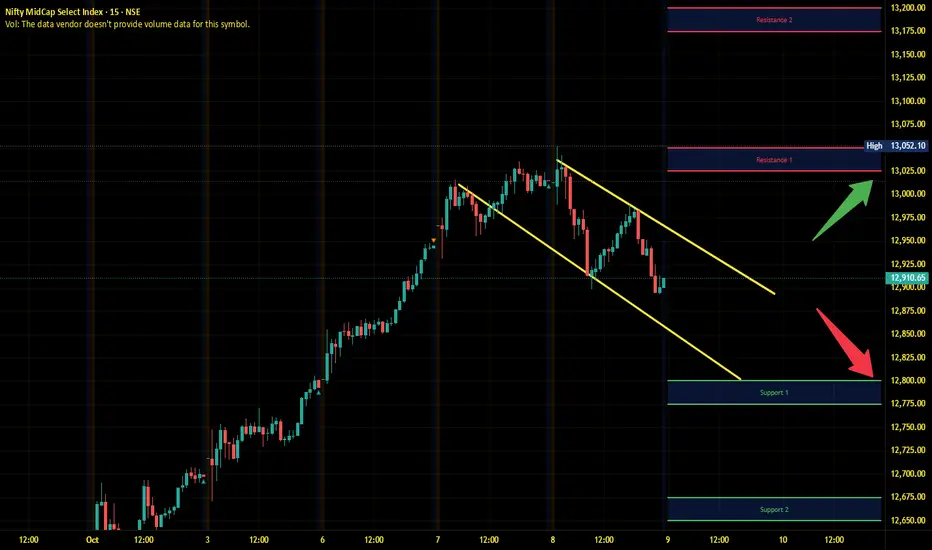
Midnifty Intraday Analysis for 10th October 2025NSE:NIFTY_MID_SELECT
Index has immediate resistance near 13175 – 13200 range and if index crosses and sustains above this level then may reach 13325– 13350 range.
Midnifty has immediate support near 12925 – 12900 range and if this support is broken then index may tank near 12775 – 12750 range.
India Hotels enters bearish zone under heavy selling pressureTopic Statement:
India Hotels has faced persistent selling since the start of the year, breaking its uptrend and entering a bearish phase.
Key Points:
1. The stock is now moving within a down-trending channel, making channel-based trading effective
2. Price is trading below both the 50 and 200-day EMAs, marking it as highly oversold in the short to medium term
3. Strong support has been established at the 700 level, which serves as a key accumulation zone for long-term investors

XAUUSD – Breakdown After Ceasefire & Fed Comments📉 Market Overview
Gold (XAUUSD) dropped over 2%, sliding from $4,012/oz to $3,945/oz, marking a sharp $67 decline overnight.
The selloff came as two key catalysts hit the market:
🕊 Israel–Hamas ceasefire agreement cooled down geopolitical tensions.
💬 Fed’s Barr pushed back against October rate cuts, sending USD higher and pressuring gold.
Despite the drop, price action suggests a temporary corrective phase, with gold now stabilising near a short-term support zone.
📊 Technical Structure (MMFLOW View)
Gold has confirmed a Head & Shoulders (H&S) breakdown pattern, with a neckline retest around $4,014 – $4,033 acting as resistance.
After the breakdown, price rebounded slightly but continues to trade below the structure, showing that bears remain in control short-term.
The short-term support zone sits around $3,945, and if broken, could accelerate the decline towards $3,912 – $3,885, aligning with deeper liquidity areas.
🔑 Key Zones to Watch
Resistance (Breakdown Zone): 4,014 – 4,033
Support (Short-term): 3,945 – 3,912
Liquidity/Buy Zone: 3,885 – 3,878
💡 MMFLOW Trading Scenarios
🔵 BUY SCALP Zone: 3,912 – 3,910
🔴 Stop Loss: 3,905
✅ Take Profit: 3,916 – 3,920 – 3,925 – 3,930 – 3,940 – 3,950 – ???
Trading View:
The market is still digesting recent fundamentals; volatility remains high.
A short-term rebound from 3,910 is possible as liquidity builds up near this demand zone.
However, unless price reclaims 4,014, any bounce may only be corrective before further downside continuation.
🧭 MMFLOW Insight
Even though gold faces bearish momentum, macro risks still support a long-term bullish narrative:
U.S. government shutdown risks remain unresolved.
Fed may turn dovish later in Q4 if labour data weakens.
Liquidity gaps below $3,900 could attract smart money accumulation zones.
⚠️ Trading Notes
✅ Always set Stop Loss – NFP-style volatility can occur post-Fed comments.
✅ Avoid chasing after breakdown candles. Wait for pullback entries at key levels.
✅ Be patient — the best setups form when liquidity is fully absorbed.
📍 Summary
Gold continues to trade under pressure after geopolitical easing and hawkish Fed tones.
Watch for price action around $3,910 – $3,945; this range will likely define the next major impulse.
Stay alert — once liquidity clears, MMFlow will be watching for smart-money reentry signals from key OB/CP zones.

SBIN 1HRSWING TRADE
- EARN WITH ME DAILY 10K-20K –
SBIN Looking good for upside..
When it break level 877.40 and sustain.. it will go upside...
BUY@ 877.40
Target
1st 886.35
2nd 894.10
FNO
SBIN OCT FUT – LOT 7 (Qty-5250)
SBIN OCT 855 CE – LOT 7 (Qty-5250)
Enjoy trading traders.. Keep add this STOCK in your watch list..
Big Investor are welcome to join the ride ..
Like this Post??? Hit like button..!!!
Follow me for FREE Educational Post and Alert..

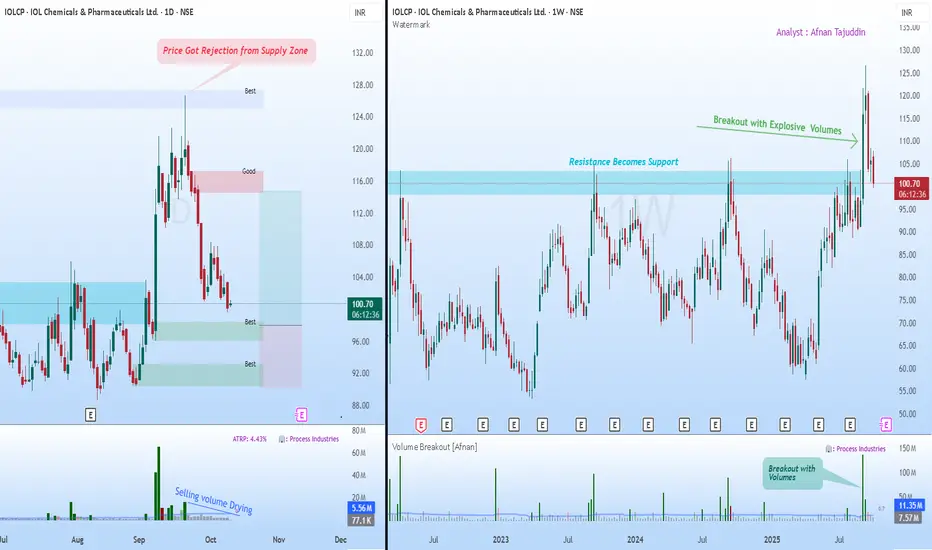
Supply & Demand Setup in IOLCP Could Signal Next Big Move📊 Supply & Demand View 📊
If you’ve been watching IOL Chemicals lately, you’ve probably noticed how cleanly it’s been respecting those key supply and demand structures. These zones aren’t random—they’re the visible fingerprints of institutions building or offloading positions in stages. When price revisits such levels, we often see sharp, almost surgical reactions.
Now, what’s catching my eye on the daily chart is the recent rejection from a supply zone. The pushback was clear, triggering a short-term decline. But here’s where it gets interesting: the selling volume has been steadily tapering off. That usually suggests the aggressive sellers are stepping aside, hinting that downside momentum could be losing steam.
Meanwhile, we’ve got multiple untested demand zones forming below—areas where buyers have shown conviction before. If price drifts into one of these regions again, I wouldn’t be surprised to see a fresh wave of institutional buying step in.
🚀 Breakout Retest View 🚀
Zooming out to the weekly chart tells a complementary story. After grinding under a major resistance for months, the stock finally broke through with explosive volume —the kind that only big money typically leaves behind. That breakout wasn’t just a blip; it reset the broader structure.
Now, the same resistance level has flipped into support—a textbook case of the law of polarity . As long as price continues to respect that zone, the larger trend remains firmly constructive.
What I find compelling is the combination of elements here: strong breakout volume, a healthy pullback, and structure alignment across timeframes. All signs point to this being a typical retest phase rather than a reversal.
✨ Final Takeaway ✨
Both charts are speaking the same language. The daily timeframe is hinting at exhaustion from sellers, while the weekly view reinforces the idea of a bullish continuation once demand reasserts itself. Should price stabilize around those lower demand zones, we could be looking at the next leg of the trend unfolding from there.
💡 Risk Management Reminder 💡
It’s easy to get carried away when the setup looks clean, but the market doesn’t owe certainty to anyone. Stick to your stop-loss, size your positions with care, and remember that discipline—more than any indicator—is what protects your capital.
“Charts reveal opportunities, but discipline secures profits.”
🔄 Stay patient, stay consistent — the market rewards preparation, not prediction. 🔄
This breakdown is shared purely for educational purposes and shouldn’t be taken as a trading or investment recommendation. I’m not a SEBI-registered analyst.
BTC/USD — Liquidity Manipulation at 19:00 IST (US Market Open)BTC/USD displayed a classic liquidity manipulation pattern around 19:00 IST, coinciding with the US market open. Price engineered a sweep above the local range high, triggering breakout liquidity before an aggressive reversal. This aligns with typical New York session behavior, where volatility expansion targets both sides of intraday liquidity zones.
The sharp rejection post-sweep indicates smart money distribution above a previous structural high, followed by a clean displacement move to the downside. The subsequent reaction near the demand zone around 121,000 reflects algorithmic re-balancing and potential accumulation after liquidity clearance.
Monitoring the 121,000–121,200 support zone is key for potential long setups if price structure shifts bullish; otherwise, failure to reclaim 122,000 may continue the short-term bearish flow.

XAUUSD| Unstoppable Uptrend, Gold Benefits from Fed & ETF Inflow📊 Market Context
Gold continues to maintain its upward trend amidst the political and economic instability in the US. The US government has entered its second week of shutdown with no signs of reaching an agreement, raising further concerns about the impact on economic performance.
Simultaneously, the Fed's entry into a monetary easing cycle since September, with expectations of further 25-point rate cuts in October and December, is driving strong buying momentum in gold.
Not just investors, but global central banks are also continuing to accumulate gold, adding 15 tonnes to reserves, indicating a gradual shift away from US public debt.
All these factors combined continue to reinforce a sustainable upward trend, opening up opportunities for strategic BUY moves.
🔎 Technical Analysis (H1/H4)
Prices remain within the upward channel, continuously retesting and bouncing off support zones.
Buy Scalp Zone 4004–4002: a quick reaction zone in the short term.
Main Buy Zone 3986–3984: key support, combined with FVG.
Target Resistance: 4068–4082 (Liquidity Zone).
📈 Trading Plan
✅ BUY SCALP: 4004–4002
SL: 3996
TP: 4008 - 4012 - 4016 - 4020 - 4030 - 4040 - ????
✅ BUY ZONE: 3986–3984
SL: 3980
TP: 3990 - 3995 - 4000 - 4010 - 4020 - 4030 - 4040 - ????
⚠️ Risk Management Note
The 4000 level is a psychological resistance – prone to liquidity sweeps.
Prioritise waiting for clear price action signals at BUY zones.
Adjust volume sensibly as volatility may increase with political news & Fed impacts on market sentiment.
✅ Summary
Gold's uptrend remains solid thanks to political instability, Fed easing, record ETF inflows, and central banks continuing to hoard gold. Strategy prioritises BUY at 4004–4002 and 3986–3984 with targets aiming at 4068–4082.
Nifty Intraday Analysis for 09th October 2025NSE:NIFTY
Index has resistance near 25200 – 25250 range and if index crosses and sustains above this level then may reach near 25400 – 25450 range.
Nifty has immediate support near 24900 – 24850 range and if this support is broken then index may tank near 24700 – 24650 range.
Banknifty Intraday Analysis for 09th October 2025NSE:BANKNIFTY
Index has resistance near 56400 – 56500 range and if index crosses and sustains above this level then may reach near 56900– 57000 range.
Banknifty has immediate support near 55600 - 55500 range and if this support is broken then index may tank near 55100 - 55000 range.
Finnifty Intraday Analysis for 09th October 2025NSE:CNXFINANCE
Index has resistance near 26850 - 26900 range and if index crosses and sustains above this level then may reach near 27150 - 27200 range.
Finnifty has immediate support near 26500 – 26450 range and if this support is broken then index may tank near 26250 – 26200 range.
Midnifty Intraday Analysis for 09th October 2025NSE:NIFTY_MID_SELECT
Index has immediate resistance near 13075 – 13050 range and if index crosses and sustains above this level then may reach 13175– 13200 range.
Midnifty has immediate support near 12800 – 12775 range and if this support is broken then index may tank near 12675 – 12650 range.
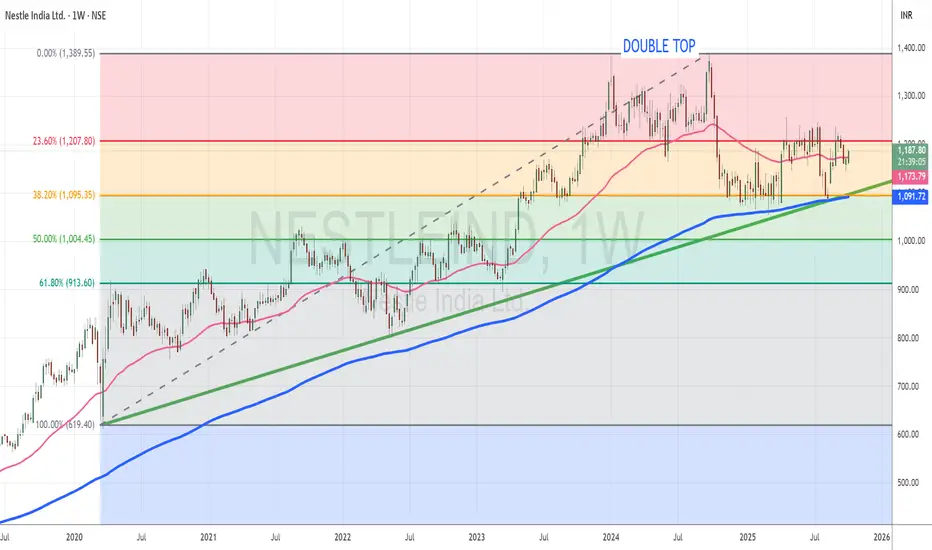
Nestle India eyes breakout after stock split boostTopic Statement:
Nestle India’s recent stock split has made the stock more affordable and liquid, as it now approaches key resistance levels with bullish momentum.
Key Points:
1. The price recently took strong support at the long-term trendline, resulting in a bullish deflection
2. The 38.2% Fibonacci retracement level at 1095 also provided crucial support during the recovery
3. The stock is currently attempting a breakout above the 23.6% retracement level at 1207, which could drive it toward its lifetime high at 1389
4. At 1389, the price may form a triple top candlestick pattern, and a successful breakout beyond this level could push the stock to new all-time highs
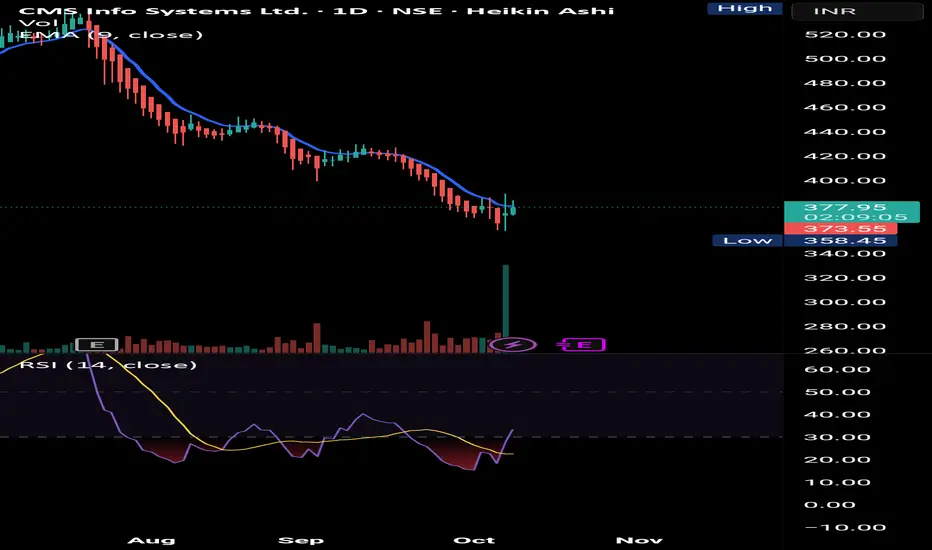
Buy for near term target 400 rs. Long term target 480 rs.CMS currently available at supply zone and yesterday delivery volume showing strong support at this price. Investors can plan to buy this good stock at support level.
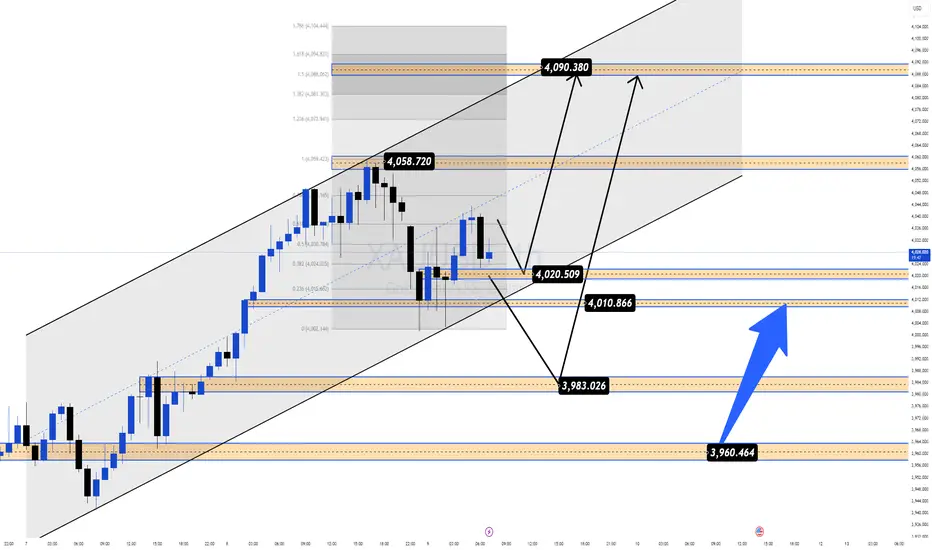
Bulls Reloading After a Healthy Pullback | Next Target: 4090+📊 Market Context
After a powerful bullish rally that pushed gold to record highs, XAUUSD retraced about 1% on Thursday as traders took profit from the recent surge. However, this move appears to be a technical correction, not a trend reversal — as indicators have shown overbought conditions for several sessions.
Despite this short-term pullback, the long-term uptrend remains intact.
Gold is up more than 50% year-to-date, driven by:
🌍 Ongoing geopolitical and trade tensions,
💰 The Federal Reserve’s monetary easing cycle,
🏦 Record central bank gold accumulation,
⚔️ Rising global uncertainty, fueling strong safe-haven demand.
Overall, this retracement could be an ideal setup for BUY re-entries, as bulls look to reload positions toward the 4090–4100 liquidity zone.
🔎 Technical Analysis (H1/H4)
Price remains inside the medium-term bullish channel, showing strong reactions around 4000–3980 support.
4010–4008 acts as a quick scalp zone for short-term entries.
3984–3982 serves as a key structural support and liquidity reaction area.
4090–4092 (Liquidity Sell Zone) stands as the major resistance — potential liquidity trap area.
📈 Trading Plan
✅ BUY SCALP: 4010–4008
SL: 4002
TP: 4015 - 4020 - 4030 - 4040 - 4050 - ????
✅ BUY ZONE: 3984–3982
SL: 3978
TP: 3990 - 3995 - 4000 - 4005 - 4010 - 4020 - ????
✅ SELL ZONE: 4090–4092
SL: 4098
TP: 4085 - 4080 - 4070 - 4060 - 4050 - ????
⚠️ Risk Management Notes
The 4000 level remains a strong psychological and structural support — only enter long positions with confirmed price action signals.
Be cautious around 4090–4100, where liquidity sweeps and false breakouts are likely.
Adjust position size properly to manage volatility during high-impact news or geopolitical updates.
✅ Summary
Gold is undergoing a healthy correction phase within its broader uptrend.
The strategy remains BUY-focused at 4010–4008 and 3984–3982,
with upside targets toward 4060–4090,
and a potential short-term SELL opportunity near 4090–4092 if rejection signals appear.
💡 MMFLOW TRADING – Trade with market structure, follow liquidity, and ride the BIGWIN setups!
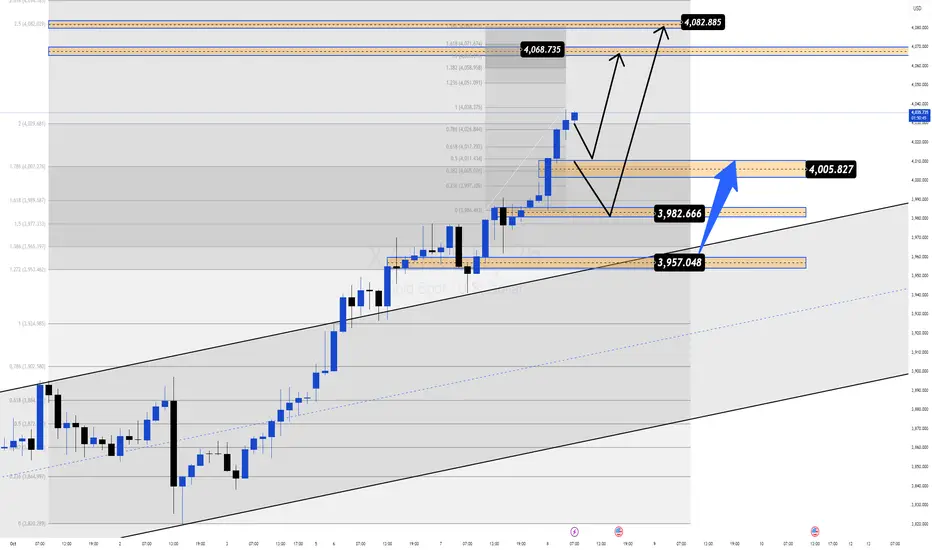
XAU/USD: Targeting $4,100! Where to Buy Before the FOMC Minutes?Hello TradingView community! 🚀
Gold (XAU/USD) continues to demonstrate incredible strength, consistently breaking past old highs and forming a solid upward price channel. This robust uptrend is not only technically reinforced but also awaits a potential catalyst from today's significant fundamental news.
In this analysis, we will combine two crucial perspectives: an in-depth look at the technical charts to identify optimal entry points, and an examination of the key fundamental event that could significantly impact Gold prices during the US session.
1. Fundamental Perspective: All Eyes on the FOMC Minutes
Today's market highlight, Wednesday, October 8, is the release of the FOMC Meeting Minutes at 2:00 PM ET
Why is this important? This document provides a detailed record of the latest policy meeting of the US Federal Reserve (FED) in September. Traders will scrutinise the text for any hints about the future interest rate path.
Potential scenarios:
"Dovish" Tone: If the minutes reveal FED officials' concerns about economic growth and the possibility of further rate cuts, the US Dollar might weaken. This would create a strong push for Gold (XAU/USD), potentially driving the next price surge.
"Hawkish" Tone: If the minutes emphasise that inflation remains a concern and the FED is not in a hurry to cut rates, the USD might see a short-term recovery, causing Gold to have a corrective dip.
This event is a top catalyst for volatility. Our strategy is to prepare technical zones to capitalise on the market's reaction.
2. Technical Analysis: Detailed Trading Plan
The bullish structure on the 2H timeframe is undeniable. Prices are creating a series of higher highs, confirmed by each "BoS" (Break of Structure), signalling that the Buyers are in full control. Here are the key zones to watch:
Potential Buy Zones (Key Points):
FVG Zone ($4,004): The nearest support is this Fair Value Gap, an area of price imbalance that the market often seeks to fill. Prices may retest this area before or during the news release.
"Buy Break BoS" Zone ($3,981): This is the nearest swing high that has been broken. Now it has turned from resistance into a crucial support level. This zone offers a solid entry point if prices correct slightly deeper.
"Bullish Order Block" Zone ($3,951): This is the last major "stronghold" of the Buyers—a powerful buy order block that initiated the latest push wave. This is an ideal area to look for buy orders if the market experiences a strong liquidity sweep downwards.
Upside Targets:
Short-term Target (Scalping): $4,070 - This level coincides with the 0.786 Fibonacci level.
Main Target: "Liquidity Sell" Zone at $4,103. This is a large "liquidity pool" where the Sellers' stop-loss orders are likely concentrated. Smart money often drives prices to such areas.
Strategy Summary
Main Trend: Bullish.
Core Strategy: Look for "Buy the dip" opportunities at the key support zones mentioned.
Critical Timing: Be cautious around the FOMC Minutes release (18:00 UTC). Volatility can be high, and the market may whip in both directions to sweep stop-losses before following the main trend.
Pro Tip: Patience is key. Waiting for prices to pull back to a confirmed support zone will provide a much better Risk/Reward ratio than chasing the market at the top.
WHAT'S YOUR VIEW?
How do you think Gold will react to today's FOMC minutes? And where are you looking to place your buy orders—at the FVG zone $4,004, the BoS level $3,981, or are you patiently waiting for the Order Block $3,951?
Share your views in the comments below!
👇 Don't forget to leave a Like 👍 and Follow the channel for the latest XAU/USD analysis updates!
