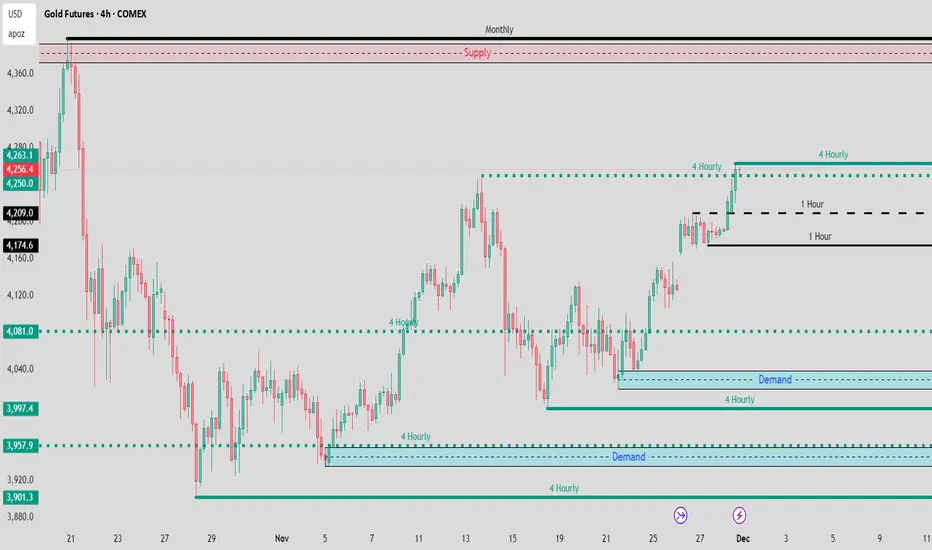
Gold (COMEX:GC1!) 4 Hours Chart Just sharing the Gold (COMEX:GC1!) 4 Hours Chart with Support/Resistance, Supply/Demand
Support and Resistance
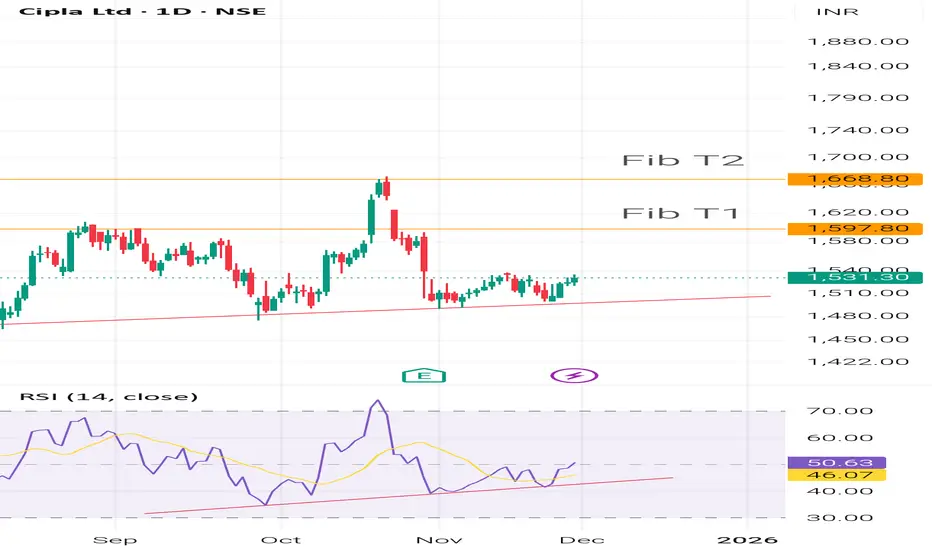
Potential Upside The Stock has potential upside for two reasons:
1. Stock is showing Uptrend with Higher lows and has taken support on trend line.
2. The Rsi of the stock is also supporting Uptrend.
The two targets can be set at the next Fibonacci Levels.
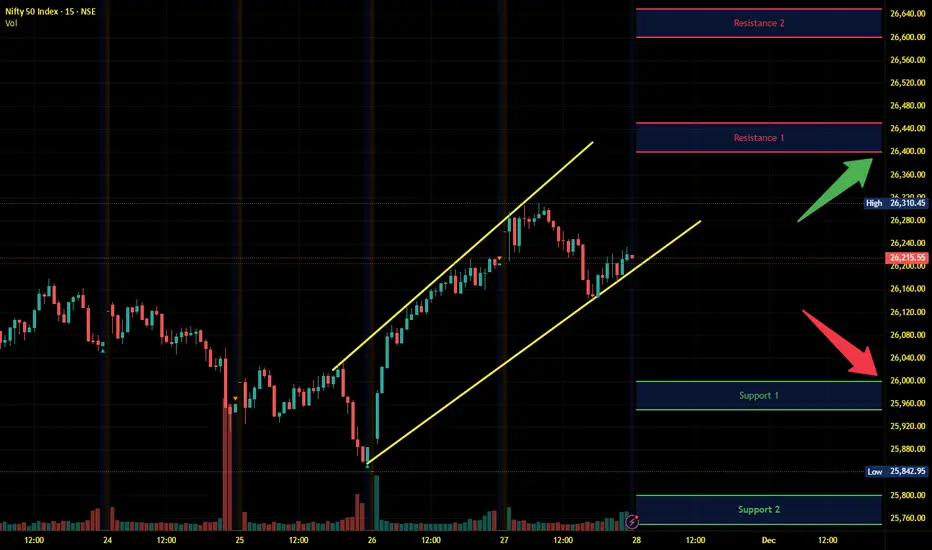
Nifty Intraday Analysis for 28th November 2025NSE:NIFTY
Index has resistance near 26400 – 26450 range and if index crosses and sustains above this level then may reach near 26600 – 26650 range.
Nifty has immediate support near 26000 – 25950 range and if this support is broken then index may tank near 25800 – 25750 range.
The uptrend is intact and a positive close will set the uptrend momentum for the next week.
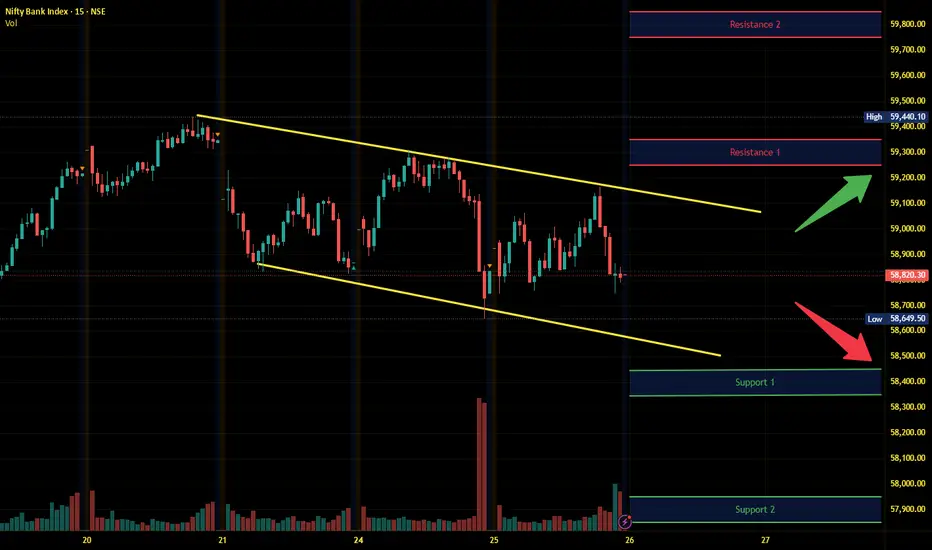
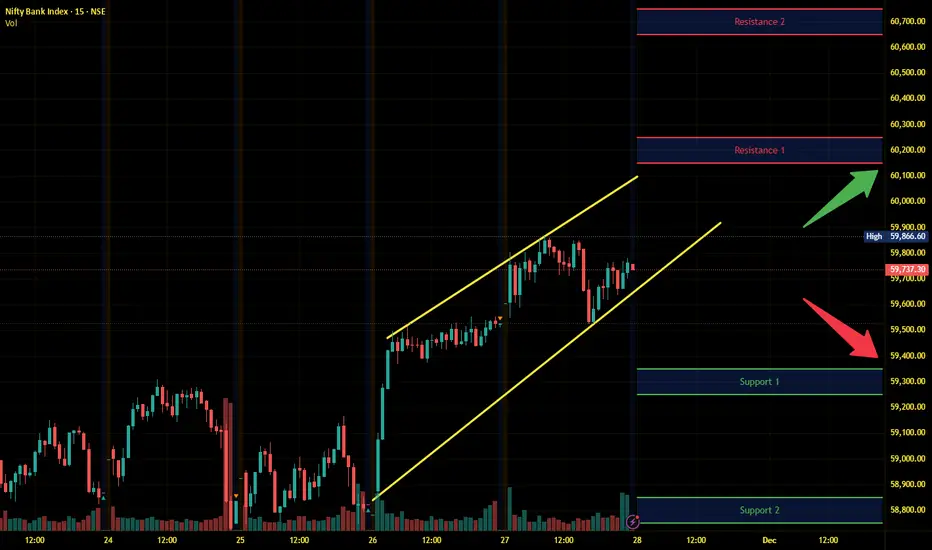
Banknifty Intraday Analysis for 28th November 2025NSE:BANKNIFTY
Index has resistance near 60150 – 60250 range and if index crosses and sustains above this level then may reach near 60650 – 60750 range.
Banknifty has immediate support near 59350 - 59250 range and if this support is broken then index may tank near 58850 - 58750 range.
The uptrend is intact and a positive close will set the uptrend momentum for the next week.
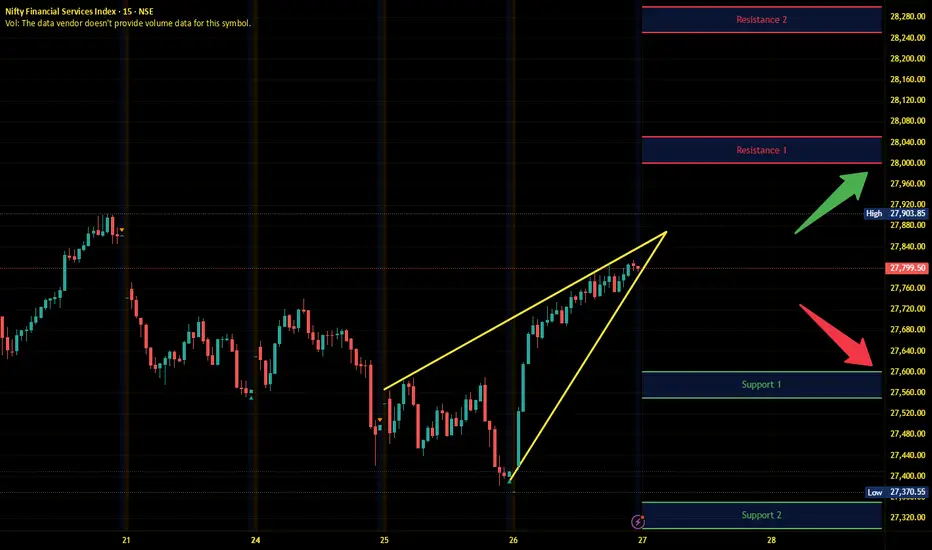
Finnifty Intraday Analysis for 28th November 2025 NSE:CNXFINANCE
Index has resistance near 28200 - 28250 range and if index crosses and sustains above this level then may reach near 28400 - 28450 range.
Finnifty has immediate support near 27750 – 27700 range and if this support is broken then index may tank near 27500 – 27450 range.
The uptrend is intact and a positive close will set the uptrend momentum for the next week.

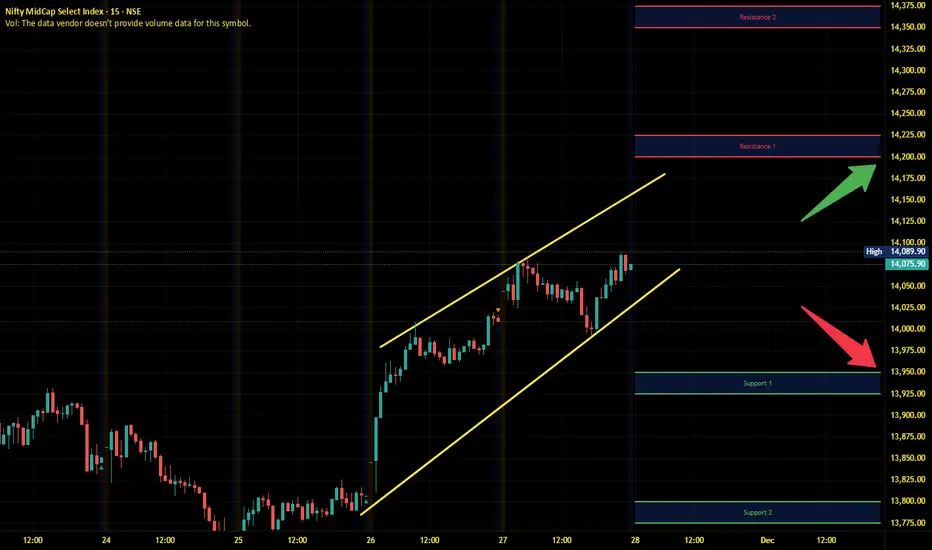
Midnifty Intraday Analysis for 28th November 2025NSE:NIFTY_MID_SELECT
Index has immediate resistance near 14200 – 14250 range and if index crosses and sustains above this level then may reach 14350 – 14375 range.
Midnifty has immediate support near 13950 – 13925 range and if this support is broken then index may tank near 13800 – 13775 range.
The uptrend is intact and a positive close will set the uptrend momentum for the next week.
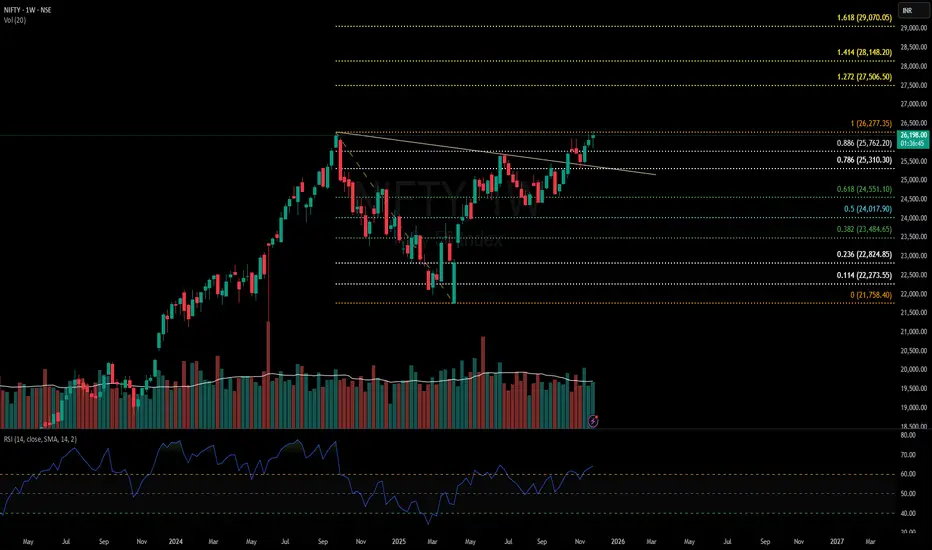
NIfty50 Analysis: Is it start of new bull run or a bull trap?Nifty50 Has given a cup& handle breakout and has already retested this breakout.
Currently, it is hovering near ATH and already looks ready for a breakout.
If this breakout sustains, we might see a good rally coming till budget(Feb'26) and levels to watch according to fib are 27500, 28150 & 29000.
However, December is a favourite season for FIIs to offload money and a correction is historically seen during Christmas season. So, there is a high probability of a bull trap formation as well.
25300 will be a crucial support for Nifty. a breakdown of this level will be confirmation of bull trap and we might see a sharp fall towards 24000 level.
I will suggest to keep a watch on Nifty price action if you have any swing trades open.
XAUUSD GOLD Analysis on (27/11/2025)#XAUUSD UPDATEDE
Current price - 4157
Best Buy Area - 4131-4129 (Stop loss -4110)
BUY TARGET - 4175-4191

SMS Pharma (D): Strongly Bullish - News-Driven BreakoutThe stock has confirmed a major structural reversal, breaking out of a 6-month consolidation pattern. This move is powered by a significant regulatory approval (USFDA) and strong earnings, validating the high volume.
🚀 1. The Fundamental Catalyst (The "Why")
The massive surge and volume are not random. They are a direct reaction to two major positive developments:
- USFDA Approval: The company's partner, VKT Pharma, received USFDA approval for reformulated Ranitidine tablets (an antacid). This marks a re-entry into the US market after years, opening a significant revenue stream.
- Strong Earnings: The company recently reported a 79% YoY jump in Net Profit for Q2 FY26.
- Impact: This fundamental "double engine" provides the conviction that the breakout is genuine and not a "trap."
📈 2. The Long-Term Structure (The Reversal)
- The Correction: After the Sep 2024 ATH (~₹398) , the stock corrected ~55% to bottom out in March 2025 .
- The Turnaround: Since March, the stock has shifted structure, forming Higher Lows , indicating that buyers are stepping in aggressively on dips.
- The "Dual" Resistance:
1. Angular Resistance: From the Sep 2024 ATH.
2. Horizontal Resistance: The ₹314–₹317 zone (active since Nov 2024).
💥 3. The Breakout & Re-test (Current Action)
- The Breakout (Yesterday): The stock surged 17.82% with massive volume ( 11.76 Million ), decisively closing above both resistance lines. This high-volume close confirms the "Lid" is off.
- The Re-test (Today): The stock pulled back to the ₹314–₹317 zone today. The volume during this pullback was lower than the breakout volume.
- Bullish Signal: A low-volume pullback to a high-volume breakout level is a textbook "healthy re-test." It suggests profit-taking, not a trend reversal.
📊 4. Technical Indicators
- RSI Cooling: The Daily RSI has fallen with today's re-test. This is actually positive—it prevents the stock from becoming "overheated" too quickly, allowing it to gather strength for the next leg up.
- EMAs: The PCO state across all timeframes confirms that the trend is aligned in favor of the bulls.
🎯 5. Future Scenarios & Key Levels
The "healthy re-test" sets the stage for continuation.
- 🐂 Bullish Target: ₹360 . If the stock holds the re-test level, a move to ₹360 (and potentially the ATH of ₹398) is the path of least resistance.
- 🛡️ Support (The Stop Loss): Support level at ₹290–₹292 is the critical "safety net." If the stock falls back below the breakout zone (₹314), it must hold ₹290 to keep the bullish structure alive.
Conclusion
This is a Grade A setup . Technical breakout, a healthy re-test, and a powerful fundamental catalyst. As long as ₹314 holds as support, the bias is strongly upward.

Adani Ports & Special Economic Zone LtdCurrent price shown: ₹1,450.50, up ₹7.40 (+0.51%).
The chart displays a strong uptrend from late August onward.
A rising trendline (blue, upward-sloping) supports the price from the lows of September through November.
Price has recently pulled back slightly but is still near the upper resistance zone.
Major resistance zone highlighted: around ₹1,515–₹1,530.
Support level marked near ₹1,467–₹1,480 (shaded lower red area).
The price is currently trading close to resistance.
Volume bars at the bottom show moderate trading activity, with occasional spikes.
No abnormal volume at the latest price area.

BTCUSD Analysis on (27/11/2025)BTCUSD UPDATEDE
Current price- 90850
If price stay above 85000,then next target 99000,106500 and below that 80000
Plan; if price break 90850-89700 area and above that 91500 area,we will place buy oder in BTCUSD with target of 99000,106500 & stop loss should be placed at 85000

BTCUSD SHOWING A GOOD UP MOVE WITH 1:10 RISK REWARD BTCUSD SHOWING A GOOD UP MOVE WITH 1:10 RISK REWARD
DUE TO THESE REASON
A. its following a rectangle pattern that stocked the market
which preventing the market to move any one direction now it trying to break the strong resistant lable
B. after the break of this rectangle it will boost the market potential for break
C. also its resisting from a strong neckline the neckline also got weeker ald the price is ready to break in the outer region
all of these reason are indicating the same thing its ready for breakout BREAKOUT trading are follws good risk reward
please dont use more than one percentage of your capitalfollow risk reward and tradeing rules
that will help you to to become a bettertrader
thank you

Nifty Intraday Analysis for 27th November 2025NSE:NIFTY
Index has resistance near 26400 – 26450 range and if index crosses and sustains above this level then may reach near 26600 – 26650 range.
Nifty has immediate support near 26000 – 25950 range and if this support is broken then index may tank near 25800 – 25750 range.
Overall momentum is positive, however, rangebound trade is expected due to expiry day of the Monthly F&O contract on BSE.

Banknifty Intraday Analysis for 27th November 2025NSE:BANKNIFTY
Index has resistance near 59900 – 60000 range and if index crosses and sustains above this level then may reach near 60400 – 60500 range.
Banknifty has immediate support near 58100 - 59000 range and if this support is broken then index may tank near 58600 - 58500 range.
Overall momentum is positive, however, rangebound trade is expected due to expiry day of the Monthly F&O contract on BSE.

Finnifty Intraday Analysis for 27th November 2025NSE:CNXFINANCE
Index has resistance near 28000 - 28050 range and if index crosses and sustains above this level then may reach near 28250 - 28300 range.
Finnifty has immediate support near 275200 – 27550 range and if this support is broken then index may tank near 27350 – 27300 range.
Overall momentum is positive, however, rangebound trade is expected due to expiry day of the Monthly F&O contract on BSE.
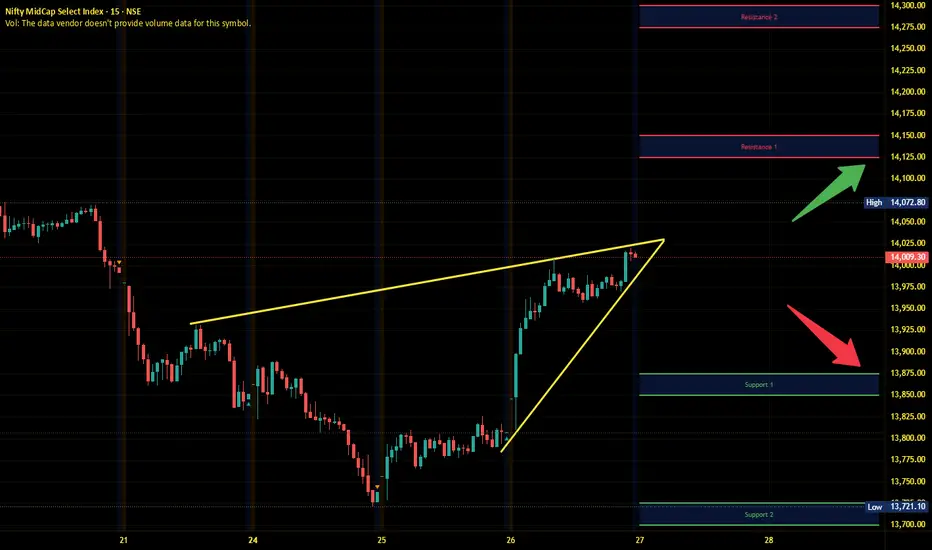
Nifty Intraday Analysis for 27th November 2025NSE:NIFTY_MID_SELECT
Index has immediate resistance near 14125 – 14150 range and if index crosses and sustains above this level then may reach 14275 – 14300 range.
Midnifty has immediate support near 13875 – 13850 range and if this support is broken then index may tank near 13725 – 13700 range.
Overall momentum is positive, however, rangebound trade is expected due to expiry day of the Monthly F&O contract on BSE.
XAU/USD: Gold Stagnates, Poised for a Strong Surge📊 Market Structure
Gold is moving in a tight accumulation phase (compression) between two important zones:
• OB Support: 4,130 – 4,126
• Resistance – Small Supply: 4,148 – 4,166
The previous trend remains a strong uptrend (clear BoS sequence from 4,089), and currently, the price is retesting the newly formed peak-bottom structure.
The BUY side is still in control as long as the price stays above:
• 4,130 – Main OB Support
• 4,104 – Discount FVG
• 4,089 – Key Low Confirming Trend
If gold holds these zones, the next targets will be the upper liquidity levels:
• 4,166
• 4,181
• 4,207
• 4,243
💎 Key Technical Zones
• OB Support 1: 4,130 – 4,126
• FVG Zone: 4,104 – 4,089 (best discount)
• Deep Bearish OB: 4,060 – 4,045 (if price drops sharply)
• Upper Liquidity Targets: 4,166 → 4,181 → 4,207 → 4,243
🎯 Trading Plan (Priority BUY)
1️⃣ BUY 1 – Retest OB 4,130
When the price touches the OB support zone 4,130 – 4,126 and shows a bounce signal (rejection / engulfing).
• Entry: 4,130 – 4,126
• SL: below 4,115
• TP1: 4,166
• TP2: 4,181
• TP3: 4,207
• TP4: 4,243
→ Quick setup, good RR, trend aligned.
2️⃣ BUY 2 – Discount FVG 4,104 – 4,089
This is the best BUY zone if the market drops sharply before rising.
• Entry: 4,104 – 4,089
• SL: 4,070
• TP1: 4,166
• TP2: 4,181
• TP3: 4,207
• TP4: 4,243
→ Strong confluence: FVG + fibo discount + key liquidity.
3️⃣ BUY 3 – Deep Accumulation at Bearish OB Shift
• Entry: 4,060 – 4,045
• SL: 4,020
• TP: 4,104 → 4,166 → 4,207
→ Only activate if “flush liquidity” appears.
🎯 SELL Scalp (secondary – not priority)
Only SELL when there is a clear rejection reaction at:
• 4,166 – first liquidity sweep zone
• 4,181 – strong reaction zone
• 4,207 – main bearish OB
• 4,243 – large liquidity peak
• SL: 10–15 USD
• TP: 4,148 → 4,130
→ For scalpers only, not a main setup.
🧠 Vincent’s View
The market structure remains completely bullish. The market is accumulating energy in a narrow range before breaking strongly to the upper liquidity targets.
As long as gold stays above 4,089 – the uptrend remains dominant.
“Patience builds the entry – liquidity completes the move.” ⚜️
⏰ Timeframe: 1H
✍️ Analysis by: Captain Vincent

XAU/USD – Gold Holds Above Key Support as Pullback Stays LimitedGold remains capped below its two-week high during the Asian session, but the downside is clearly limited.
Market sentiment is shaped by:
A weaker USD as dovish Fed expectations gain traction
Rising probability of rate cuts in upcoming meetings
Improving global risk sentiment amid hopes of progress in Russia–Ukraine negotiations
Even though Gold is retracing, the bigger picture remains bullish as long as price holds above key support zones.
📊 Technical Outlook – MMF Trading Style (M30/H1)
Price is currently consolidating below the resistance cluster 4,156 – 4,170, retracing into multiple demand zones.
Key Levels to Watch
Support 1: 4,131 – 4,137
Support 2: 4,115 – 4,118
Support 3 (major liquidity): 4,083 – 4,090
Main Resistance: 4,170 – 4,193
Market structure shows a clean zigzag pullback, suggesting a potential bullish continuation once liquidity is collected below.
🎯 MMF Intraday Trading Plan
Scenario 1 – Buy the Dip (Primary Bias)
Best trade today: Buying retracements into demand.
BUY: 4,115 – 4,118
SL: 4,103
TP: 4,131 → 4,156 → 4,170
BUY (extended liquidity sweep): 4,083 – 4,090
SL: 4,070
TP: 4,118 → 4,145 → 4,170 – 4,193
Reason: Fibo confluence + strong demand + liquidity zone = high-probability reversal area.
Scenario 2 – Short-Term SELL (Scalp Only)
Only valid if price rejects strongly at resistance.
SELL: 4,156 – 4,170
SL: 4,177
TP: 4,145 → 4,131
This is not the main bias today.
⚜️ MMF Trading View
Gold is forming a healthy pullback—not, at this stage, a bearish reversal.
As long as price stays above 4,08x, the bullish structure remains intact.
“In Gold, the goal isn’t chasing the breakout — it’s waiting for price to return to value.”
Today’s focus: Prefer BUY setups on retracement – SELL only for quick scalps.

Sensex - Expiry day analysis Nov 27Today, the price opened gap down, showed bullish strength, broke the resistance and moved up. Now it is near the next resistance, which is also a double top. 85600 - 85800 zone should show bullish strength to break 86k.
If the price opened right at the double top and showed bearish strength, then it can test the 85500 zone.
If the price opens flat, buy above 85640 with the stop loss of 85520 for the targets 85760, 85900, 86080 and 86160.
Sell below 85380 with the stop loss of 85520 for the targets 85260, 85120, 85020, 84900 and 84780.
Daily chart shows the strength of today's move.
The expected expiry day range is 85500 to 86300.

Hindustan Petroleum Corporation Ltd – Weekly Chart AnalysisPricePrice has been moving inside a rising wedge structure, forming higher highs & higher lows over the past several months. Recently, the stock attempted a breakout above the wedge resistance but is now trading near the upper trendline, showing signs of pullback or retest behavior.
Volume has remained moderate, suggesting the market is waiting for a clear direction.
Now price action is at a decision zone — either a successful retest could resume bullish momentum, or failure may lead to profit-booking and a slide toward lower support trendlines.
This zone becomes crucial for directional clarity.

FVG Retracement With EMA, RSI & Fib Confluence📈 Bitcoin Chart – FVG Retracement With EMA, RSI & Fib Confluence in a Bearish Market Structure
This chart showcases a sustained bearish sequence on BTC, defined by a clean continuation of Lower Highs (LH) and Lower Lows (LL). Throughout this decline, multiple Fair Value Gaps (FVGs) have formed both locally and at higher levels — each created by strong institutional sell-side displacement.
As price trends downward, these unmitigated FVGs above the market consistently act as magnet zones:price retraces into previous inefficiencies, rebalances them, and resumes the dominant bearish trend.
In the current setup, the integration of FVGs + Fibonacci Retracement(Point A to B) + EMA Levels + RSI Momentum provides a highly structured roadmap for anticipating retracements and continuation points.
The most significant imbalance sits near the major Fib retracement zone and under key EMAs — making it the highest-probability reaction area. Secondary FVGs below it may still induce a bounce, but carry lower structural relevance.
⸻⸻⸻⸻⸻⸻⸻⸻⸻⸻
📊 Key Observations
1️⃣ Prior FVG Mitigation
A previously formed FVG under the EMA was cleanly filled, followed by immediate downside continuation.
This confirms bearish order-flow control and validates the role of FVGs as efficient retracement targets in a downtrend.
2️⃣ High-Priority FVG (Primary Zone)
The upper FVG holds the strongest confluence:
Created by strong displacement
Sits below the EMA50
Aligns with the 38.2%–61.8% Fib retracement zone
This cluster makes it the most likely zone for a meaningful bearish rejection if price retraces into it.
3️⃣ Secondary FVG Reaction Zone
A lower FVG also exists beneath the main zone.
Although it can cause a minor corrective bounce, it formed during a smaller move and does not align with the key trend or Fib levels — giving it lower probability.
4️⃣ RSI Momentum Context
RSI remains below 50, confirming bearish momentum.
When RSI stays under mid-line, bearish FVG reactions tend to be more reliable and continuation setups form cleanly.
5️⃣ Structural Context
The broader structure remains decisively bearish as long as price trades below the EMAs and below the major upper FVG.
Retracements into these zones are more likely to serve as rebalancing moves rather than genuine reversal attempts.
⸻⸻⸻⸻⸻⸻⸻⸻⸻⸻
📊 Chart Explanation
Symbol → BTCUSDT
Timeframe → 1D
This visualization illustrates how Smart Money Concepts apply cleanly during strong trending conditions:
A clear LH–LL downtrend
Several historical FVGs acting as retracement magnets
A previously mitigated FVG confirming bearish control
A high-confluence FVG aligned with EMAs and Fib levels
A secondary imbalance that can still induce short-term reactions
RSI showing momentum remains bearish
Together, these elements outline a textbook sequence:
displacement → inefficiency → retracement → rebalancing → continuation.
Price remains under firm bearish control unless it breaks above the upper FVG with conviction.
⸻⸻⸻⸻⸻⸻⸻⸻⸻⸻
📘 Using Fib Retracement, EMA50, and RSI With FVGs (Bullish + Bearish)
🔹 1. Fibonacci Retracement + FVG
In a downtrend, draw Fib from swing high → low; in an uptrend, draw low → high
The 38.2%–61.8% zone is the prime retracement area in both directions.
If an FVG forms or sits inside this Fib zone, it becomes a high-probability reaction point (bearish rejection in downtrend, bullish bounce in uptrend).
🔹 2. EMA50 + FVG
In a bearish trend, price and FVGs forming below EMA50 act as stronger bearish retracement zones.
In a bullish trend, price and FVGs forming above EMA50 act as stronger bullish retracement zones.
EMA50 acts as a mean reversion point where price often returns to rebalance before continuation.
🔹 3. RSI + FVG
RSI below 50 → bearish momentum → bearish FVG reactions are more reliable.
RSI above 50 → bullish momentum → bullish FVG reactions are more reliable.
If RSI rises from oversold (or falls from overbought), it often signals a retracement phase toward nearby FVGs.
🔹 4. Combined Logic (Works for Bullish and Bearish)
Displacement creates an FVG (inefficiency).
Price retraces into the 38–61% Fib zone.
Retracement taps EMA50 or stays on the correct side of EMA50 (below for bearish, above for bullish).
RSI confirms momentum (below 50 for bearish continuation, above 50 for bullish continuation).
Price rejects from the FVG and continues the trend.
⸻⸻⸻⸻⸻⸻⸻⸻⸻⸻
✅ Summary
Market structure remains bearish with consistent LHs and LLs.
A previously filled FVG under the EMA validated the continuation move.
The upper FVG is the highest-strength level due to EMA + Fib + displacement confluence.
A lower FVG exists but carries reduced importance.
RSI below 50 reinforces bearish momentum and reliability of bearish FVG reactions.
⸻⸻⸻⸻⸻⸻⸻⸻⸻⸻
⚠️ Disclaimer
📘 For educational purposes only.
🙅 Not SEBI registered.
❌ Not investment advice.
🧠 Smart-Money-Concepts explanation only.

Nifty Intraday Analysis for 26th November 2025NSE:NIFTY
Index has resistance near 26075 – 26125 range and if index crosses and sustains above this level then may reach near 26275 – 26325 range.
Nifty has immediate support near 25725 – 25675 range and if this support is broken then index may tank near 25525 – 25475 range.

Banknifty Intraday Analysis for 26th November 2025NSE:BANKNIFTY
Index has resistance near 59250 – 59350 range and if index crosses and sustains above this level then may reach near 59750 – 59850 range.
Banknifty has immediate support near 58450 - 58350 range and if this support is broken then index may tank near 57950 - 57850 range.