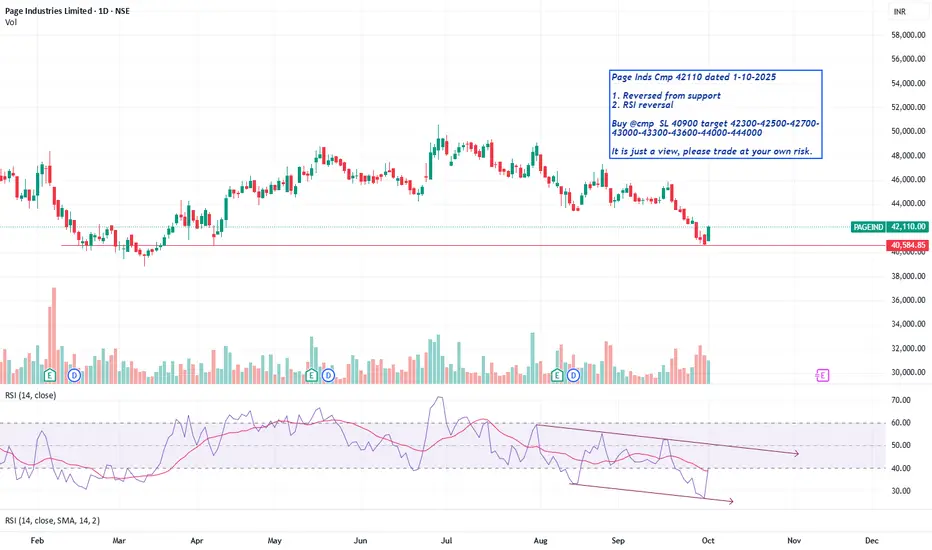
Page Inds Cmp 42110 Reversed from supportPage Inds Cmp 42110 dated 1-10-2025
1. Reversed from support
2. RSI reversal
Buy @cmp SL 40900 target 42300-42500-42700-
43000-43300-43600-44000-444000
It is just a view, please trade at your own risk.
Support and Resistance
AU Bank Ltd 720 Triangle BOAU Bank Ltd 720 dated 18-9-2025
1. Triangle BO @ 722
Buy above 722 SL 700 target 728-735-
740-745-750-755-760
It is just a view, please trade at your own risk.

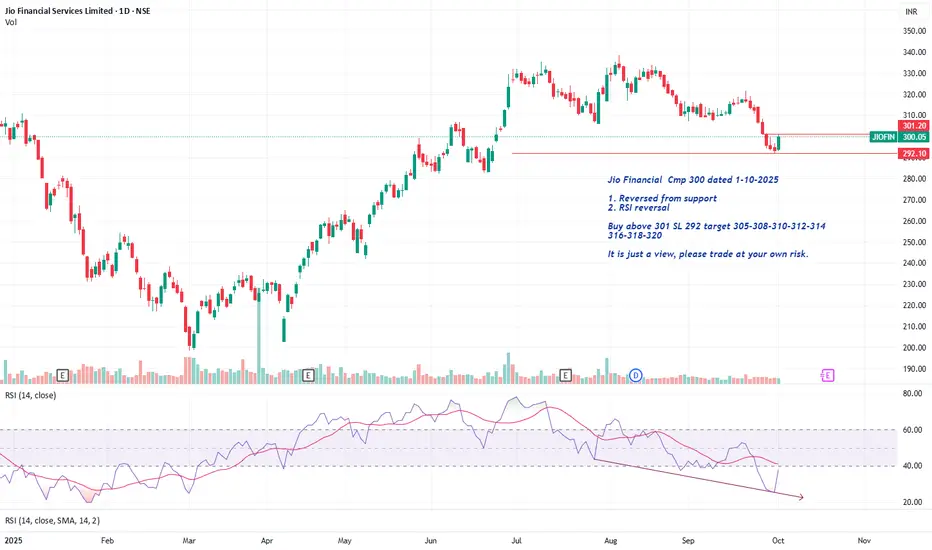
Jio Financial Cmp 300 Reversed from supportJio Financial Cmp 300 dated 1-10-2025
1. Reversed from support
2. RSI reversal
Buy above 301 SL 292 target 305-308-310-312-314
316-318-320
It is just a view, please trade at your own risk.
XAUUSUS | Government Shutdown Confirmed | Gold awaits ADP & ISM🔎 Context & News
US Politics : The US government officially shut down after the Senate failed to pass the federal funding bill. A major political risk catalyst, triggering safe-haven flows into Gold.
FED : Probability of a -25bps rate cut in October rises to 96.2% → almost certain.
Key Events Today (ET / UTC) :
• ADP Employment Change: 08:15 ET / 12:15 UTC
• ISM Manufacturing PMI: 10:00 ET / 14:00 UTC
→ Both will be crucial data points that may shake Dollar and Gold.
📌 Summary : US politics + FED easing = Gold remains supported, but ADP & ISM tonight could spark strong volatility in the US session.
📈 Technical Analysis (H1)
Main Trend : Bullish after multiple BoS.
EMA : EMA 34 > EMA 89 → bullish momentum intact.
Resistance :
3,897 – 3,907 (Sell scalp – Fibo 0.5–0.618).
3,920 – 3,921 (Liquidity / ATH test).
Support :
3,872 – 3,876 (old high retest).
3,833 – 3,841 (OB zone).
3,814 – 3,822 (deep Support Zone – losing this shifts bias).
🎯 Trade Plan
✅ Buy (trend priority)
Buy Zone 1 : 3,872 – 3,876
• SL: 3,869
• TP: 3,897 → 3,907 → 3,920
Buy Zone 2 (OB) : 3,833 – 3,841
• SL: 3,826
• TP: 3,872 → 3,897 → 3,907
Buy Zone 3 (Deep Support) : 3,814 – 3,822
• SL: 3,808
• TP: 3,841 → 3,872 → 3,897
⚡ Sell (short scalps only – lower RR)
Sell Zone 1 : 3,897 – 3,907
• SL: 3,912
• TP: 3,885 → 3,876 → 3,841
Sell Zone 2 (ATH sweep) : 3,920 – 3,921
• SL: 3,925
• TP: 3,907 → 3,885 → 3,876
📝 Conclusion
Gold remains strongly supported by the US government shutdown + FED rate cut expectations.
Strategy today: Prioritize Buy at support; Sell only for short scalps around 3,907 – 3,921.
⚠️ Watch out: ADP & ISM tonight may trigger unexpected volatility → manage risk carefully and move SL to BE after TP1.
📢 If you find this Captain’s Log useful, don’t forget to Follow Captain Vincent ⚓ for the latest updates.
💬 What do you think, crew? Will Gold break ATH 3,920 right after ADP & ISM tonight?

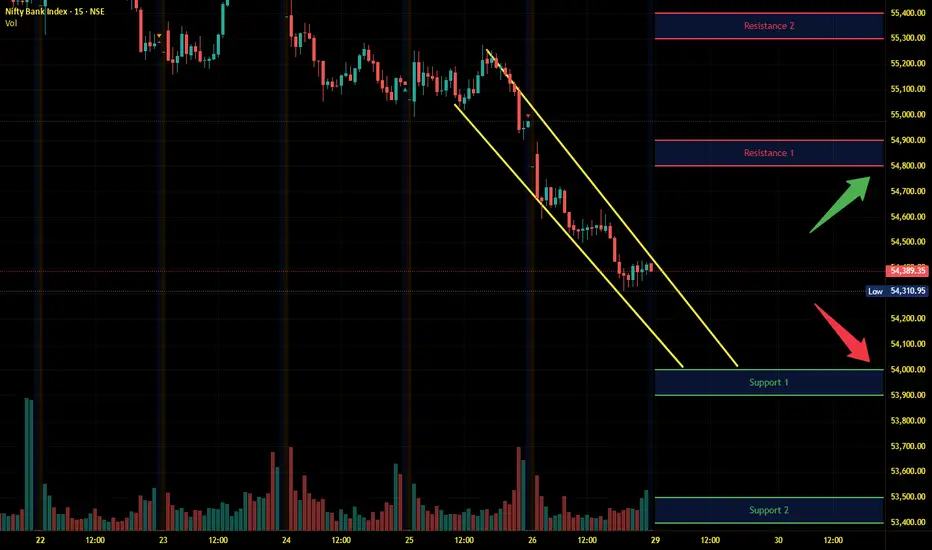
BankNifty looking Bullish.After taking 4HR liquidity from the left side, the price has moved, and today we saw a bullish candle.
we can see very good jump in price after the retesting of 55250 levels.
We have open equal highs, next target can be kept there.

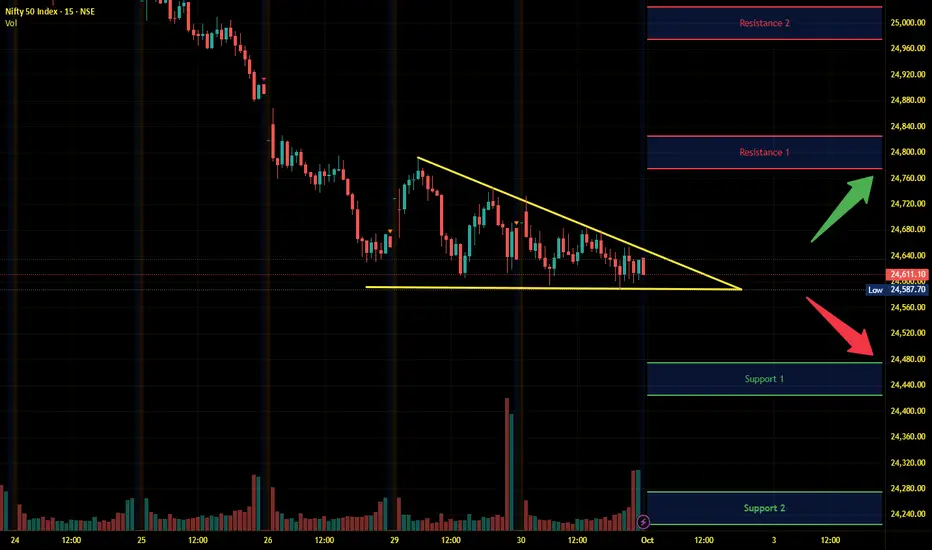
Nifty Intraday Analysis for 01st October 2025NSE:NIFTY
Index has resistance near 24775 – 24825 range and if index crosses and sustains above this level then may reach near 24975 – 25025 range.
Nifty has immediate support near 24475 – 24425 range and if this support is broken then index may tank near 24275 – 24225 range.
Market will react to the RBI MPC outcome, specially on FY 2025-26 economic outlook, inflation etc data.
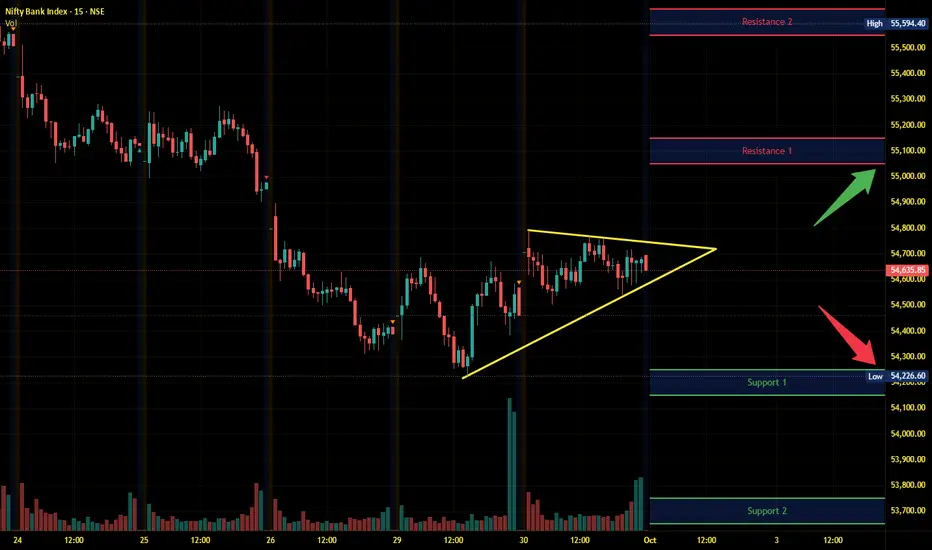
Banknifty Intraday Analysis for 01st October 2025NSE:BANKNIFTY
Index has resistance near 55050 – 55150 range and if index crosses and sustains above this level then may reach near 55550– 55650 range.
Banknifty has immediate support near 54250 - 54150 range and if this support is broken then index may tank near 53750 - 53650 range.
Market will react to the RBI MPC outcome, specially on FY 2025-26 economic outlook, inflation etc data.
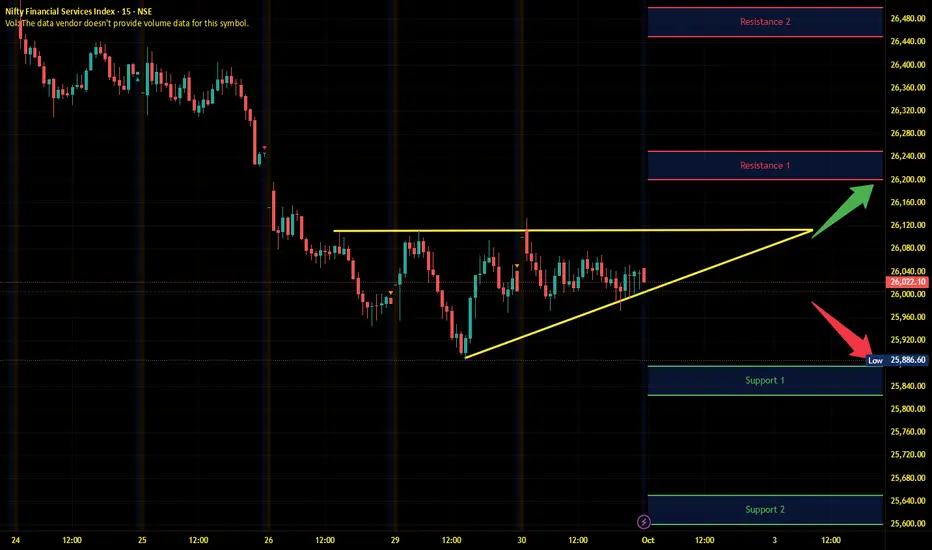
Finnifty Intraday Analysis for 01st October 2025NSE:CNXFINANCE
Index has resistance near 26200 - 26250 range and if index crosses and sustains above this level then may reach near 26450 - 26500 range.
Finnifty has immediate support near 25875 – 25825 range and if this support is broken then index may tank near 25650 – 25600 range.
Market will react to the RBI MPC outcome, specially on FY 2025-26 economic outlook, inflation etc data.
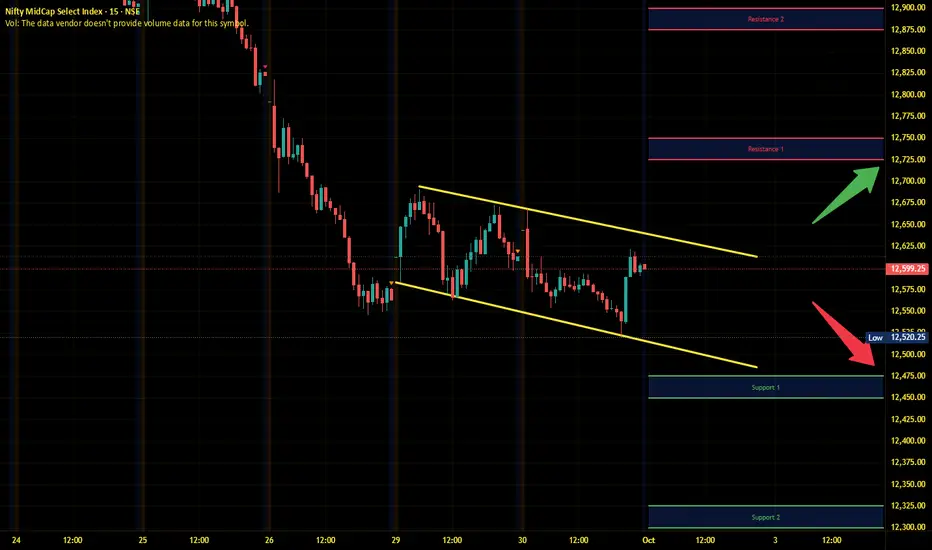
Midnifty Intraday Analysis for 01st October 2025NSE:NIFTY_MID_SELECT
Index has immediate resistance near 12725 – 12750 range and if index crosses and sustains above this level then may reach 12875 – 12900 range.
Midnifty has immediate support near 12475 – 12450 range and if this support is broken then index may tank near 12325 – 12300 range.
Market will react to the RBI MPC outcome, specially on FY 2025-26 economic outlook, inflation etc data.
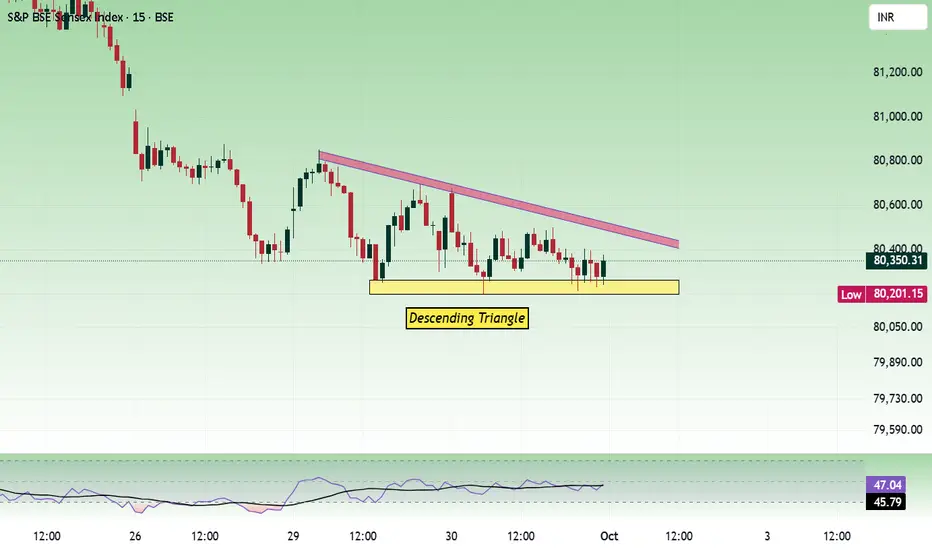
Sensex - Expiry day analysis Oct 1For the past two days, the price has been moving within the range of 80200 to 80800. And today's movement has formed a triangle pattern. Unless the range is broken, the movement can be choppy. Nearby support is seen at 80000. If 80k is broken, the next support is at the 79750 to 79820 zone.
Buy above 80320 with a stop-loss of 80200 for targets of 80400, 80520, 80640, 80760, and 80880.
Sell below 79960 with a stop-loss of 80100 for the targets 79840, 79760, 79640, 79520, 79400, and 79240.
If the price does not gain strength, we can expect a range move between 80k and 80700.
US Government Shutdown, Gold Benefits & FOMO BUY Continues📊 Market Context The gold market kicks off Q4/2025 with great enthusiasm as safe-haven flows continue to surge.
Not only that, the potential delay of the NFP employment report this week further fuels the market's "thirst" for directional information, positioning gold as the central asset in everyone's sights. Meanwhile, the USD is under pressure from political uncertainties and expectations that the Fed is moving closer to further rate cuts.
Combined, the current picture shows that gold is not only maintaining its strength after a breakout rally but also has the opportunity to expand and conquer new high price territories, as safe-haven capital and FOMO momentum from the BUY side continue to amplify.
🔎 Technical Analysis (H1/H4)
The price maintains the main upward trend, staying above the support structure.
Important BUY ZONE: 3833–3831 (Fibo + CP zone) – this area is likely to react strongly.
Secondary BUY ZONE: 3817–3815 (OBS zone) – stronger support, suitable for accumulating additional BUY orders.
Resistance area 3919–3923 (Liquidity Sell Zone) may be where liquidity traps appear.
✅ BUY ZONE 1: 3833–3831
SL: 3827
TP: 3838 - 3842 - 3846 - 3850 - 3855 - 3860 - 3870 - ???
✅ BUY ZONE 2: 3817–3815
SL: 3810
TP: 3822 - 3826 - 3830 - 3835 - 3840 - 3850 - 3860 - 3870 - ???
✅ Summary Gold is directly benefiting from political instability and the delay in US economic data. The main trend remains BUY with safe-haven flows, with strategic zones at 3833–3831 and 3817–3815. The expansion target aims for 3870–3880 and beyond to 3920+ if buying momentum remains strong.

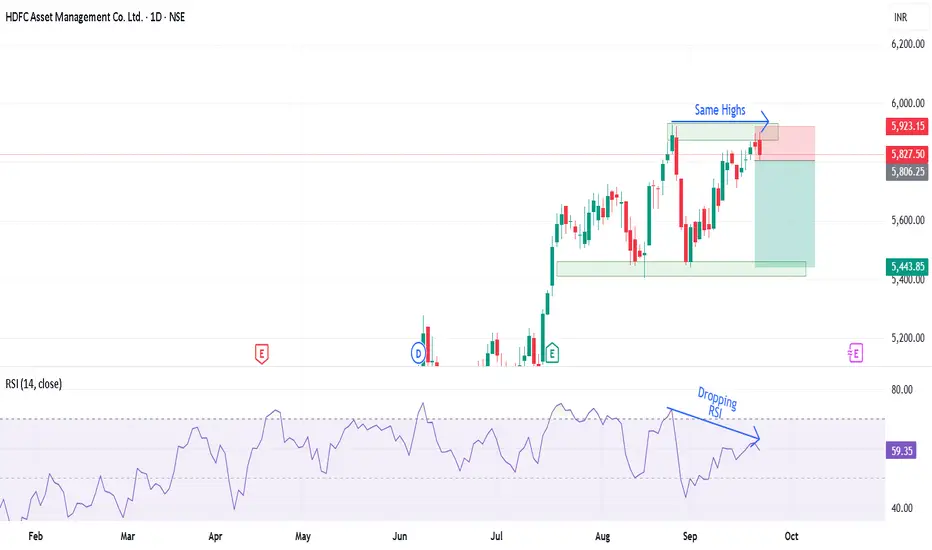
Double Top at the Peak: Is a Bearish Reversal Coming in HDFC AMCHDFC AMC has given a good upside rally of 65% and is form a double top pattern.
The stock is following a bullish trendline but the RSI divergence is creating a bearish sentiment supported by the drop India VIX.
If the stock breaks below the trendline, a bearish trade can be entered with the first target of 5440 following it to 5208.
Bullishness will only be confirmed only once the stock starts trading above 6000 levels.
There is RSI divergence on the higher time frame too and gives more convincing trade in the stock.
Entry :- Below 5809
Target :- 5440 and 5208
Stop Loss :- Close above 5927 (daily charts)
Wait for the price action and trade accordingly.
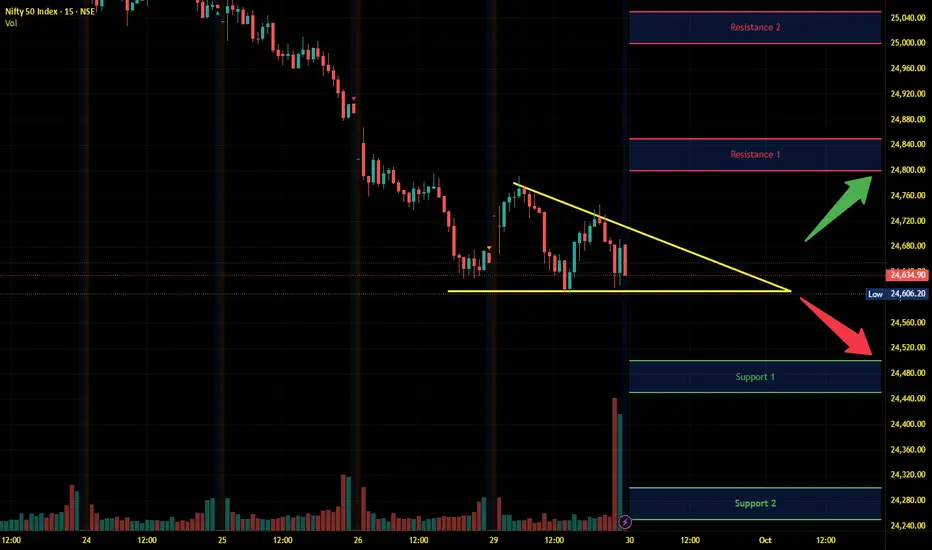
Nifty Intraday Analysis for 30th September 2025NSE:NIFTY
Index has resistance near 24800 – 24850 range and if index crosses and sustains above this level then may reach near 25000 – 25050 range.
Nifty has immediate support near 24500 – 24450 range and if this support is broken then index may tank near 24300 – 24250 range.
The market may move in the direction where unwinding of OI takes place on the Monthly F&O expiry day. Volatility expected.
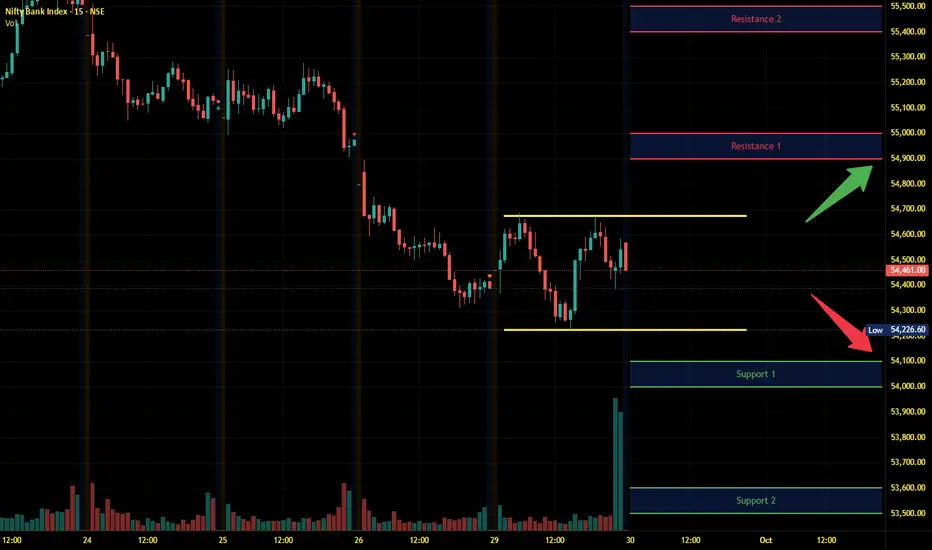
Banknifty Intraday Analysis for 30th September 2025NSE:BANKNIFTY
Index has resistance near 54900 – 55000 range and if index crosses and sustains above this level then may reach near 55400– 55500 range.
Banknifty has immediate support near 54100 - 54000 range and if this support is broken then index may tank near 53600 - 53500 range.
The market may move in the direction where unwinding of OI takes place on the Monthly F&O expiry day. Volatility expected.
Finnifty Intraday Analysis for 30th September 2025NSE:CNXFINANCE
Index has resistance near 26200 - 26250 range and if index crosses and sustains above this level then may reach near 26450 - 26500 range.
Finnifty has immediate support near 25825 – 25775 range and if this support is broken then index may tank near 25575 – 25525 range.
The market may move in the direction where unwinding of OI takes place on the Monthly F&O expiry day. Volatility expected.

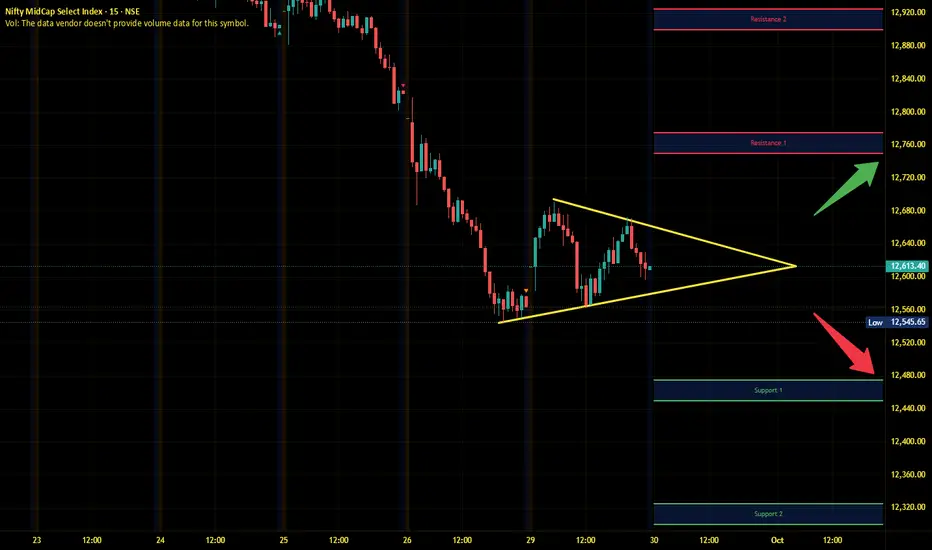
Midnifty Intraday Analysis for 30th September 2025NSE:NIFTY_MID_SELECT
Index has immediate resistance near 12750 – 12775 range and if index crosses and sustains above this level then may reach 12900 – 12925 range.
Midnifty has immediate support near 12475 – 12450 range and if this support is broken then index may tank near 12325 – 12300 range.
The market may move in the direction where unwinding of OI takes place on the Monthly F&O expiry day. Volatility expected.
Gold 30/09 - Safe-haven flows surge | Gold sails toward new ATH 🟡 XAU/USD – 30/09 | Captain Vincent ⚓
🔎 Captain’s Log – Context & News
US Politics : Meeting between Trump and bipartisan leaders ended without agreement → growing risk of a US government shutdown by Wednesday.
Conflict : Democrats demand concessions, Republicans fiercely oppose → wide gap remains, both sides blaming each other.
Market : Investors watch JOLTS data and speeches from 3 FED members, but political risks are the strongest catalyst for Gold.
Trend : Safe-haven flows keep pouring into Gold → increasing likelihood of testing new ATH.
⏩ Captain’s Summary : US political seas are stormy, Gold becomes the fortress of safety. The voyage toward ATH is widening.
📈 Captain’s Chart – Technical Analysis (H1)
EMA : EMA 34 (yellow) > EMA 89 (red) → bullish trend clearly dominant.
Golden Harbor (Support / Buy Zone)
Big Volume Dock: 3,827
Storm Breaker (Resistance / Sell Zone)
ATH test: 3,916 – 3,917
Market Structure : Gold broke out strongly, now trading around 3,870. Main trend remains bullish, with 3,842 – 3,827 as key anchor zones.
🎯 Captain’s Map – Trade Plan
✅ Buy (main priority)
Buy Zone 2 – Big Volume
Entry: 3,827 – 3,824
SL: 3,815
TP: 3,870 – 3,899 – 3,916
⚡ Sell (short scalp – high risk)
Sell Zone – ATH test
Entry: 3,917 – 3,920
SL: 3,925
TP: 3,899 – 3,870 – 3,856
⚓ Captain’s Note
“The Golden sails are filled by safe-haven winds, pushing the ship close to ATH. Golden Harbor 🏝️ (3,842 – 3,827) is the ideal dock for sailors to position Buys. Storm Breaker 🌊 (3,916 – 3,920) may unleash violent waves, suitable only for short Quick Boarding 🚤 scalps. If the political storm from Washington breaks out, Gold’s voyage could surpass the peak and expand its horizon.”
📢 If you find the Captain’s Log useful, don’t forget to Follow for the earliest updates.
💬 What’s your view, crew? Will Gold conquer ATH around 3,917 this week?

H1 bullish momentum intact | Buy 3,792–3,765, target 3,821🟡 XAU/USD – 29/09/2025 | Captain Vincent ⚓
🔎 Captain’s Log – Structure & Trend
H1 continues to print consecutive BoS → bullish trend sustained.
Price broke the long-term downtrend line and surged to new highs.
EMA 34 & EMA 89 both pointing up and below price → confirming short-to-mid-term bullish momentum.
📈 Captain’s Chart – Key Zones
Storm Breaker (Sell Zone / ATH test) : 3,818 – 3,821
Golden Harbor (FVG – Buy Zone) : 3,792 – 3,779
OB Harbor 1 : 3,772 – 3,765
OB Harbor 2 (deeper) : 3,731 – 3,724
Core Idea: 3,792 – 3,765 is the main support “cushion” for trend-follow Buys; 3,818 – 3,821 is the wave edge where profit-taking may occur.
🎯 Captain’s Map – Trade Plan
✅ Golden Harbor (BUY – main priority)
Buy Zone 1 – FVG (3,792 – 3,779)
Entry: 3,792 – 3,779
SL: 3,765
TP: 3,805 – 3,818 – 3,821+
Buy Zone 2 – OB1 (3,772 – 3,765)
Entry: 3,772 – 3,765
SL: 3,758 (below 3,765)
TP: 3,792 – 3,805 – 3,818 – 3,821
Buy Zone 3 – OB2 deep (3,731 – 3,724)
Entry: 3,731 – 3,724
SL: 3,714
TP: 3,745 – 3,765 – 3,792 – 3,805
⚡ Quick Boarding (SELL – scalp only)
Sell Zone – Storm Breaker (3,818 – 3,821)
Entry: 3,818 – 3,821
SL: 3,828
TP: 3,805 – 3,796 – 3,792
Breakdown Short (conditional)
Only consider Short if H1 closes below 3,724
SL: 3,735
TP: 3,710 – 3,700 – 3,690
⚓ Captain’s Note
“The Golden sails remain filled after consecutive BoS . Golden Harbor 🏝️ (3,792 → 3,765) is the anchor dock to board in trend’s direction. Storm Breaker 🌊 (3,818 – 3,821) may trigger profit-taking waves – only go Quick Boarding 🚤 if clear signals appear. If the tide drags below 3,724, let the ship retreat to OB2 to gather strength before resuming the northbound voyage.”

Neowave Forecast| Gold|Bitcoin|Nifty|Bank Nifty|30/09/2025If you have any doubts related to your stocks and portfolio, ask in the comments we will provide you Neowave Chart for that.
Discussed Instruments
#Gold
#Bitcoin
#Nifty
#Bank Nifty
Yesterday Video-

TCS – Bearish Outlook Intact, But a Wave B Bounce in Play?Chart Structure (Weekly)
TCS has been locked in a corrective decline since the 4592.25 peak. The latest fall into the historical support cluster (near 3056–2890) completed a five-wave structure within wave A. From here, a bounce toward wave B is possible, with resistance around 3350–3600.
Bullish trigger: RSI shows a bullish divergence (price made a lower low, RSI made a higher low).
Upside potential: A move towards the 3350 resistance zone.
Downside risk: If support fails, the next major level sits near 2292 — aligning with a larger wave C.
So the long-term outlook remains bearish, but a short-term bounce looks probable.
Fundamental Headwind
Adding to the technical picture, the looming H1-B visa fee hike is a structural negative for Indian IT companies. TCS, Infosys, and peers with heavy US revenue exposure could see margin pressure in the quarters ahead. This reinforces the larger bearish bias, making any bounce counter-trend in nature.
Illustrative Option Play – Bull Call Spread
For those looking to play the short-term bounce while limiting risk, one way is to structure a bull call spread:
Buy 3000 CE (Oct Expiry) at ₹42.1
Sell 3040 CE (Oct Expiry) at ₹31.25
Lot size: 175
Net Cost: ₹1,899
Max Profit: ₹5,101 (~26%)
Max Loss: ₹1,899 (~10%)
Breakeven: 3011(4%)
Reward/Risk: 2.7
(Note: Prices are as of EoB 29th September 2025. This is only an example to demonstrate risk-managed structures. Not a trade recommendation.)
Summary
Long-term: Bearish, with risk of a wave C drop toward 2292.
Short-term: Bounce into wave B likely, targeting 3350–3600.
Strategy: A bull call spread provides a clean, limited-risk way to play this bounce, while respecting the larger bearish setup.
Disclaimer: This analysis is for educational purposes only and does not constitute investment advice. Please do your own research (DYOR) before making any trading decisions.

INDIAN HOTELS🎯 TRADING PLAN 🎯
✔ Price Action shows strong support
At the trend line with a Bullish Harami
Candlestick Pattern.
✔ RSI being Oversold adds weight to the
Setup.

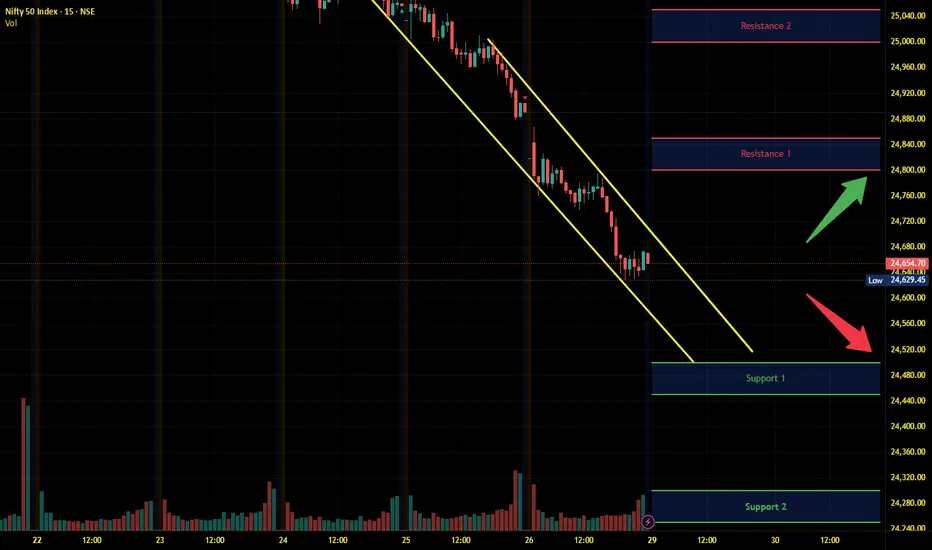
Nifty Intraday Analysis for 29th September 2025NSE:NIFTY
Index has resistance near 24800 – 24850 range and if index crosses and sustains above this level then may reach near 25000 – 25050 range.
Nifty has immediate support near 24500 – 24450 range and if this support is broken then index may tank near 24300 – 24250 range.
Oversold zone, bounce back expected with profit booking on high zone as F&O expiry is nearing.
Banknifty Intraday Analysis for 29th September 2025NSE:BANKNIFTY
Index has resistance near 54800 – 54900 range and if index crosses and sustains above this level then may reach near 55300– 55400 range.
Banknifty has immediate support near 55000 - 54900 range and if this support is broken then index may tank near 53500 - 53400 range.
Oversold zone, bounce back expected with profit booking on high zone as F&O expiry is nearing.