Midnifty Intraday Analysis for 26th September 2025NSE:NIFTY_MID_SELECT
Index has immediate resistance near 12950 – 12975 range and if index crosses and sustains above this level then may reach 13100 – 13125 range.
Midnifty has immediate support near 12700 – 12675 range and if this support is broken then index may tank near 12550 – 12525 range.
Support and Resistance

XAUUSD – Trading Plan: Gold Awaits PCE Catalyst📊 Market Context
Gold remains in consolidation mode after a sharp run earlier this week, holding steady below 3750. The market is now laser-focused on the US Core PCE Index, which could provide fresh direction for both the dollar and precious metals. With US yields stabilising and risk sentiment shifting, gold’s safe-haven appeal remains intact — but traders are weighing whether the recent pullback is a healthy correction or the start of a deeper retracement.
Meanwhile, the geopolitical backdrop continues to offer underlying support, while positioning in ETFs and futures suggests investors are cautious, awaiting clearer signals from the Fed. The upcoming data will likely decide whether gold breaks higher towards fresh highs or retests deeper liquidity zones.
🔎 Technical Analysis (H1/H4)
Price capped near short-term resistance at 3770–3772.
Immediate supports are 3741 and 3722, with deeper demand zones at 3690–3688 and 3670–3668.
The structure indicates possible liquidity sweeps before a decisive move.
🔑 Key Levels
Resistance / Sell Zone: 3770–3772
Support / Buy Zones: 3690–3688, 3670–3668
📈 Scenarios & Trading Plan
BUY ZONE 1: 3690–3688
SL: 3684
TP: 3695 - 3700 - 3710 - 3720 - 3730 - ???
BUY ZONE 2: 3670–3668
SL: 3664
TP: 3675 - 3680 - 3690 - 3700 - 3710 - ???
SELL ZONE: 3770–3772
SL: 3777
TP: 3765 - 3760 - 3750 - 3740 - ???
⚠️ Risk Notes
Watch for false breakouts at 3770–3772 before reversal.
PCE release may inject volatility across gold and USD pairs.
Position sizing and risk control are crucial into data.
✅ Summary
Gold is at a crossroads — safe-haven demand is still supportive, but technical resistance near 3770 remains a hurdle. Core strategy: buy dips into 3690–3670 zones, while staying cautious of short-term sell setups at 3770–3772. Manage exposure, wait for confirmation, and be prepared for volatility once PCE data hits.
📢 Follow MMFLOW TRADING for real-time updates and next-level trade setups.

Gold outlookYou can see in chart that there is a pattern formation. Gold can give a sell side entry. Wait for it.

Gold under EMA pressure Buy at support,short scalp at resistance🟡 XAU/USD – Captain Vincent ⚓
🔎 Captain’s Log – Context & News
FED : Probability of a 25bps cut in October is 91.09% → almost certain.
US Calendar today : GDP, Jobless Claims, Durable Goods Orders, and especially speeches from 3 FED officials → strong volatility expected.
Gold yesterday : Dropped deeply but reacted precisely at key support → according to Vincent, this sell-off was mainly due to investors being cautious ahead of tomorrow’s CPI data.
⏩ Captain’s Summary : Short-term waves are pressured by EMAs, but the bigger voyage remains bullish – sailors prioritize Buy at Golden Harbor, only Quick Boarding 🚤 when facing Storm Breaker.
📈 Captain’s Chart – Technical Analysis (H30, EMA 34 & EMA 89)
EMA : EMA 34 (yellow) crossing below EMA 89 (red) → short-term bearish signal.
Trend : Overall still bullish, with Bullish OBs and Buy Zones below acting as strong supports.
Storm Breaker (Resistance / Sell Zone)
3,769 – 3,777 (Bearish OB)
Golden Harbor (Support / Buy Zone)
3,734 – 3,718 (Bullish OB)
3,687 – 3,685 (Buy Zone OB)
3,650 – 3,648 (Deeper Buy Zone, confluence with EMA 89)
🎯 Captain’s Map – Trade Plan
⚡ Sell (short-term scalp)
Entry: 3,776 – 3,773
SL: 3,783
TP: 3,770 – 3,765 – 3,760 – 3,755 – 3,750
✅ Buy (main priority)
Buy Zone 1 (OB)
Entry: 3,687 – 3,685
SL: 3,678
TP: 3,700 – 3,705 – 3,710 – 3,715 – 3,720
Buy Zone 2 (Deeper OB)
Entry: 3,650 – 3,648
SL: 3,638
TP: 3,665 – 3,670 – 3,675 – 3,680 – 3,685
⚓ Captain’s Note
“The Golden sails are facing headwinds from short-term EMAs, but Golden Harbor 🏝️ (3,734 – 3,650) remains a solid support dock. Storm Breaker 🌊 (3,769 – 3,777) is only suitable for short Quick Boarding 🚤 scalps. Tonight, the US sea will bring big waves from data & FED speeches – sailors, tighten your sails and manage trades with discipline.”
📢 If you find Captain’s Log useful, don’t forget to Follow for the latest updates.
💬 Do you have a different view on Gold? Drop a comment and join the crew discussion!

Gold Neowave Stuctural UpdateNamaskaram Everyone
Welcome to intelligent investor, we provide market insights by synchronising and combining all the price action waves from different time frames and gives you single trend.
How To Read My Charts...Click Below
FX:XAUUSD FX:XAUUSD OANDA:XAUUSD MCX:GOLD1!

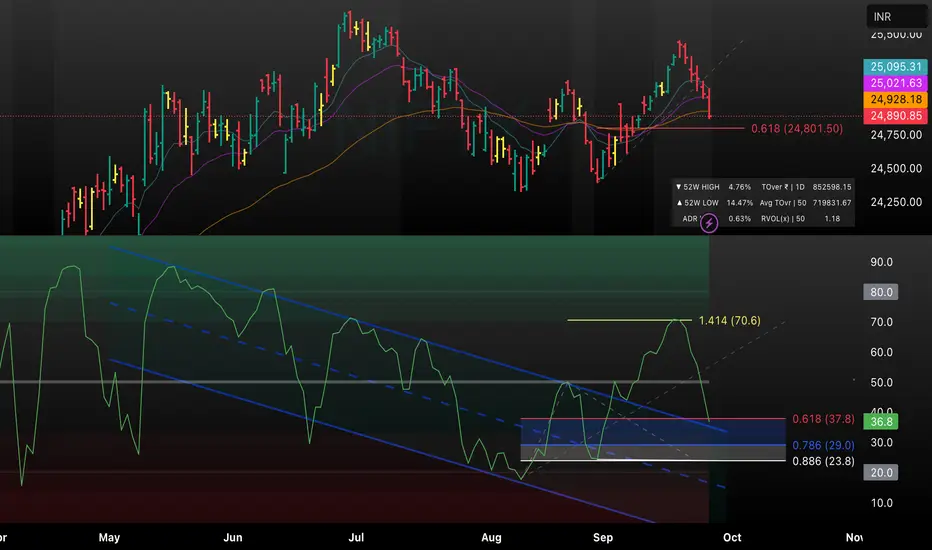
Will Fibonacci Levels Hold? Key Areas to WatchThis chart combines price action with key Fibonacci retracement and extension levels to anticipate potential support or reversal zones. Price is currently testing the crucial 0.618 retracement (24,801.50) after a notable downward move. RSI is also reacting near its own significant levels, aligning with both 0.618 on the downside (37.8) and the 1.414 extension (70.6) on the upside. Watch for reactions at these levels for clues on whether price will bounce or continue to the next fib zone, especially with momentum indicators confirming support/resistance confluence.
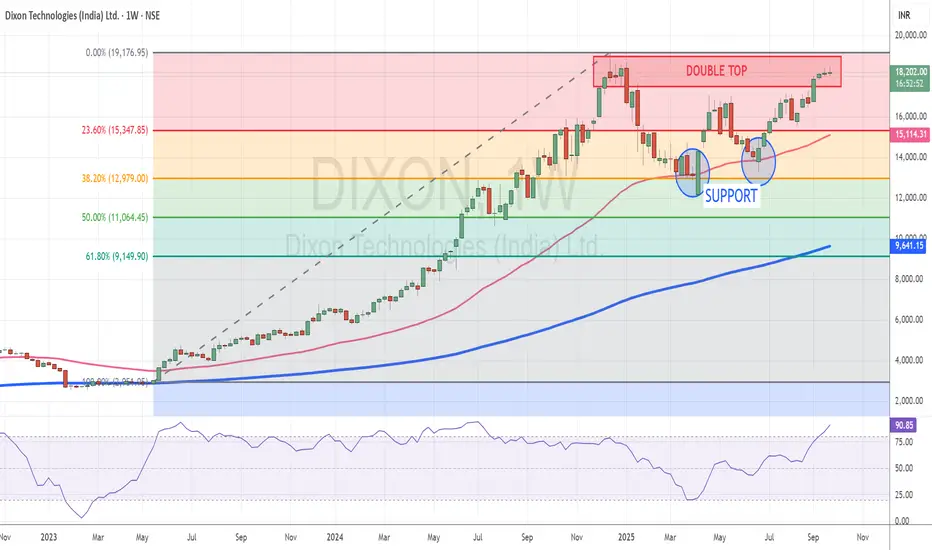
Dixon nears lifetime high after sharp recoveryTopic Statement:
Dixon has rebounded strongly in line with the broader market rally but now approaches critical resistance levels that may cap further upside.
Key Points:
1. The stock retraced to the 38.2% Fibonacci level where it found strong support and resumed its upward move
2. The 50-day EMA acted as a deflection point, offering additional support during the recovery
3. Price is now at its lifetime high near the 18,000 mark, where a double top candlestick pattern is forming
4. The double top indicates significant resistance, making it a potential shorting opportunity unless a breakout confirms further bullishness
Bank Nifty Neowave UpdateNamaskaram Everyone
Welcome to intelligent investor, we provide market insights by synchronising and combining all the price action waves from different time frames and gives you single trend.

Tcs 52 week low - Today creates a new and fresh 52 week low
- Also breaks 5 Years important support
- expecting this fall may continue
- Next important support 2600 and 2200
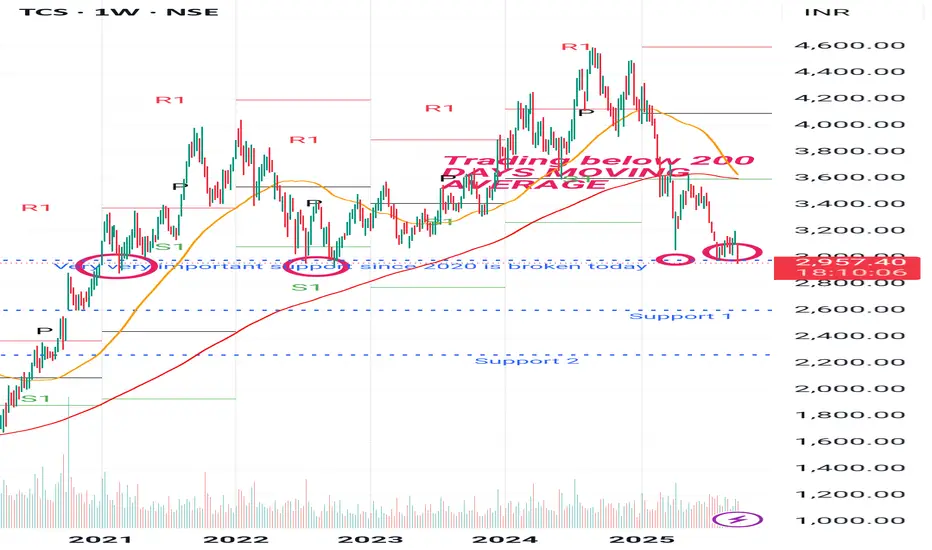
Tcs 52 week low - Trading below 200days moving average
- today breaks 5 years of strong support level 2950
- expecting this fall may continue
- Next support 2600 and 2200
USDJPY (Neowave Trading Idea)FX:USDJPY Namaskaram Everyone
Welcome to intelligent investor, we provide market insights by synchronising and combining all the price action waves from different time frames and gives you single trend.
Now Risk Reward is highly favourable
Trading with risk management, that is 1 percent rule with my charts.
How to Read My Charts-

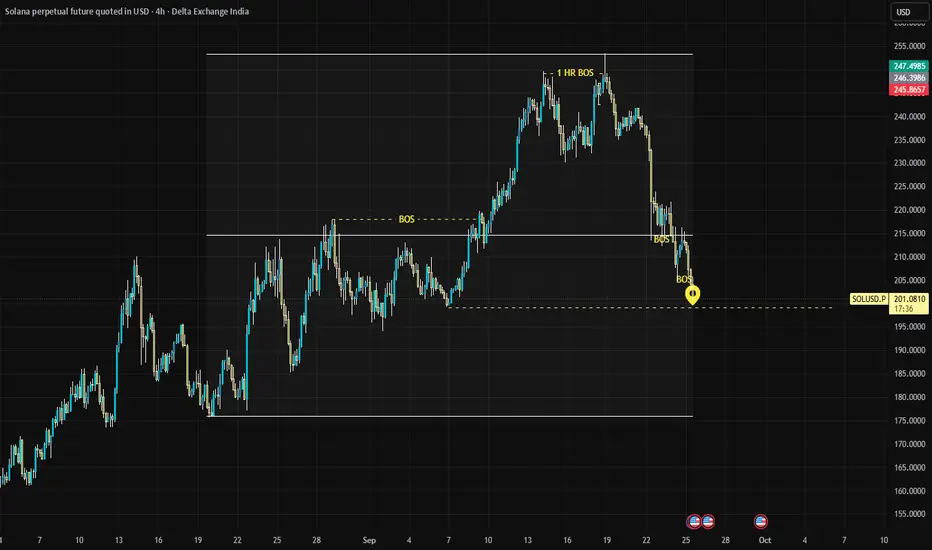
On reversal in 1hr and in 4hr GO LONG in SOLANA199.2162 looks like a good level from where a smaller time frame reversal is expected.
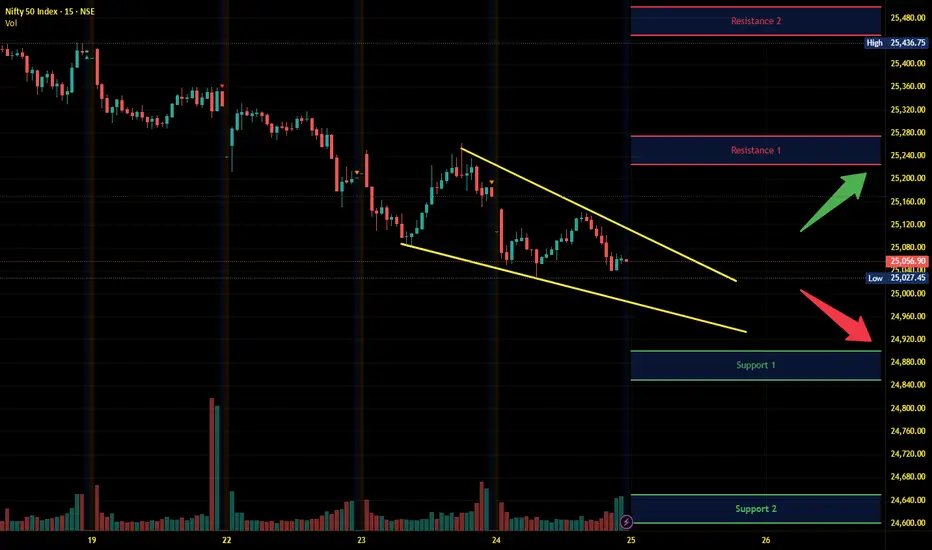
NIFTY50 - Long setup , 2hr TFIn the last three trading sessions, Nifty corrected 300 points from 25450 to 25150 . Support is now at 25150 , Change in polarity. What was previously resistance will now act as support.
Key Levels to Watch:
Immediate support at 25150.
Further Upside target around 25450.
Trade Plan:
Enter long above 15 min bullish candle close.
Stop loss 25100 to limit risk.
Target 25450 for conservative exit or trail stop as price moves Higher.
Disclaimer: Risk management is crucial in this volatile market, so keep position sizing appropriate. This analysis is intended for educational purposes and not financial advice.

Nifty Intraday Analysis for 25th September 2025NSE:NIFTY
Index has resistance near 25225 – 25275 range and if index crosses and sustains above this level then may reach near 25450 – 25500 range.
Nifty has immediate support near 24900 – 24850 range and if this support is broken then index may tank near 24650 – 24600 range.
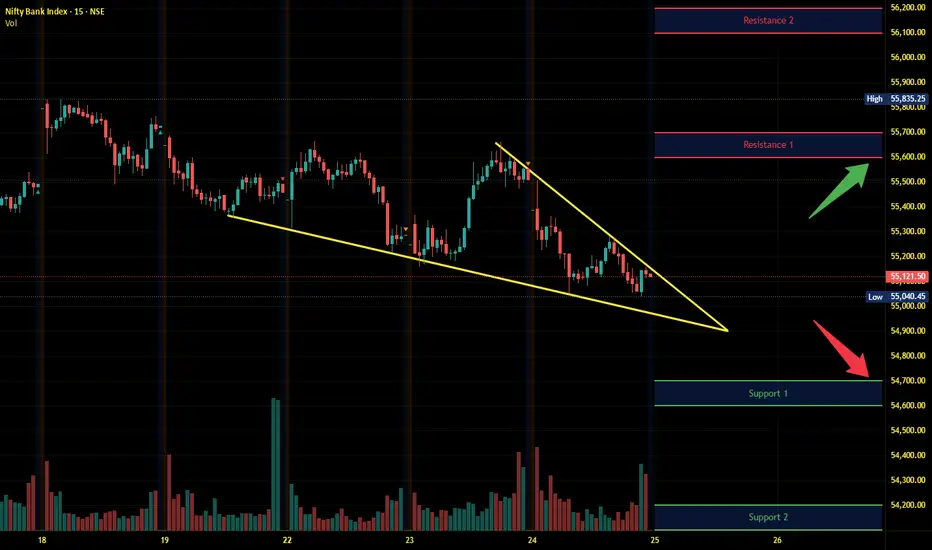
Banknifty Intraday Analysis for 25th September 2025NSE:BANKNIFTY
Index has resistance near 55600 – 55700 range and if index crosses and sustains above this level then may reach near 56100– 56200 range.
Banknifty has immediate support near 54700 - 54600 range and if this support is broken then index may tank near 54200 - 54100 range.
Finnifty Intraday Analysis for 25th September 2025NSE:CNXFINANCE
Index has resistance near 26550 - 26600 range and if index crosses and sustains above this level then may reach near 26750 - 26800 range.
Finnifty has immediate support near 26200 – 26150 range and if this support is broken then index may tank near 26000 – 25950 range.

Midnifty Intraday Analysis for 25th September 2025NSE:NIFTY_MID_SELECT
Index has immediate resistance near 13050 – 13075 range and if index crosses and sustains above this level then may reach 13225 – 13250 range.
Midnifty has immediate support near 12775 – 12750 range and if this support is broken then index may tank near 12650 – 12625 range.

Hindustan Copper – Breakout or Double Top?After completing an impulse up to 287.65 (Wave 1) and correcting down to 226.70 (Wave 2), Hindustan Copper is now powering higher in what looks like Wave (iii) of 3.
Wave count : Wave 2 bottomed at 226.70, setting the stage for Wave 3.
Current move : Sub-waves (i) and (ii) are done, and price is pressing into resistance at 287.
Breakout zone : A decisive move above 287 could confirm the Wave 3 extension. Failure here risks a pause or even a double top.
Retracement supports : 272.75 (0.236) and 263.95 (0.382) are likely pullback zones if Wave (iv) comes into play.
Momentum check : Volume has spiked aggressively, adding weight to the bullish case, while RSI is overbought — suggesting short-term cooling is natural.
Summary : 287 is the key make-or-break zone. Break it cleanly, and Wave 3 marches forward. Fail, and we may see a corrective detour first.
Disclaimer: This analysis is for educational purposes only and does not constitute investment advice. Please do your own research (DYOR) before making any trading decisions.

Sensex - Monthly Expiry Day Analysis Sep 25Today's price moved within the range of 81600 to 82050. And also, the price is below the trend line resistance. Price has to break this range to give a trending move. Otherwise, the movement can be choppy.
Buy above 82080 with the stop loss of 81900 for the targets 82200, 82340, 82400, 82560, 82700, 82820, and 82980.
Sell below 81800 with the stop loss of 81920 for the targets 81680, 81540, 81420, 81300, 81180, and 81060.
Expected expiry day range is 81400 to 82200.
Always do your analysis before taking any trade.

XAUUSD: 25/09/25 - TP HITMarket is side ways in Asian session
1hr, 4 hr no clarity in direction ,( In such cases look for rejections in lower TF,
We have candle rejections in 30 min at down side , probability of price moving upside in more )
Anticipated upside move during London session
Entered during pullback , once candle broke the resistance

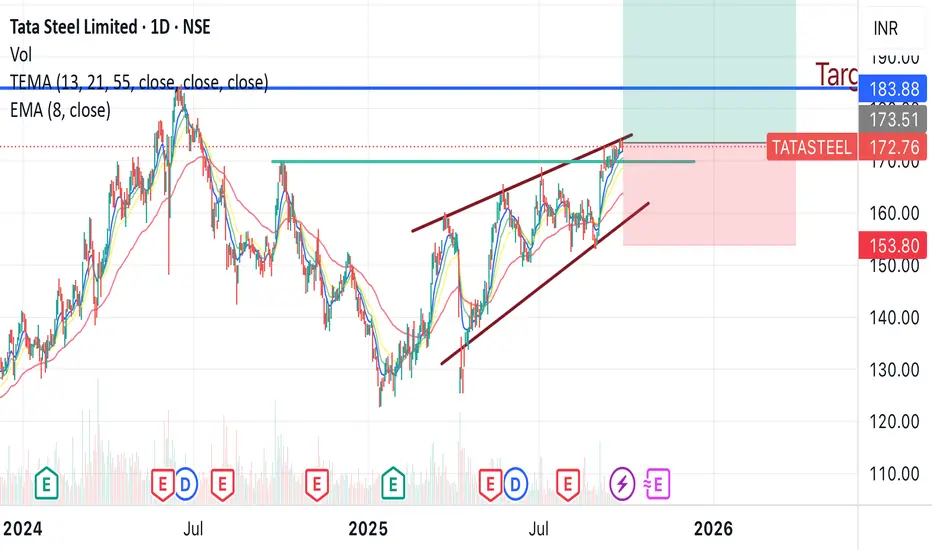
Tata Steel trend line and 1 year resistance breakout Tata steel is gonna give a breakout soon, as it has been in a continuous up trend, reaching 1 year resistance and broken it, it can give from 10-20 % profit from here in short term .
Buy around - 172- 173
Target - 207
Duration - 2-3 months
Gold shakes violently | Priority Buy on dip to support🟡 XAU/USD – 24/09 | Captain Vincent ⚓
🔎 Captain’s Log – Context & News
Geopolitics : Trump unexpectedly supported Ukraine reclaiming full territory and called on NATO to be tougher on Russia → defensive sentiment returned, supporting Gold.
US Economy : Housing data due today, no FED speeches.
Earlier: Weak US PMI + dovish FED tone → no momentum for a prolonged downtrend.
Price Action : Gold dropped more than 20 points overnight, then quickly rebounded to 3,76x → likely profit-taking pressure at higher levels.
⏩ Captain’s Summary : Main trend stays bullish, but the voyage will remain choppy as Gold absorbs profit-taking near resistance.
📈 Captain’s Chart – Technical Analysis (H45)
Golden Harbor (Support / Buy Zone)
Buy Scalp OB: 3,754 – 3,757
OB Harbor: 3,741 – 3,744
Storm Breaker (Resistance / Sell Zone)
Sell Scalp Zone: 3,797 – 3,800
Higher Sell Zone: 3,813 – 3,815
Market Structure
After the deep drop, Gold rebounded and held above 3,76x.
Bullish trend remains intact, but waves of volatility may occur near higher resistance zones.
🎯 Captain’s Map – Trade Plan
✅ Buy (priority)
Buy Scalp OB
Entry: 3,754 – 3,757
SL: 3,747
TP: 3,762 – 3,767 – 3,772 – 3,777 – 3,782
Buy Zone OB
Entry: 3,741 – 3,744
SL: 3,732
TP: 3,749 – 3,754 – 3,759 – 3,764 – 3,769
⚡ Sell (short scalp – lower RR)
Sell Scalp Zone
Entry: 3,797 – 3,800
SL: 3,806
TP: 3,795 – 3,790 – 3,785 – 3,780 – 3,775
Higher Sell Zone
Entry: 3,813 – 3,815
SL: 3,823
TP: 3,810 – 3,805 – 3,800 – 3,795 – 3,790
⚓ Captain’s Note
“The Golden ship rocked violently overnight but still anchored firmly at Golden Harbor 🏝️ (3,754 – 3,741) . Profit-taking waves may still rise at Storm Breaker 🌊 (3,797 – 3,815) , suitable for short Quick Boarding 🚤 scalps. Yet the main voyage continues north – Buy the Dip remains the compass to follow the strong winds.”
📢 If you find the Captain’s Log useful, don’t forget to Follow for the latest signals.
💬 Got your own view on Gold? Share it in the comments and join the crew discussion!

BTCUSD Analysis on (24/09/2025)BTCUSD UPDATEDE
Current price- 113700
If price stay above 111000,then next target 115000,117000 and below that 109000
Plan; if price break 113500-112500 area and above that 113500 area,we will place buy oder in BTCUSD with target of 115000,117000 & stop loss should be placed at 111000
