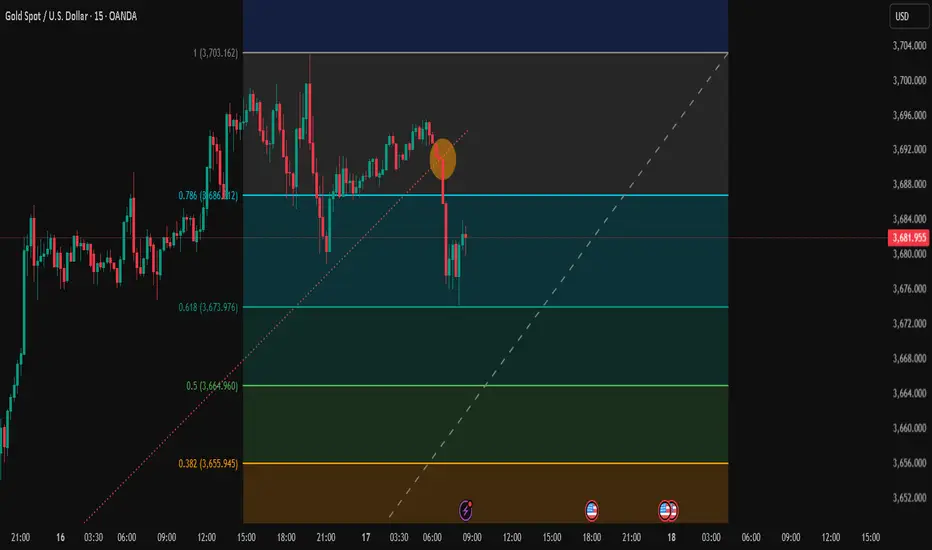
XAUUSD - 18/09/2025 - Tp Hit 1. Price broke support during London session
2. Expected price to retrace ( pullback ) during Pre NY
3. Resistance confirmed during Ny session
4. once price broke the newly formed support and closed below it ,
expected fall
5. NYSE open volume push happened
Support and Resistance

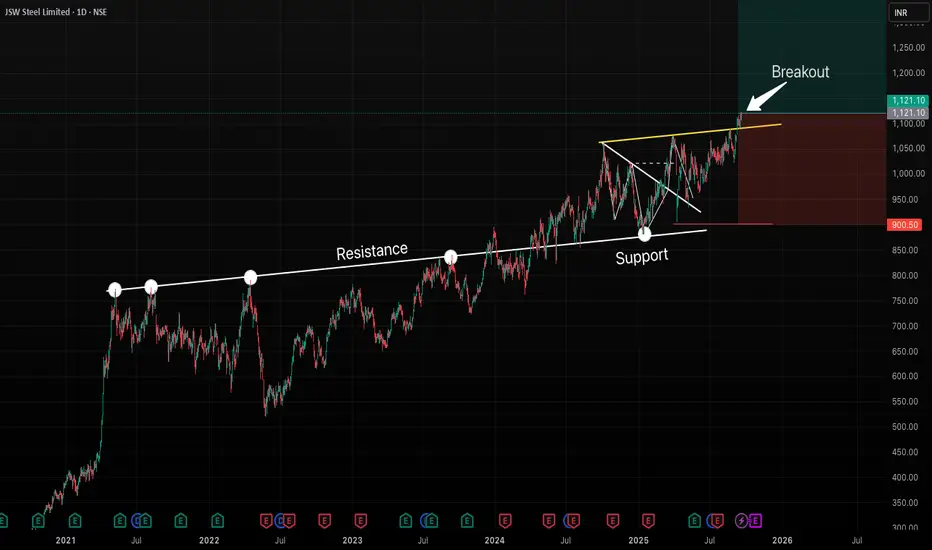
JSWSTEEL - Major Breakout After Long ConsolidationFrom May 2021 to April 2024, JSW Steel consistently faced resistance from the same trendline, rejecting multiple times.
In April 2024, price finally broke out above this resistance zone. After the breakout, the stock came down for a pullback and perfectly respected the same line, which has now flipped into support.
During this pullback, a minor downtrend was visible, but that too has been broken to the upside, showing a clear shift in momentum.
Now, the stock has given a strong breakout again (as shown in the chart). This indicates that the consolidation phase is over and it's going to give a very good rally in coming weeks/months.
Conclusion:
This looks like a good buying opportunity, both for swing trading and long-term investment, as the price action suggests strength and continuation on the upside.
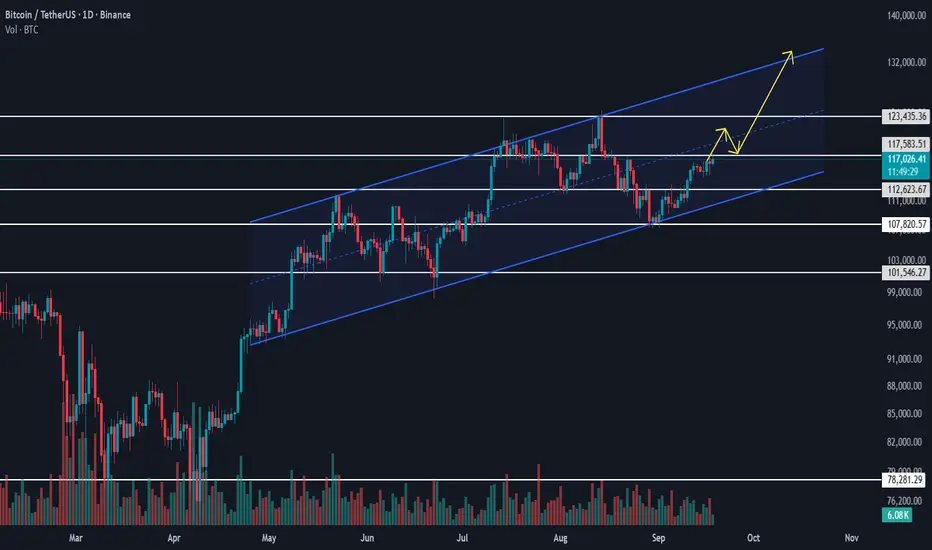
BTCUSDT Analysis – Channel Breakout in FocusBitcoin is currently moving inside an upward channel, where the $107,820.57 level acted as strong support. This level also aligned with the lower trendline of the channel, and price reacted well to it, triggering the latest bullish move.
At present, BTC is facing a critical resistance at $117,583.51, which serves as a potential long trigger. A breakout above this level could accelerate the upside momentum.
Given the expectation of a potential interest rate cut by the Federal Reserve, the crypto market could gain further bullish momentum.
Our main bullish confirmation remains a breakout of $123,435.36, which would validate the continuation of the macro bullish wave count. However, it is preferable to secure entry before price reaches that level in order to optimize risk-to-reward.
📌 Trading Plan: Watch $117,583.51 for a breakout entry. Manage risk properly as volatility is expected to rise with macroeconomic events
#Bitcoin #BTC #BTCUSDT #Crypto #CryptoTrading #TechnicalAnalysis #CryptoMarket #TradingView #Altcoins
GBPCHF BEARISH MOMENT WILL TURN ON AFTER RETRACEMENT.ICMARKETS:GBPCHF
The Swiss Frank is capping due to bullish moment of a fundamental asset, Gold.
We believe that the Swiss frank will not frank against Loonie, after hitting resistance risistance area.
From their we will move look at a nice bearish signal on candlestick pattern to enter into sell mode.
A H4 close above that resistance area will pave way to the bullish momentum but I believe it will not be a frank. Let it make a new Higher high near that resistance Area.
A clear signal is subject to price action near resistance area.

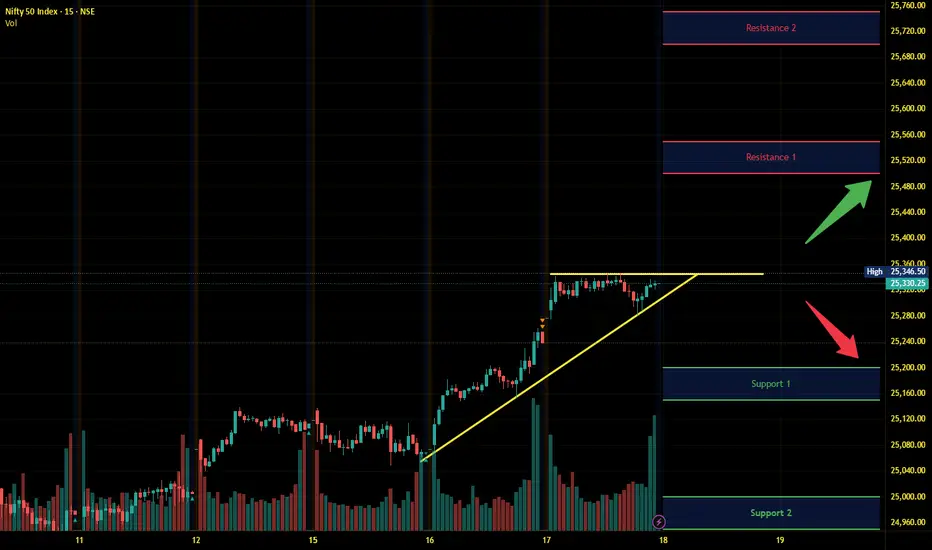
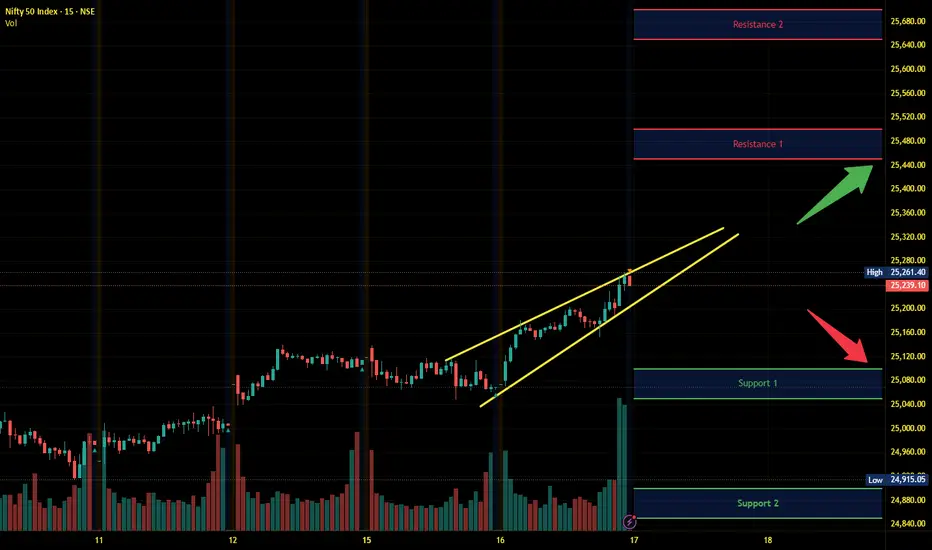
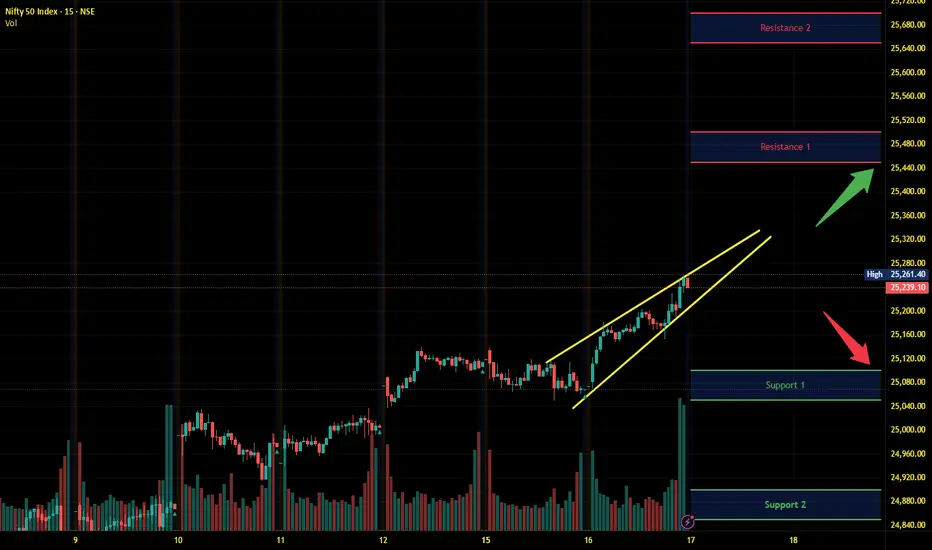
Nifty Intraday Analysis for 18th September 2025NSE:NIFTY
Index has resistance near 25500 – 25550 range and if index crosses and sustains above this level then may reach near 25700 – 25750 range.
Nifty has immediate support near 25200 – 25150 range and if this support is broken then index may tank near 25000 – 24950 range.
The global market will react to the outcome of the US FOMC meeting scheduled tonight. Rate cut and / or positive commentary will propel the market along with the bullion market and no rate cut and / or cautious commentary will drag the market.
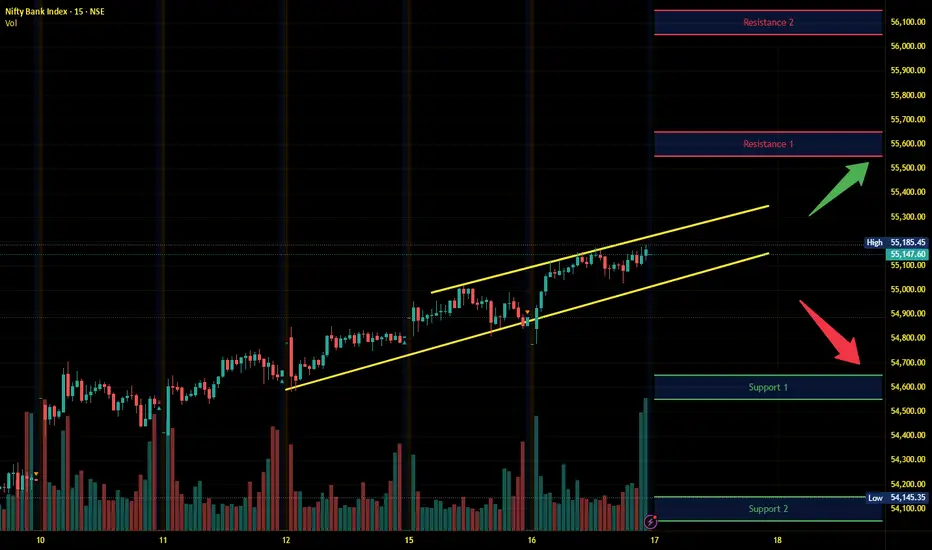
Banknifty Intraday Analysis for 18th September 2025NSE:BANKNIFTY
Index has resistance near 55900 – 56000 range and if index crosses and sustains above this level then may reach near 56400– 56500 range.
Banknifty has immediate support near 55100 - 55000 range and if this support is broken then index may tank near 54600 - 54500 range.
The global market will react to the outcome of the US FOMC meeting scheduled tonight. Rate cut and / or positive commentary will propel the market along with the bullion market and no rate cut and / or cautious commentary will drag the market.

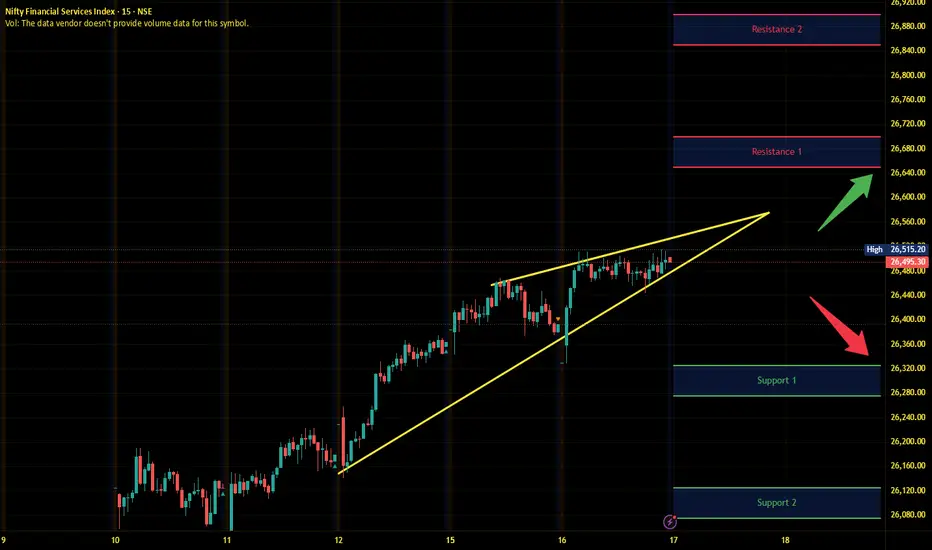
Finnifty Intraday Analysis for 18th September 2025NSE:CNXFINANCE
Index has resistance near 26700 - 26750 range and if index crosses and sustains above this level then may reach near 26900 - 26950 range.
Finnifty has immediate support near 26425 – 26375 range and if this support is broken then index may tank near 26225 – 26175 range.
The global market will react to the outcome of the US FOMC meeting scheduled tonight. Rate cut and / or positive commentary will propel the market along with the bullion market and no rate cut and / or cautious commentary will drag the market.

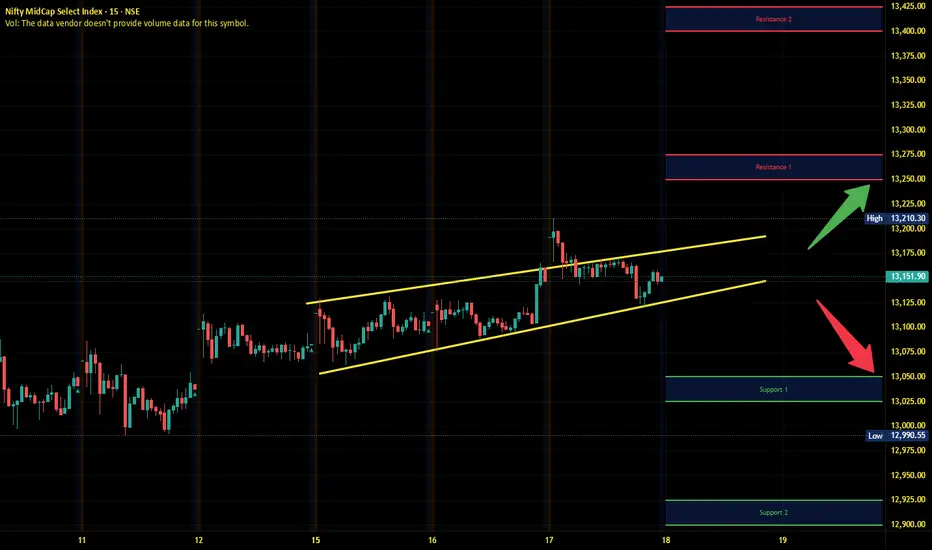
Midnifty Intraday Analysis for 18th September 2025NSE:NIFTY_MID_SELECT
Index has immediate resistance near 13250 – 13275 range and if index crosses and sustains above this level then may reach 13400 – 13425 range.
Midnifty has immediate support near 13050 – 13025 range and if this support is broken then index may tank near 12925 – 12900 range.
The global market will react to the outcome of the US FOMC meeting scheduled tonight. Rate cut and / or positive commentary will propel the market along with the bullion market and no rate cut and / or cautious commentary will drag the market.
BIOCON LIMITEDPrice recently rebounded from the order block zone (₹340–350) with a strong hammer candle followed by bullish confirmation.
Current momentum is pushing price towards the ₹375–380 resistance. Sustaining above this zone can open the way for a rally towards ₹410 (external liquidity zone).
The ascending structure and repeated demand from discount zone indicate accumulation by buyers.
Support lies at ₹345–350, while short-term stop loss can be considered below ₹340.
👉 In short: Bullish bias; above ₹375 breakout, next target ₹410. Strong support at ₹345

XAUUSD GOLD Analysis on (18/09/2025)#XAUUSD UPDATEDE
Current price - 3659
If price stay below 3680, then next target 3640,3620 and above that 3700
Plan;If price break 3659-3665 area, and stay below 3660, we will place sell order in gold with target of 3640 and 3620 & stop loss should be placed at 3700

Trading Analysis for Gold Spot / U.S. Dollar (15-Minute Chart)Sell XAU/USD now at 3688.00 level and take a stop loss of 3703.00 and the targets will be as follows.
Entry range 3691.00 to 3687.00
Take Profit 1 = 3673.00
Take Profit 2 = 3665.00
Take Profit 3 = 3655.00
Take Profit 4 = 3645.00
Stock Loss 3703.00
Based on the provided 15-minute chart for Gold Spot / U.S. Dollar (XAU/USD), published by NaviPips on TradingView.com on June 30, 2025, at 17:53 UTC, here’s a suggested trading setup for a buy position:
Current Price and Trend: The current price is 3,241.875, with a slight increase of +0.250 (+0.01%). The chart shows a recent downtrend that appears to be stabilizing near the current level, suggesting a potential reversal point.
Buy Entry: Enter a buy position at 3,312.875 (current price), as it aligns with a support zone where the price has found a base, indicated by the horizontal dashed line and recent consolidation.
Stop Loss: Place a stop loss at 3,295.250, below the recent low, to protect against further downside. This level is approximately 10.625 points below the entry, defining the risk.
Take Profit Levels:
Take Profit 1: 3,317.875, a conservative target about 20.000 points above the entry, aligning with a minor resistance zone.
Take Profit 2: 3,324.750, a mid-range target approximately 31.875 points above the entry.
Take Profit 3: 3,332.500, a deeper target about 45.625 points above the entry, indicating a potential trend reversal.
Price Action: The chart indicates a downtrend with a possible bottoming pattern near the current level. The support zone and upward candlestick suggest a buy opportunity if the price holds.
Risk-Reward Ratio: The distance to the stop loss (10.625 points) compared to the take profit levels (20.000 to 45.625 points) offers a favorable risk-reward ratio, ranging from approximately 1:1.9 to 1:4.3.
Conclusion
Enter a buy at 3,241.875, with a stop loss at 3,295.250 and take profit levels at 3,317.875, 3,324.750, and 3,332.500. Monitor the price action for confirmation of an upward move, and be cautious of a potential continued downtrend if the price breaks below the stop loss level. (Note: I assume "take profot" was a typo for "take profit" and have corrected it accordingly.)
usha martinPrice has formed an inverted Head & Shoulders, a reversal pattern signaling strength.
Breakout above neckline near ₹398 has triggered upward momentum.
Current price is around ₹410, with next resistance/target near ₹447.
Stop loss area is around ₹367 to manage risk.
Trend remains positive as long as it sustains above breakout zone.
👉 In short: Bullish bias with target ₹447; support at ₹367.

ETHUSD SHOWING A GOOD UP MOVE WITH 1:8 RISK REWARD ETHUSD SHOWING A GOOD
UP MOVE WITH 1:8 RISK REWARD
DUE TO THESE REASON
A. its following a rectangle pattern that stocked the market
which preventing the market to move any one direction now it trying to break the strong resistant lable
B. after the break of this rectangle it will boost the market potential for break
C. also its resisting from a strong neckline the neckline also got weeker ald the price is ready to break in the outer region
all of these reason are indicating the same thing its ready for breakout BREAKOUT trading are follws good risk reward
please dont use more than one percentage of your capitalfollow risk reward and tradeing rules
that will help you to to become a bettertrader
thank you

FED countdown | Buy at support, Sell at resistanceXAU/USD – 17/09 | Captain Vincent ⚓
🔎 Captain’s Log – News Context
18/09, 01:00 (US time): FED rate decision + Dot Plot → policy outlook for upcoming meetings
01:30: Powell’s speech – the key market focus
Market consensus: FED almost certain to cut -25bps. However, the -50bps scenario still exists → if it happens, it will be a “big boost” for Gold
During Asia–Europe session, Gold faced early profit-taking, dropping quickly to 3,677 – 3,675, reflecting caution ahead of the FED
⏩ Captain’s Summary
Gold is making a technical pullback before the FED.
Medium-term trend remains bullish, but patience is needed to wait for better Buy entries.
📈 Captain’s Chart – Technical Analysis
Storm Breaker (Resistance / Sell Zone)
Nearby OB: 3,693 – 3,695 (short scalp)
ATH Zone: 3,717 – 3,720 (strong resistance, potential heavy selling)
Golden Harbor (Support / Buy Zone)
Shallow Dock: 3,656 – 3,657 (short-term)
Main Harbor: 3,629 – 3,630 (trendline confluence + old BoS)
Market Structure
Multiple BoS confirm bullish trend
Price retracing to support, likely to bounce back and test 3,693 – 3,717
Break above 3,720 → confirms new ATH
🎯 Captain’s Map – Trade Plan
✅ Buy (priority)
Buy Zone 1
Entry: 3,656 – 3,657
SL: 3,648
TP: 3,675 – 3,693 – 3,717
Buy Zone 2
Entry: 3,629 – 3,630
SL: 3,618
TP: 3,656 – 3,690 – 3,717
⚡ Sell (only at resistance)
Sell Zone OB
Entry: 3,693 – 3,695
SL: 3,705
TP: 3,690 – 3,685 - 3680 - 368x - 36xx
Sell Zone ATH
Entry: 3,717 – 3,720
SL: 3,727
TP: 3,715 – 3,710 – 3,705 - 37xx
⚓ Captain’s Note
“Before the FED countdown, profit-taking waves pulled the Golden ship toward Golden Harbor 🏝️ (3,656 – 3,629) .
Yet the main current still flows north, the bullish trend remains intact.
Storm Breaker 🌊 (3,693 – 3,720) is the big wave, suitable for short Quick Boarding 🚤 scalps.
Sailors must stay patient – the FED wind could be the force to propel Gold to new peaks.”

Supreme Ind (Daily) - Approaching Critical Res ConfluenceAfter a significant uptrend that concluded in June 2024, Supreme Industries entered a corrective downtrend lasting until April 2025. Since then, the stock has shown signs of a bullish reversal by establishing a pattern of higher lows , indicating that buyers are stepping in at progressively higher prices.
The Resistance Zone
Currently, the stock is approaching a major technical hurdle: a confluence of resistance . This is created by the intersection of a long-term downward-sloping (angular) trendline and a key horizontal resistance level. Multiple recent attempts to breach this zone, though unsuccessful, signal persistent buying interest and a buildup of pressure.
Indicator Analysis
Positive Signs: Trading volume has been healthy in recent sessions. Furthermore, the short-term Exponential Moving Averages (EMAs) have registered a bullish crossover , confirming positive short-term momentum.
Cautionary Signs: A long-term Golden Crossover (50-day SMA crossing above the 200-day SMA) has not yet occurred. This more significant signal would be needed to confirm a durable, long-term trend reversal.
Future Outlook & Key Levels
The future direction depends on the stock's ability to resolve the battle at the current resistance confluence.
Bullish Scenario: A decisive breakout and close above both trendlines would be a strong bullish signal. If this occurs, the stock could rally towards the next target of ₹5,060.
Bearish Scenario: If the resistance holds and the upward momentum fades, the stock could pull back to test its support level near ₹4,251.
Keep monitoring !!

XAUUSD : 16th Sept 25 - TP HIT1. Fakeout formed during Pre NY session
2. Price broke support and price retraced back to support during NYSE open session
3. Once resistance confirmed , entered sell side on BPCL
4.Fake out , Breakdown ( Pre NY ) + Retrace ( NYSE open )
5. Secured 90% partials @ 1:1

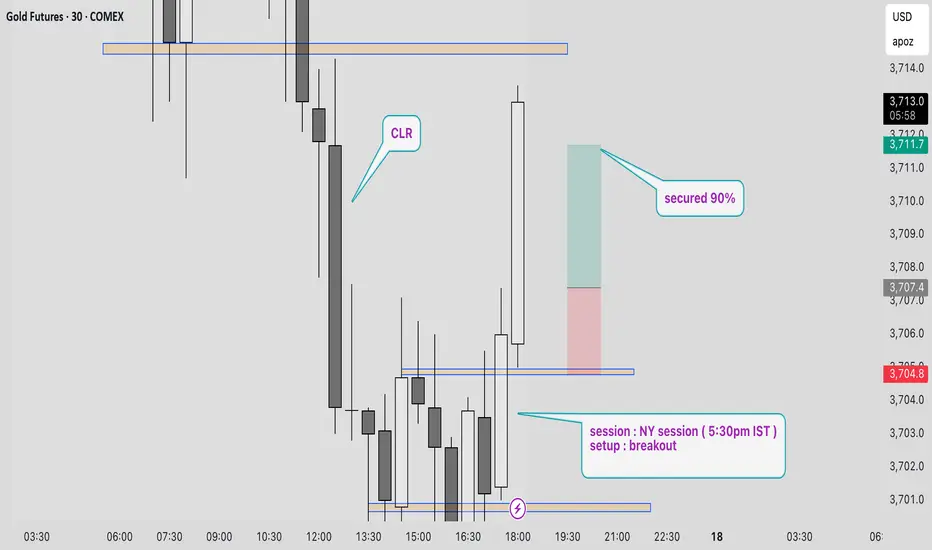
XAUUSD : Sept 17th - TP HIT1. Planned a reversal trade
2. Clean range is present to the left side
3. Breakout happened at NY session above resistance
4. Anticapated volume push during NY session
5.Secured 90% partials at 1:1.5
Nifty Intraday Analysis for 17th September 2025NSE:NIFTY
Index has resistance near 25450 – 25500 range and if index crosses and sustains above this level then may reach near 25650 – 25700 range.
Nifty has immediate support near 25100 – 25050 range and if this support is broken then index may tank near 24900 – 24850 range.
Banknifty Intraday Analysis for 17th September 2025NSE:BANKNIFTY
Index has resistance near 55550 – 55650 range and if index crosses and sustains above this level then may reach near 56050– 56150 range.
Banknifty has immediate support near 54650 - 54550 range and if this support is broken then index may tank near 54150 - 54050 range.
Finnifty Intraday Analysis for 17th September 2025NSE:CNXFINANCE
Index has resistance near 26650 - 26700 range and if index crosses and sustains above this level then may reach near 26850 - 26900 range.
Finnifty has immediate support near 26325 – 26275 range and if this support is broken then index may tank near 26125 – 26075 range.
Midnifty Intraday Analysis for 17th September 2025NSE:NIFTY_MID_SELECT
Index has immediate resistance near 13250 – 13275 range and if index crosses and sustains above this level then may reach 13400 – 13425 range.
Midnifty has immediate support near 13050 – 13025 range and if this support is broken then index may tank near 12925 – 12900 range.
Sensex - Expiry Day Analysis Sep 18Price is facing resistance around the 82720 - 82760 zone and is unable to break it today. 83000 is the next nearby resistance. 82500 is the nearby support.
Buy above 82780 with the stop loss of 82660 for the targets 82900, 82980, 83060, 83200, and 83360.
Sell below 82480 with the stop loss of 82600 for the targets 82360, 82240, 82120, 82040, 81960, and 81880.
Expected expiry day range is 82500 to 83400.
Always do your analysis before taking any trade.

BUY TODAY SELL TOMORROW for 5%DON’T HAVE TIME TO MANAGE YOUR TRADES?
- Take BTST trades at 3:25 pm every day
- Try to exit by taking 4-7% profit of each trade
- SL can also be maintained as closing below the low of the breakout candle
Now, why do I prefer BTST over swing trades? The primary reason is that I have observed that 90% of the stocks give most of the movement in just 1-2 days and the rest of the time they either consolidate or fall
Resistance Breakout in MBLINFRA
BUY TODAY SELL TOMORROW for 5%
