Finnifty Intraday Analysis for 24th September 2025NSE:CNXFINANCE
Index has resistance near 26700 - 26750 range and if index crosses and sustains above this level then may reach near 26900 - 26950 range.
Finnifty has immediate support near 26400 – 26350 range and if this support is broken then index may tank near 26200 – 26150 range.
The global market may react to the US FOMC head Powell’s speech scheduled tonight if any unfavourable statement emerges.
Support and Resistance

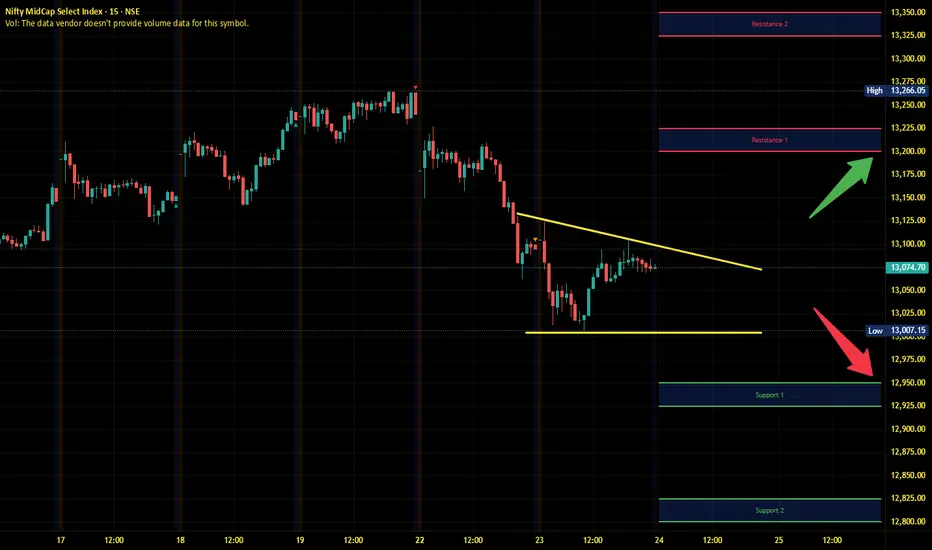
Midnifty Intraday Analysis for 24th September 2025NSE:NIFTY_MID_SELECT
Index has immediate resistance near 13200 – 13225 range and if index crosses and sustains above this level then may reach 13325 – 13350 range.
Midnifty has immediate support near 12950 – 12900 range and if this support is broken then index may tank near 12825 – 12800 range.
The global market may react to the US FOMC head Powell’s speech scheduled tonight if any unfavourable statement emerges.
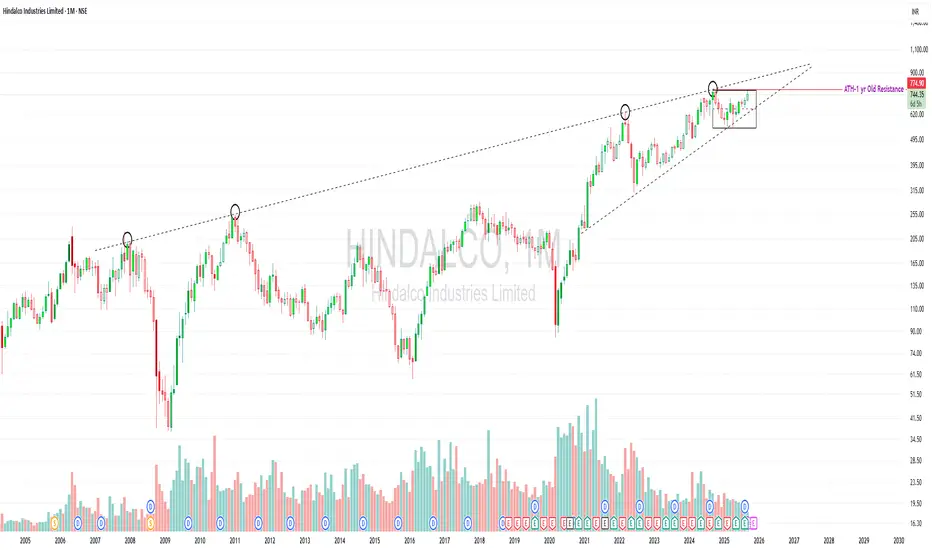
Hindalco – Monthly Chart | Educational View
Near ATH, testing a 20-year trendline — worth studying.
Price is trading inside a long-term rising wedge.
The upper trendline has acted as resistance multiple times (2007, 2011, 2022, and now).
Currently consolidating in a tight range near ATH (~₹775).
Volume needs improvement — a decisive breakout above resistance should ideally come with strong volume confirmation.
⚠️ Risks / Watch-outs:
Rising wedge patterns can also resolve downwards if breakout fails.
Repeated rejections from the same long-term trendline may trigger profit-taking.
Without big volume, any breakout attempt may not sustain.
💡 Learning Point: Long-term trendlines and volume behavior are crucial in studying potential breakouts vs. failed attempts.
⚠️ Disclaimer: This post is for educational purposes only. It is not a buy/sell recommendation or financial advice. Please do your own research or consult a SEBI-registered advisor before making investment decisions.
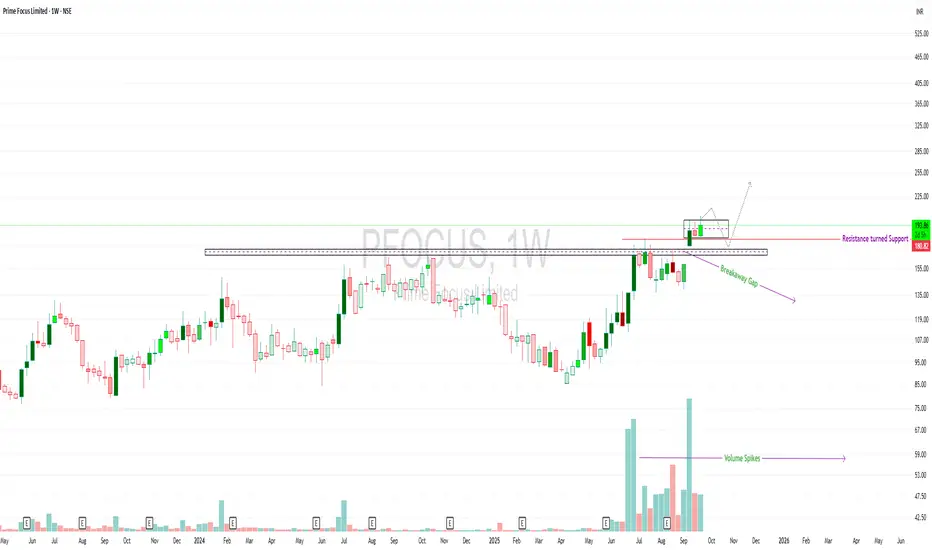
Prime Focus Ltd – Weekly Analysis
Breakaway gap seen above the resistance zone.
Strong volume confirmation supports the breakout.
Previous resistance ~₹180 has flipped into support.
Currently consolidating above the breakout zone.Retest possibility remains, but structure suggests strength as long as ₹180 holds.
🔎 Classic example of a resistance-turned-support with volume validation. Useful for those studying breakout structures.Observation only, not a trade call. Educational use.
⚠️ Disclaimer: This chart is shared purely for educational and informational purposes. It is not a buy/sell recommendation or financial advice. Please do your own research or consult a SEBI-registered advisor before making any investment decisions.
Gold hits record 3,759 | Safe-haven flows surge back🟡 XAU/USD – 23/09 | Captain Vincent ⚓
🔎 Captain’s Log – Context & News
Today Gold surged nearly +2% , hitting a record $3,759/oz .
Geopolitical tensions : Israel launched missiles into Lebanon, killing 5 (including 4 US citizens) → safe-haven demand rushed back into Gold.
USD weakened , capital flowed out of stocks & bonds → strong support for precious metals.
ETFs & speculators : heavy buying amplified the rally.
Silver : jumped to its highest level in 14 years, reinforcing strength in the precious metals sector.
⏩ Captain’s Summary : Gold is fueled by geopolitics, macro factors, and safe-haven demand. But after a hot rally, the big question: continue breaking highs or face sharp swings if the FED shifts tone?
📈 Captain’s Chart – Technical Analysis (H45)
Storm Breaker (Resistance / Sell Zone)
3,771 – 3,787 (Fibo 0.5–0.618 confluence, ATH test zone)
Golden Harbor (Support / Buy Zone)
Near support: 3,740 (previous high turned support)
OB Dock: 3,717 – 3,723
Breakout Harbor: 3,689 – 3,691
Market Structure
Gold broke out to Higher High around 3,755 – 3,759.
Main trend remains bullish, but prone to volatility / pullback after a hot rally.
🎯 Captain’s Map – Trade Plan
✅ Buy (trend-follow priority)
Buy Zone 1 (OB)
Entry: 3,717 – 3,723
SL: 3,707
TP: 3,725 – 3,730 – 3,735 – 3,740 – 3,750
Buy Zone 2 (Breakout Retest)
Entry: 3,689 – 3,691
SL: 3,678
TP: 3,699 – 3,710 – 3,7xx
⚡ Sell (short-term scalp if overbought)
Sell Zone (ATH test)
Entry: 3,783 – 3,785
SL: 3,795
TP: 3,759 – 3,740 – 3,717
⚓ Captain’s Note
“The geopolitical storm pushed the Golden sails past 3,759. Golden Harbor 🏝️ (3,717 – 3,689) is the safe dock for sailors to board the northbound trend. Storm Breaker 🌊 (3,771 – 3,787) may raise heavy waves, suitable for short Quick Boarding 🚤 scalps. The main voyage remains bullish, but after a hot rally, sailors must keep a firm hand on the helm to avoid being thrown off by choppy swings.”

Axis Bank rally faces overbought pressureTopic statement:
Axis Bank has rallied sharply over the past 10 sessions, but signs of short-term exhaustion and resistance suggest a potential pause or pullback.
Key points:
1. The recent price surge has filled the gap created on 18th July 2025, reaching a potential resistance zone
2. MFI is elevated at 86, indicating the stock is highly overbought in the short term
3. Candlesticks have formed a steep 70-degree ascent, reflecting sharp bullish intensity
4. Price has jumped above both the 50 and 200-day EMAs, signaling strong momentum but potential overheating
5. The stock may now consolidate below the 1200 level due to increased selling pressure
6. The long-term bullish channel remains intact, as price bounced off the lower trendline support during its recent move

Gold Neowave Forecast
Update Type- Intraday
Yesterday wave-((iii)) Completed at the top, currently we are in wave ((iv))
after blue (a)(b)(c), market will continue the previous buy cycle for wave-((v))..
we will see after the structure we should buy or not
Learn More about trend here

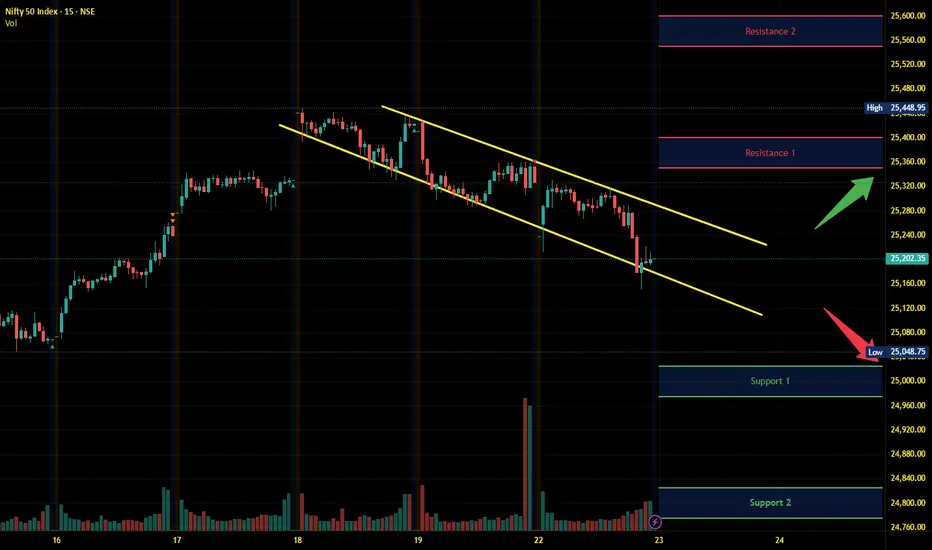
Nifty Intraday Analysis for 23rd September 2025NSE:NIFTY
Index has resistance near 25350 – 25400 range and if index crosses and sustains above this level then may reach near 25550 – 25600 range.
Nifty has immediate support near 25025 – 24975 range and if this support is broken then index may tank near 24825 – 24775 range.
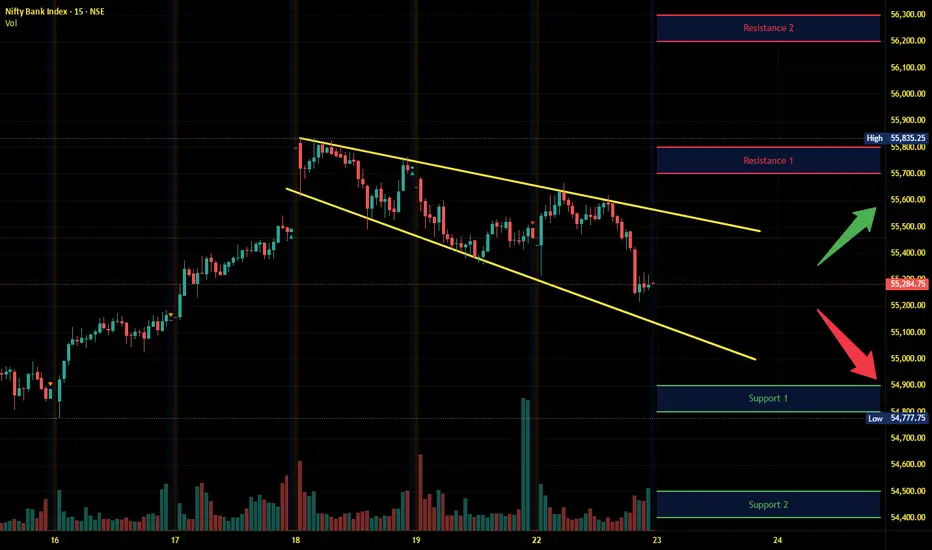
Banknifty Intraday Analysis for 23rd September 2025NSE:BANKNIFTY
Index has resistance near 55700 – 55800 range and if index crosses and sustains above this level then may reach near 56200– 56300 range.
Banknifty has immediate support near 54900 - 54800 range and if this support is broken then index may tank near 54500 - 54400 range.
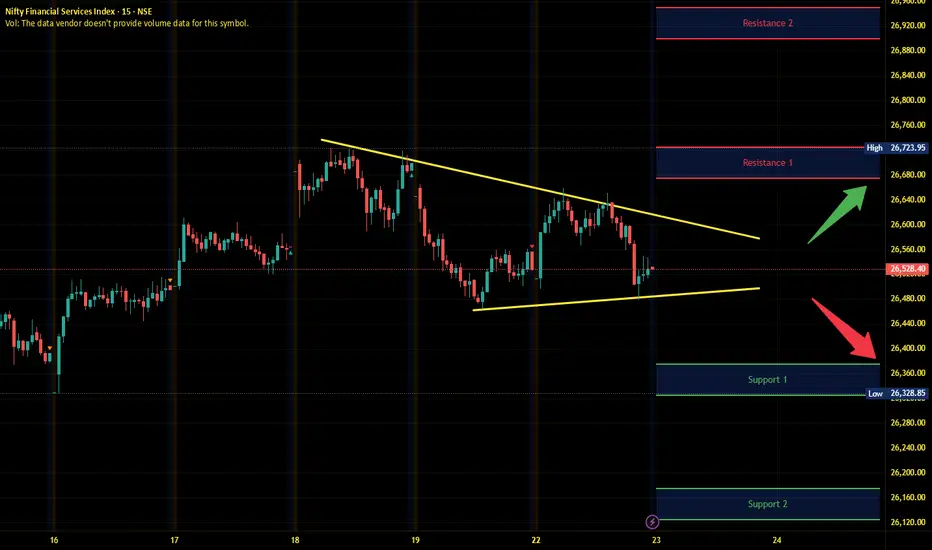
Finnifty Intraday Analysis for 23rd September 2025NSE:CNXFINANCE
Index has resistance near 26675 - 26725 range and if index crosses and sustains above this level then may reach near 26900 - 26950 range.
Finnifty has immediate support near 26375 – 26325 range and if this support is broken then index may tank near 26175 – 26125 range.
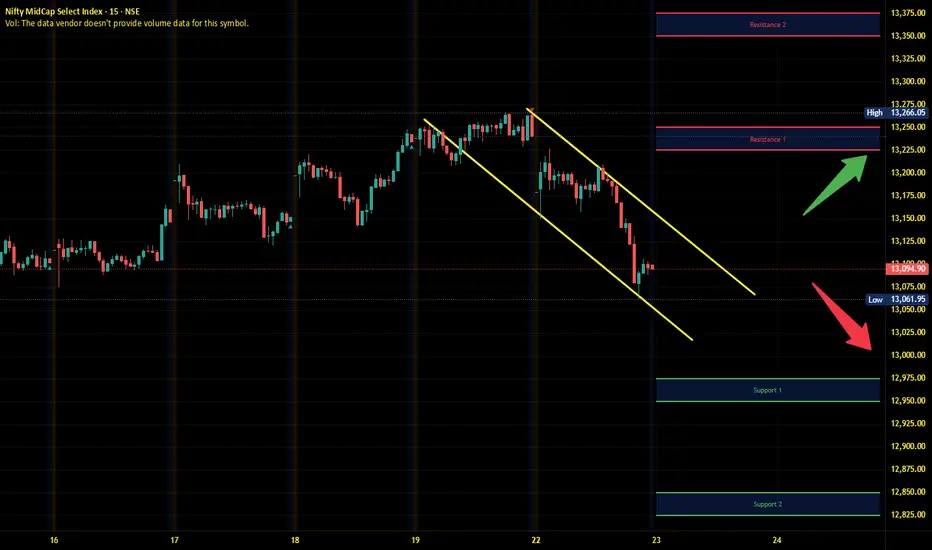
Midnifty Intraday Analysis for 23rd September 2025NSE:NIFTY_MID_SELECT
Index has immediate resistance near 13225 – 13250 range and if index crosses and sustains above this level then may reach 13350 – 13375 range.
Midnifty has immediate support near 12975 – 12950 range and if this support is broken then index may tank near 12850 – 12825 range.
HCCHCC showing strength and giving resistance breakout. As long as it is closing above 27 then it may continued its journey north side. Keep it in watchlist. 33/36 is seems on the table

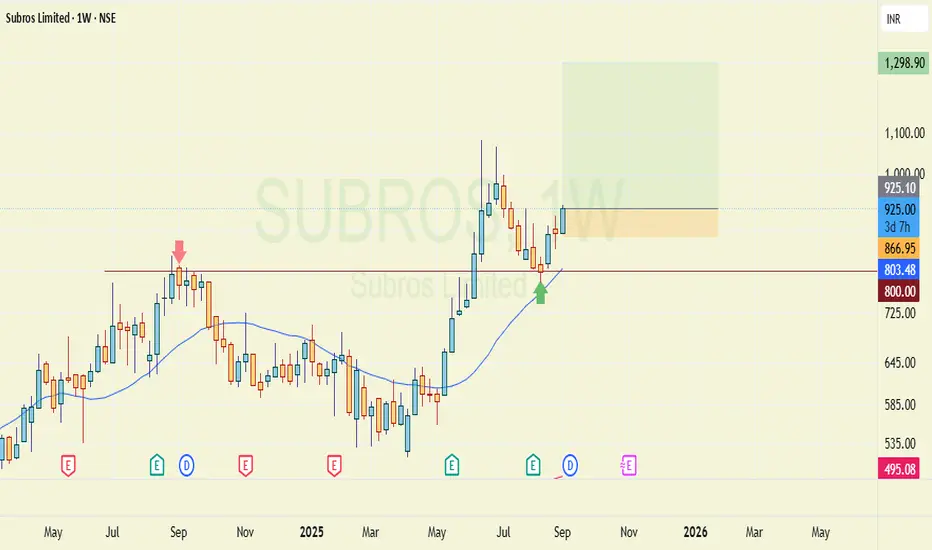
Resistance to support:Subros800 levels have acted as good resistance in sept 24 and now after a year it has acted as support.
This level is also 20week sma.
Target and SL on chart. This makes it a high probability bullish trade.
It will take 5~8 months for target.
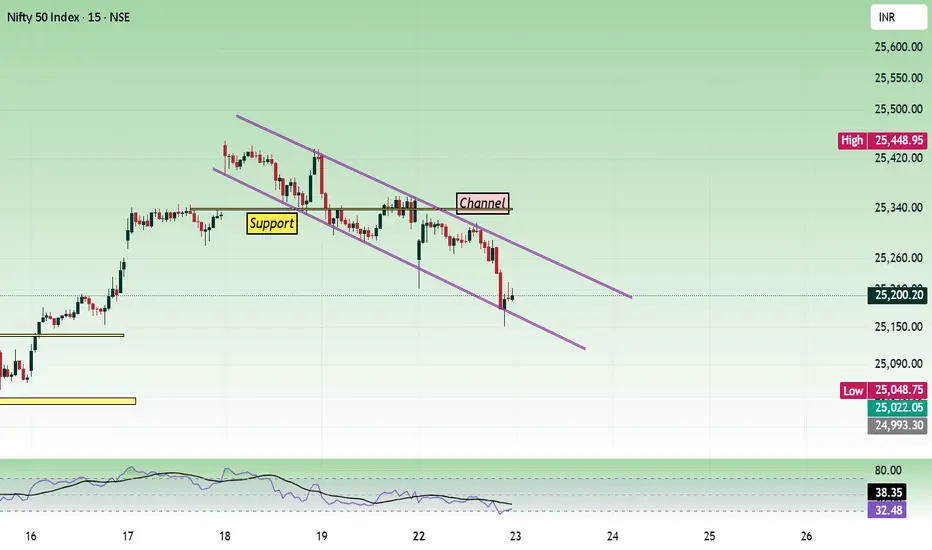
Nifty - Expiry Day Analysis Sep 23Price faced resistance around the 25300 - 25320 zone and fall down. Next nearby support is seen at 25080 as per the one-hour chart.
In the lower time frame, the price is moving inside a descending channel.
Buy above 25240 with the stop loss of 25200 for the targets 25280, 25320, 25360, 25420, and 25480.
Sell below 25160 with the stop loss of 25200 for the targets 25120, 25080, 25040, 25000, and 24950.
Expected expiry day analysis is 25050 to 25400.
Always do your analysis before taking any trade.
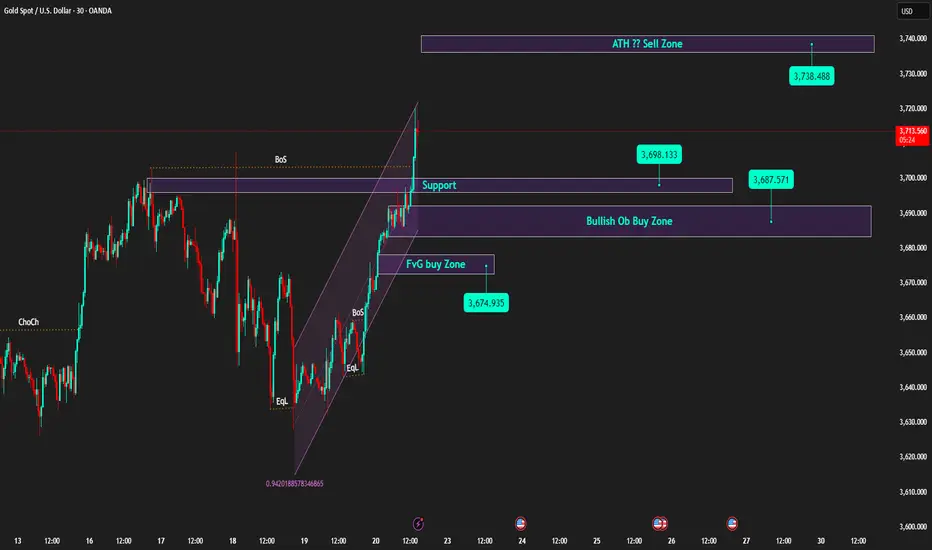
Weekly Candle Closes High | Prioritise Buying on Pullback to Sup🟡 XAU/USD – 22/09 | Captain Vincent ⚓
🔎 Captain’s Log – Quick Overview
Last week, gold closed around 3,685, paving the way for further advancement and a new ATH.
After the FED cut 25bps, Powell's 'brake' remarks slowed the rise, but the larger trend remains bullish.
This morning, prices surged to 3,697.xx, now slightly adjusting around 3,692 – 3,690 → a sensible strategy: wait for a pullback to continue Buying.
⏩ Captain’s Summary: The gold voyage still heads North, Buying remains the main choice, but wait for a pullback to board.
📈 Captain’s Chart – Technical Analysis
Golden Harbor (Support / Buy Zone):
Thin support: ~3,698 (recently broken old range top).
OB Dock: 3,687 – 3,690.
FVG Dock: 3,672 – 3,676 (liquidity check on deep pullback).
Storm Breaker (Resistance / Sell Zone):
3,714 – 3,720 (supply cluster / old ATH – likely to react).
Price Structure:
Continuous BoS series, price breaks short-term up channel and creates higher highs → bullish remains the main trend.
🎯 Captain’s Map – Trading Plan (before US session)
✅ Buy (trend priority)
Buy Zone 1
Entry: 3,698 – 3,701
SL: 3,688
TP: 3,706 – 3,714 – 3,720+
Buy Zone 2 (OB)
Entry: 3,687 – 3,690
SL: 3,680
TP: 3,698 – 3,706 – 3,714 – 3,72x
Buy Zone 3 (FVG)
Entry: 3,672 – 3,676
SL: 3,664
TP: 3,687 – 3,706 – 3,714
⚡ Sell (only scalp when overbought)
Sell Zone (ATH test)
Entry: 3,740 – 3,738
SL: 3,750
TP: 3,730 – 3,690 – 3,695
Captain’s Note ⚓
“The new week kicks off with a high-closing candle, the gold vessel continues its bullish course. Golden Harbor 🏝️ (3,690 – 3,672) is a safe anchorage for the crew to watch for Buys. Storm Breaker 🌊 (3,714 – 3,720) is the wave crest where winds may rise, suitable for Quick Boarding 🚤 short scalps. Before the US session, the seas might get choppy – hold the helm tight and manage volume wisely.”
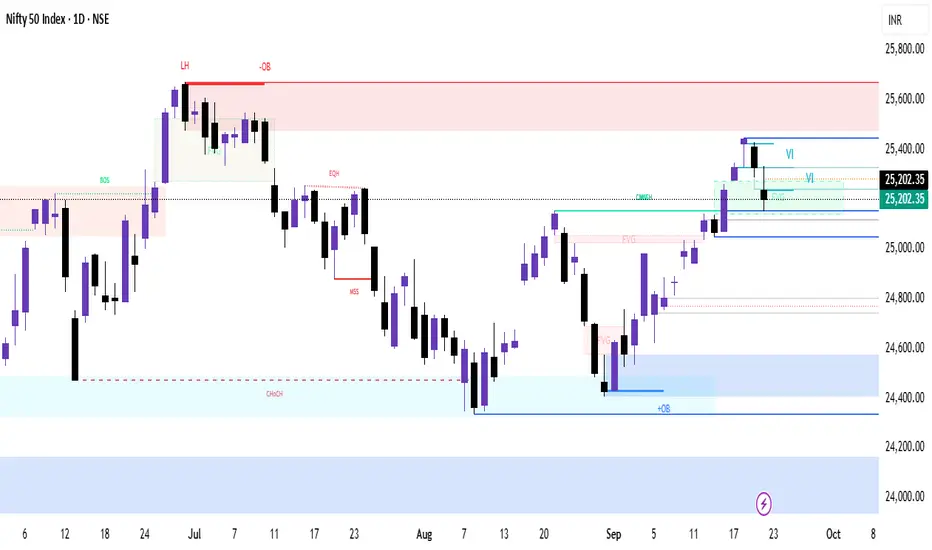
Nifty Technical Analysis – 23 September 2025🕒 1-Day Chart
Support Levels:
25,200: Immediate support; bulls need to defend this level.
25,050: Critical support; a break below this could lead to further downside.
Resistance Levels:
25,300: Immediate resistance; a breakout above this could lead to a rally.
25,450–25,500: Key resistance zone; bulls need to reclaim this for a bullish trend.
Technical Indicators:
RSI is below 60, indicating weakening momentum.
MACD shows a bearish crossover, suggesting potential downside.
Market Sentiment:
The index formed a bearish candle with a long upper shadow, indicating selling pressure at higher levels.
The index is trading below the 10-day EMA, suggesting a short-term downtrend.
🕓 4-Hour Chart
Support Levels:
25,150: Immediate support; a break below this could lead to further downside.
25,000: Strong support; bulls need to defend this level.
Resistance Levels:
25,300: Immediate resistance; a breakout above this could lead to a rally.
25,450: Key resistance; bulls need to reclaim this for a bullish trend.
Technical Indicators:
RSI is below 60, indicating weakening momentum.
MACD shows a bearish crossover, suggesting potential downside.
Market Sentiment:
The index is trading below the 10-period EMA, suggesting a short-term downtrend.
🕐 1-Hour Chart
Support Levels:
25,150: Immediate support; a break below this could lead to further downside.
25,000: Strong support; bulls need to defend this level.
Resistance Levels:
25,250: Immediate resistance; a breakout above this could lead to a rally.
25,400: Key resistance; bulls need to reclaim this for a bullish trend.
Technical Indicators:
RSI is below 60, indicating weakening momentum.
MACD shows a bearish crossover, suggesting potential downside.
Market Sentiment:
The index is trading below the 10-period EMA, suggesting a short-term downtrend.
🕒 15-Minute Chart
Support Levels:
25,150: Immediate support; a break below this could lead to further downside.
25,000: Strong support; bulls need to defend this level.
Resistance Levels:
25,250: Immediate resistance; a breakout above this could lead to a rally.
25,400: Key resistance; bulls need to reclaim this for a bullish trend.
Technical Indicators:
RSI is below 60, indicating weakening momentum.
MACD shows a bearish crossover, suggesting potential downside.
Market Sentiment:
The index is trading below the 10-period EMA, suggesting a short-term downtrend.
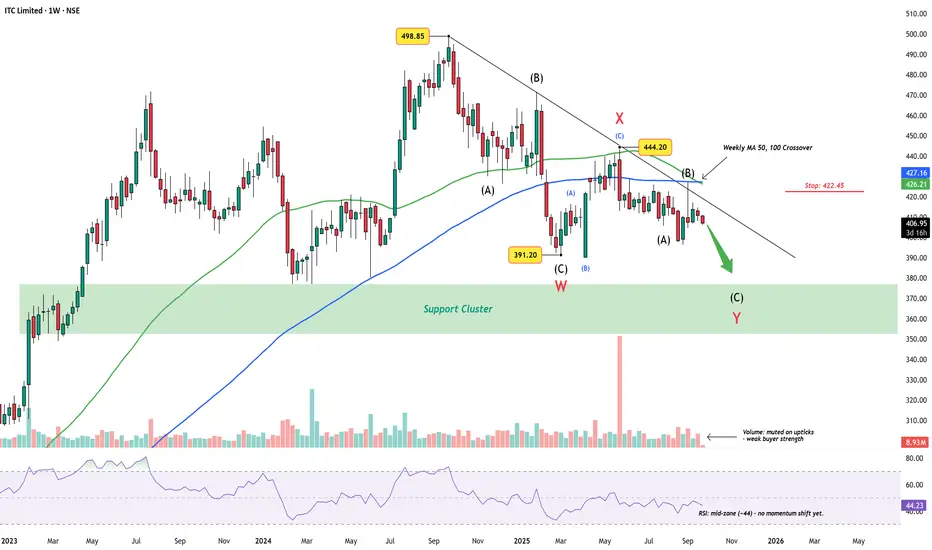
ITC Limited Weekly Chart – Wave Y Targets Support ClusterITC has been trending lower since the ₹498.85 peak, carving out what appears to be a complex W-X-Y correction. The first leg (W) found support near ₹391.20, followed by a corrective bounce into X at ₹444.20. The decline since then has kept price under a descending trendline, respecting the larger corrective rhythm.
Wave Count
Wave W: Completed into the ₹391.20 low.
Wave X: Counter-trend rally capped at 444.20.
Wave Y: Now unfolding, with sub-wave (C) still incomplete.
The broader structure hints that ITC may continue toward the support cluster (₹350–375) before this correction runs its course.
Indicators
Volume : Muted on upticks – rallies lack buying strength.
RSI (~44) : Mid-zone, leaving space for further downside before oversold conditions.
Weekly 50/100 MA crossover : Adds weight to the ongoing corrective bias.
Invalidation
A decisive break above ₹422.45 and sustained strength beyond 427 would question this bearish view, hinting at a possible shift back to bullish sequences.
Summary
Unless ITC reclaims higher ground above 422.45, the bias stays toward a Wave Y completion in the support cluster zone.
Disclaimer: This analysis is for educational purposes only and does not constitute investment advice. Please do your own research (DYOR) before making any trading decisions.
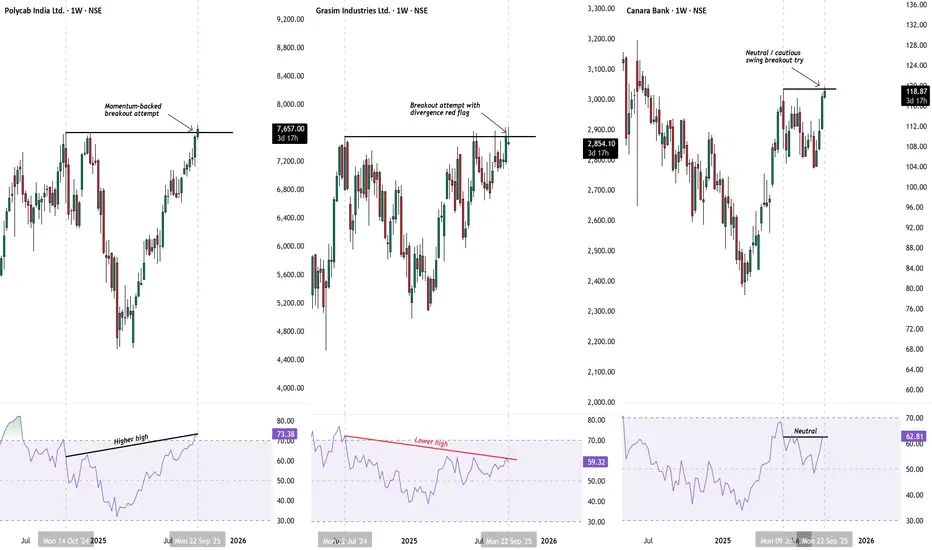
Breakout Attempts – Same Setup, Different StoriesSeveral stocks are attempting key breakouts on the weekly timeframe. At first glance, the charts look alike — price testing overhead resistance. But momentum (RSI) paints very different pictures.
Polycab India – Momentum-backed breakout
RSI makes a higher high, confirming strength behind the move.
Grasim Industries – Breakout with divergence risk
Price pushes higher, but RSI forms a lower high. A red flag for possible weakness.
Canara Bank – Cautious breakout attempt
Price tests the swing high, RSI is neutral with only a slight higher high. Momentum is less convincing.
Takeaway
Breakouts may look the same on price charts, but momentum helps separate strong moves from risky ones. A follow-up with Elliott Wave counts will be done once the structures mature further.
Disclaimer: This analysis is for educational purposes only and does not constitute investment advice. Please do your own research (DYOR) before making any trading decisions.
Nifty weekly expiry analysis for 23/09/2025.Nifty has created 3 consecutive red candle on the daily charts and might touch its 20 EMA.
Market is around the All time high levels and chances of profit booking are there.
Today, nifty has closed 125 points lower than the pervious close.
Major Resistance levels :- 25311, 25438
Support levels :- 25094, 25010
On the hourly charts, the market seems to be taking rejection from the hourly 20 ema and it trading between 20 and 50 EMA.
It is trading in a close parallel channel range. If it remains in the range avoid trading or scalp as per the risk appetite.
Though nifty has taking down the 50 EMA and there are chance of it tested the higher moving averages soon.
Tomorrow is nifty weekly expiry. Wait and watch for the price action near the price levels before entering a trade.

Nifty 50 Neowave ForecastHi Everyone
Welcome to intelligent investor, we provide market insights by synchronising and combining all the price action waves from different time frames and gives you single trend.
Thank You
How to Read my charts....Click Below

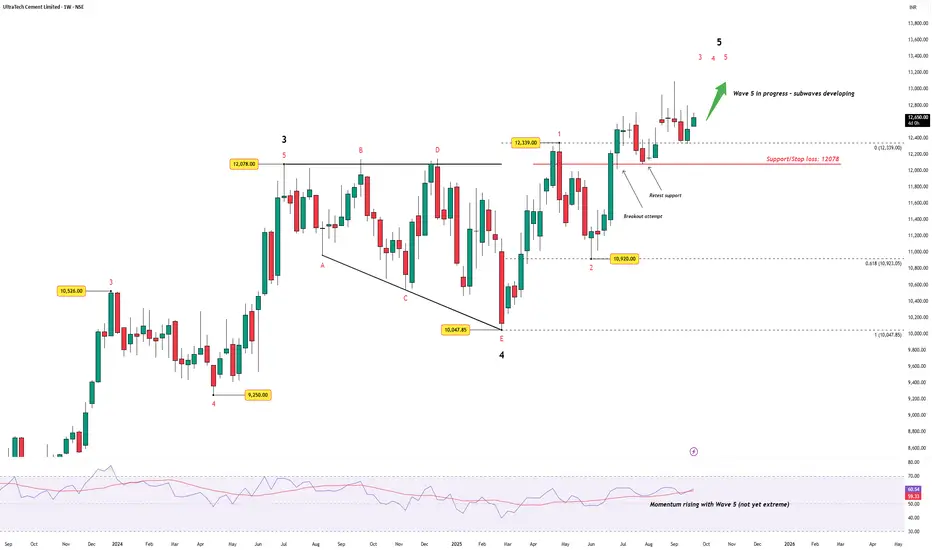
UltraTech Cement – Wave 4 Triangle Breakout, Wave 5 in MotionUltraTech Cement completed a higher-degree Wave 4 triangle between 12,078 and 10,047. The breakout from the E-wave low (10,047) kicked off Wave 5 .
The first breakout attempt above 12,339 was followed by a clean retest of support , keeping the structure intact.
Price is now carving out the internal subwaves of Wave 5.
Strict support / stop loss sits at 12,078 – below this, the bullish thesis fails.
RSI shows momentum rising but not yet at extreme levels – consistent with an unfolding Wave 5.
Summary:
A triangle in Wave 4 has given way to an impulsive Wave 5. As long as 12,078 holds, UltraTech Cement remains biased upward with higher targets open.
The chart will be updated as price action evolves.
Disclaimer: This analysis is for educational purposes only and does not constitute investment advice. Please do your own research (DYOR) before making any trading decisions.
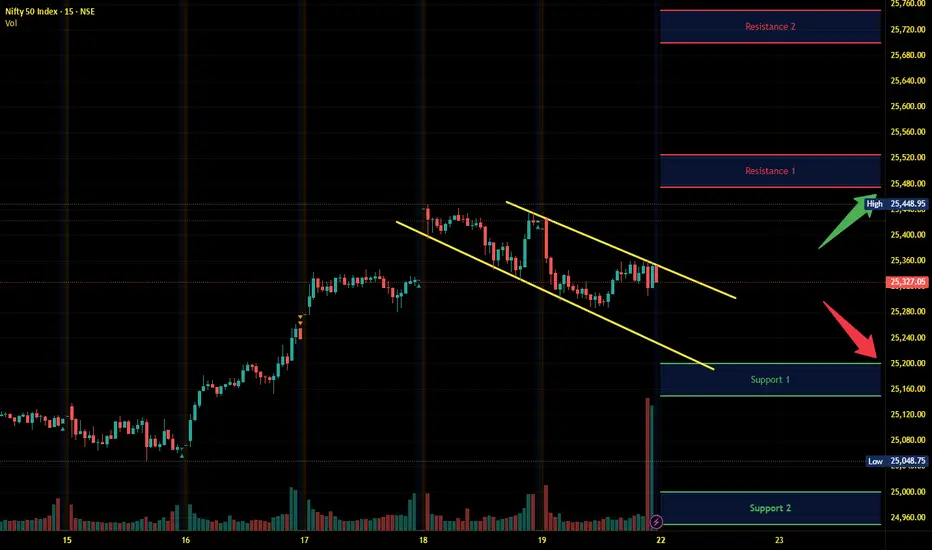
Nifty Intraday Analysis for 22nd September 2025NSE:NIFTY
Index has resistance near 25475 – 25525 range and if index crosses and sustains above this level then may reach near 25700 – 25750 range.
Nifty has immediate support near 25200 – 25150 range and if this support is broken then index may tank near 25000 – 24950 range.
Market specially IT stocks will react to imposition of exorbitant H-1B Visa fee by US and expected to open down.
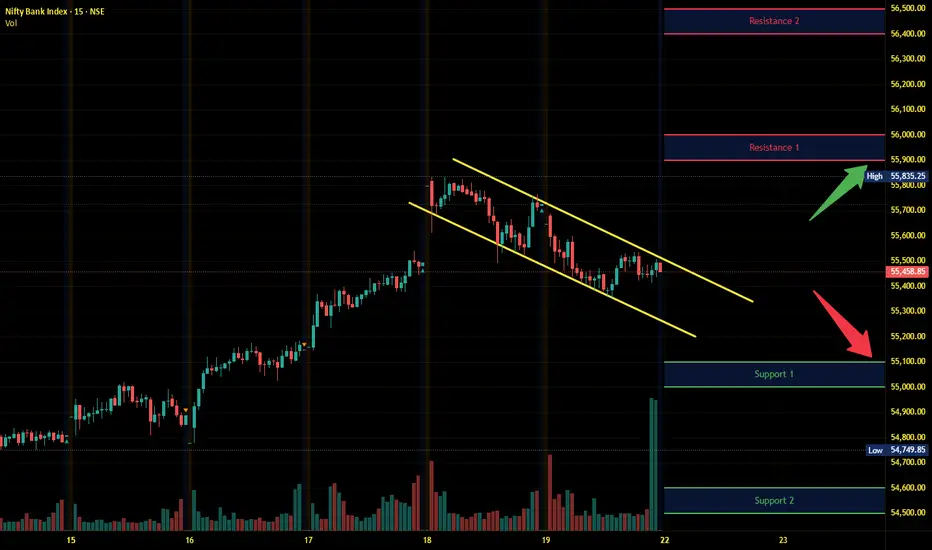
Banknifty Intraday Analysis for 22nd September 2025NSE:BANKNIFTY
Index has resistance near 55900 – 56000 range and if index crosses and sustains above this level then may reach near 56400– 56500 range.
Banknifty has immediate support near 55100 - 55000 range and if this support is broken then index may tank near 54600 - 54500 range.
Market specially IT stocks will react to imposition of exorbitant H-1B Visa fee by US and expected to open down.