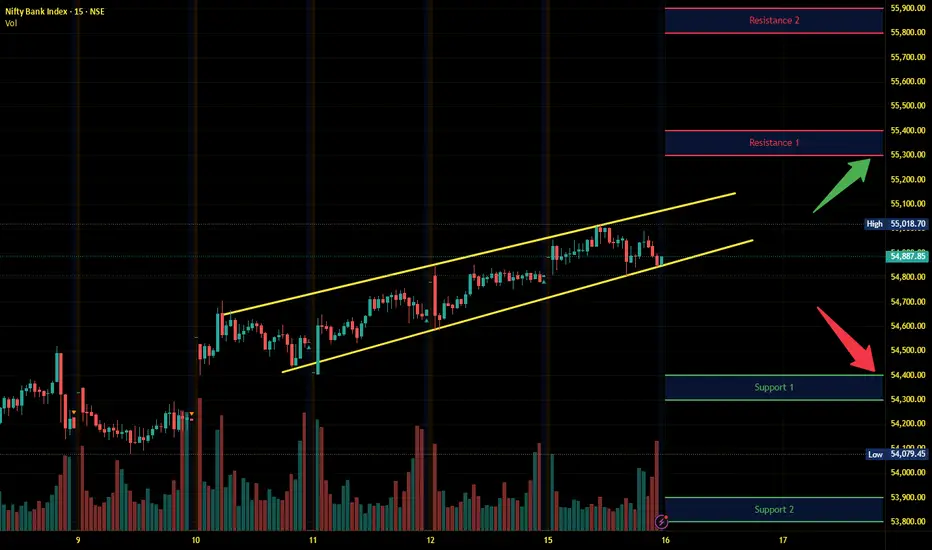
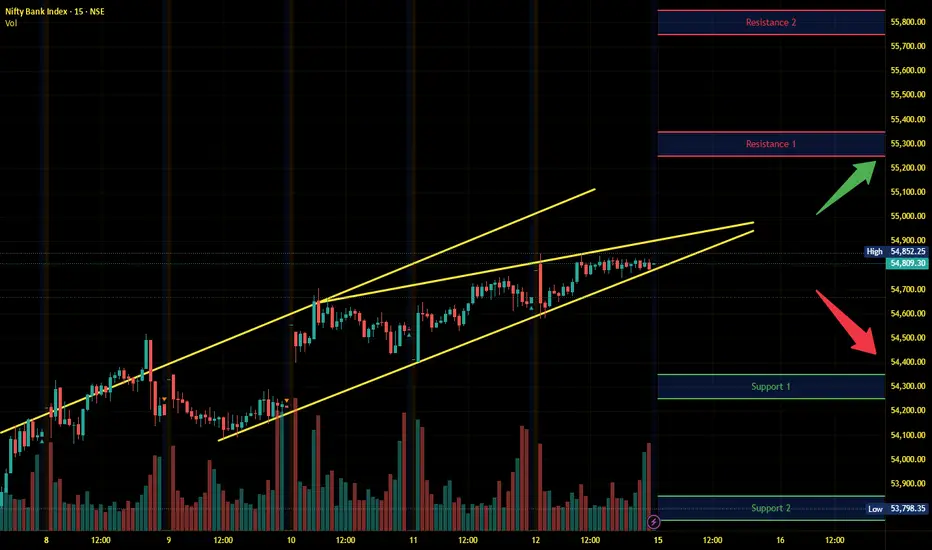
Banknifty Intraday Analysis for 16th September 2025NSE:BANKNIFTY
Index has resistance near 55300 – 55400 range and if index crosses and sustains above this level then may reach near 55800– 55900 range.
Banknifty has immediate support near 54400 - 54300 range and if this support is broken then index may tank near 53900 - 53800 range.
Support and Resistance
Finnifty Intraday Analysis for 16th September 2025NSE:CNXFINANCE
Index has resistance near 26525 - 26575 range and if index crosses and sustains above this level then may reach near 26725 - 26775 range.
Finnifty has immediate support near 26225 – 26175 range and if this support is broken then index may tank near 26025 – 25975 range.

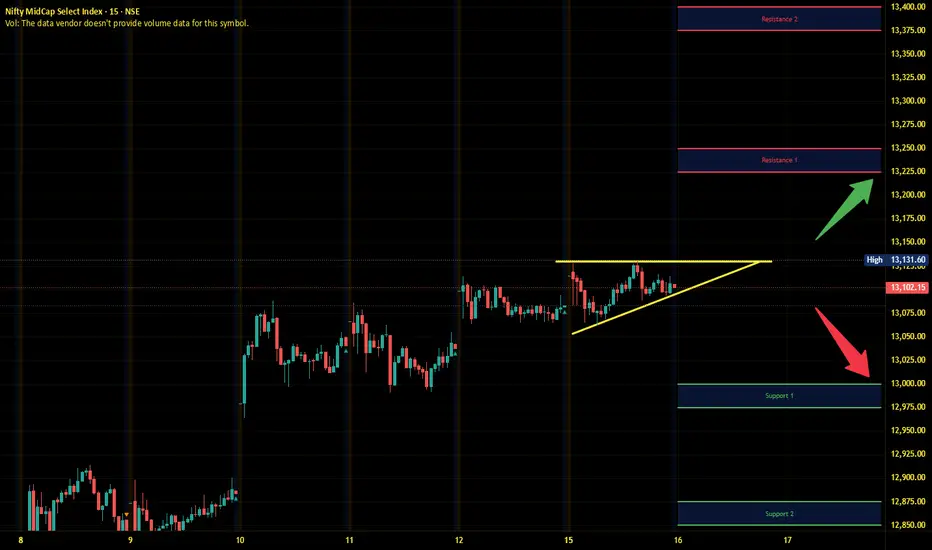
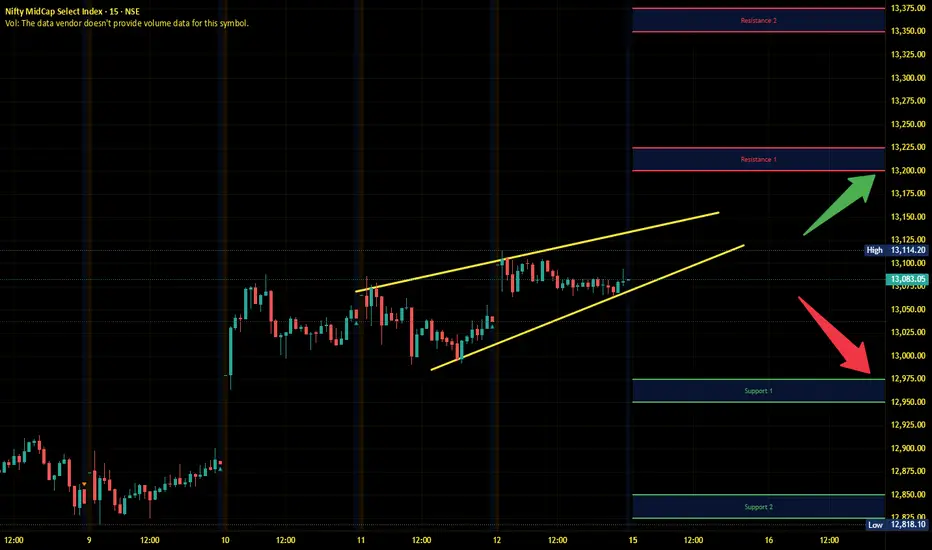
Midnifty Intraday Analysis for 16th September 2025NSE:NIFTY_MID_SELECT
Index has immediate resistance near 13225 – 13250 range and if index crosses and sustains above this level then may reach 13375 – 13400 range.
Midnifty has immediate support near 13000 – 12975 range and if this support is broken then index may tank near 12875 – 12850 range.
CEATPrice respected the Bullish Order Block and Discount Zone, confirming demand around 3000–3100.
A liquidity sweep occurred below 3000, trapping sellers and then reversing sharply.
Market structure shift (MSS) is visible with strong bullish candles reclaiming 3300+.
Current momentum is positive with price moving towards 3450–3500 resistance.

Titan on 1W TF1. Titan have taken support on long term support zone for 3 times.
2. Near support zone, it have formed bullish candlestick patterns.
In May 2025, it have formed Bullish Morubozu like candle which was last hit to support zone.
3. In first week of July 2025, there was a strong bearih candle with volume, despite that, stock have sustained near 3400 levels by consolidation and then have bounced back with 2 Bullish belt-holds in the bounce and have tested the long term resistance zone.
And now have retraced around 50%(July - Aug move).
4. Now the current levels are make or break levels, short term trend will be confirmed, bearish or bullish as per the move from these levels (50% zone).
Probability wise looks like it may take support, previous resistance zone should act as support as per price action.
Let's see how it moves further.
Disclaimer: This is not any stock tip/advice to buy or sell. Invest on your own risk.

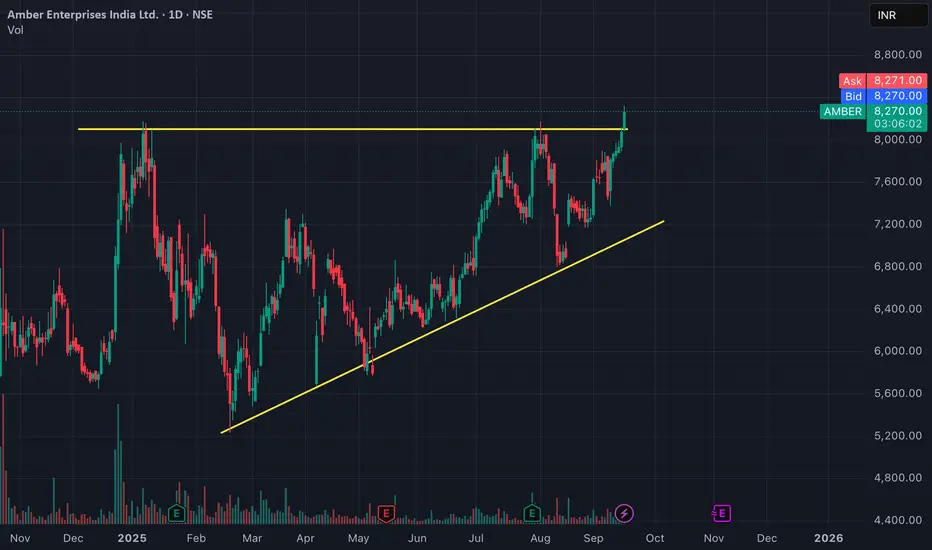
AMBER - Breakout from the resistanceAmber Enterprises India is seeing a strong breakout with the stock rising over 1.8% to ₹8,080 on high trading volumes of around 3.6 lakh shares recently.
Bajaj Housing finance trendline breakout soonBajaj Housing fin, gonna give a breakout soon, it is around it’s support and is suppose to give a long trend line breakout with 10% upside in short term
Buy around - 115-117
Target - 128
Duration - 1-2 months

GOLD Bullish continuation (new highs, momentum sustain) :
Probability: around 60–65%
The breakout has strong support from macro conditions. Real yields look like they are peaking, inflation expectations remain sticky, and the Fed is leaning toward easing. On top of that, the US dollar is softening and central banks are continuing to add gold to reserves. These combined factors increase the odds that the breakout holds and the trend continues higher.
Sideways consolidation or retest of breakout :
Probability: about 25–30%
A pullback or cnsolidation wouldn’t be surprising, especially if the Fed sounds less dovish or if inflation data cools faster than expected. In that case, gold could spend some time chopping between support and resistance before deciding its next big move.
Major correction or deep mean reversion :
A deep selloff looks like the least likely path right now. Real yields aren’t rising sharply, inflation isn’t collapsing, and the dollar is still under pressure. But nothing is guaranteed. A surprise hawkish turn from the Fed or a sudden global disinflation shock could knock gold back toward old structural levels.but this remains the least likely scenario in the near to medium term.

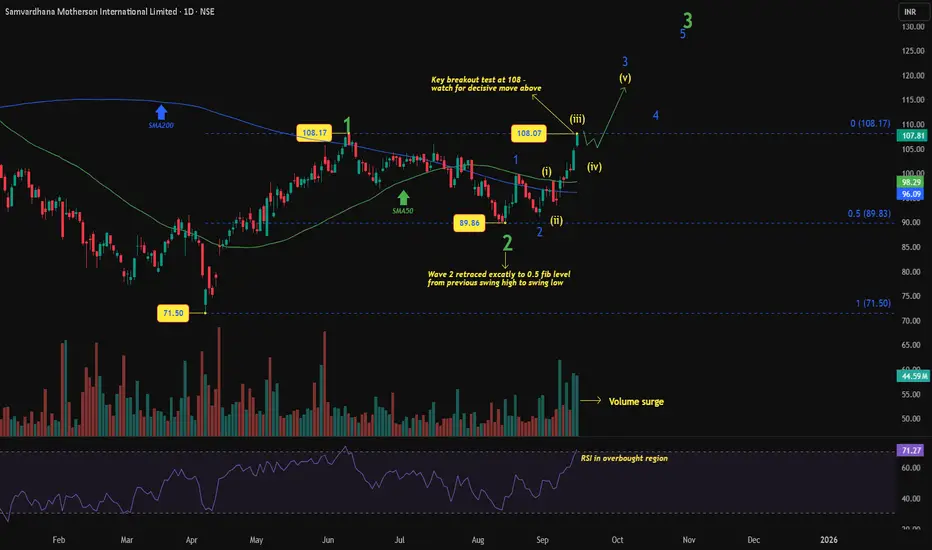
Samvardhana Motherson: Breakout or Double Top?Samvardhana Motherson has been carving a clean Elliott Wave structure since bottoming at ₹71.50.
Wave count : Wave 1 peaked at 108.17, followed by a textbook Wave 2 retracement to ₹89.86 (near the 0.5 Fib).
Current leg : Price has surged from Wave (ii) into 108, likely completing Wave (iii) of 3. A short Wave (iv) pullback would be natural before an eventual breakout in Wave (v) of 3.
Momentum factors : Strong volume surge supports the impulsive setup, while RSI in the overbought region suggests cooling off in the near term.
Moving averages : Price is now above both SMA50 and SMA200, the trend bias has turned positive, and moving averages may act as support on any pullback.
Summary : 108 is the make-or-break level. A brief consolidation is possible, but a sustained breakout above this zone in Wave (v) would confirm the Wave 3 extension.
Disclaimer: This analysis is for educational purposes only and does not constitute investment advice. Please do your own research (DYOR) before making any trading decisions.
ETH Setup You Can't Ignore:4k FVG to 5k Seller Zone ⚠️ ETH Setup You Can’t Ignore: 4K FVG to 5K SELLER ZONE!
ETHUSD – Fair Value Gap & Liquidity Sweep Setup
Ethereum is trading within a critical range, presenting a potential ICT-style setup:
Fair Value Gap (4000–4200) – Key demand zone with a “Golden Line” midpoint; price may dip to fill this imbalance before reversing.
Seller Zone (~5000) – Major supply zone where profit-taking or distribution could trigger.
Bias – Expect a sweep of downside liquidity, a reaction within the FVG, and a possible rally toward the 5000 zone if higher timeframe confluence supports it.
⚠️ Always wait for confirmation and manage risk before execution.

Trading Analysis for Gold Spot / U.S. Dollar (15-Minute Chart)Buy XAU/USD now at 3644.00 level and hold at 3631.00 and target will be specific.
Entry Range 3642.00 to 3644.00
Take Profit 1 = 3646.00
Take Profit 2 = 3650.00
Take Profit 3 = 3654.00
Take Profit 4 = 3658.00
Stock Loss 3631.00
Key News Timings Chart Per.
i will try to update continue.

Nifty 50 – Bearish Engulfing at 25,150, Eyes on FedNifty rallied into the 25,150 zone and immediately met resistance. The daily chart printed a bearish engulfing candle , a textbook reversal signal after a short-term rally. From a pure price-action perspective, this suggests caution as bulls lose momentum at a key supply zone.
However, context matters. The Fed interest rate decision on 17th Sep night is the big catalyst ahead. Until then, markets may prefer to stay rangebound rather than commit to a direction.
Derivatives data backs this:
Heavy Call OI at 25,100–25,200 creates resistance.
Strong Put OI at 25,000 provides support.
With PCR near 1.0, the bias leans neutral-to-cautious.
In short: the bearish engulfing is valid, but expiry flows (16th Sep) and the Fed decision (17th Sep night) will decide whether this turns into a deeper pullback or gets invalidated by a breakout.

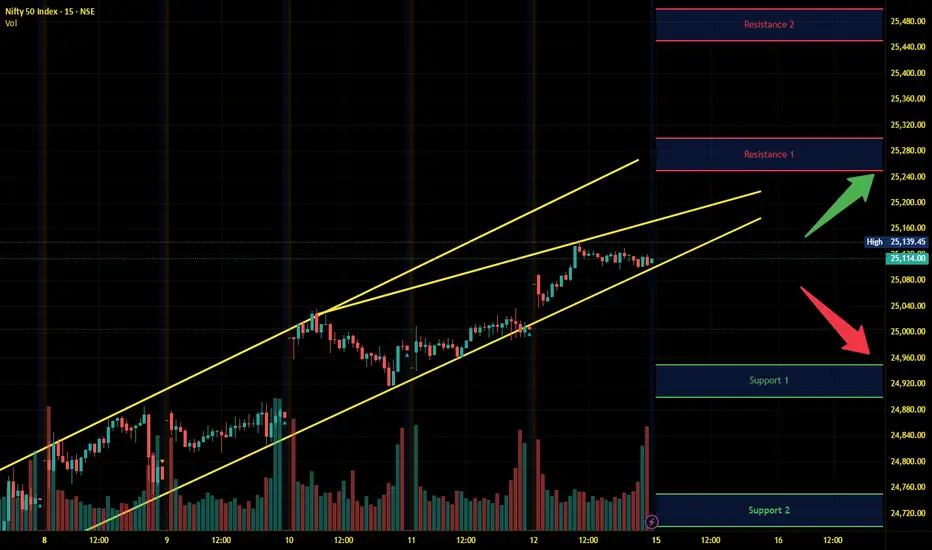
Nifty Intraday Analysis for 15th September 2025NSE:NIFTY
Index has resistance near 25250 – 25300 range and if index crosses and sustains above this level then may reach near 25450 – 25500 range.
Nifty has immediate support near 24950 – 24900 range and if this support is broken then index may tank near 24750 – 24700 range.
Banknifty Intraday Analysis for 15th September 2025NSE:BANKNIFTY
Index has resistance near 55250 – 55350 range and if index crosses and sustains above this level then may reach near 55750– 55850 range.
Banknifty has immediate support near 54350 - 54250 range and if this support is broken then index may tank near 53850 - 53750 range.
Finnifty Intraday Analysis for 15th September 2025NSE:CNXFINANCE
Index has resistance near 26500 - 26550 range and if index crosses and sustains above this level then may reach near 26700 - 26750 range.
Finnifty has immediate support near 26200 – 26150 range and if this support is broken then index may tank near 26000 – 25950 range.

Nifty - Expiry Day Analysis Sep 16Price is moving within the range 25000 - 25150. We got choppy moves in this area as there is no trend strength. Price has to bounce from the 25040 level or have to break 25150 with strength to continue the bullish trend. Otherwise, we will get a range move.
Buy above 25040 with the stop loss of 24990 for the targets 25080, 25120, 25160, and 25220.
Sell below 24940 with the stop loss of 24990 for the targets 24900, 24860, 24820, and 24740.
Expected expiry day range is 24950 to 25240.
Always do your analysis before taking any trade.

Midnifty Intraday Analysis for 15th September 2025NSE:NIFTY_MID_SELECT
Index has immediate resistance near 13200 – 13225 range and if index crosses and sustains above this level then may reach 13350 – 13375 range.
Midnifty has immediate support near 12975 – 12950 range and if this support is broken then index may tank near 12850 – 12825 range.
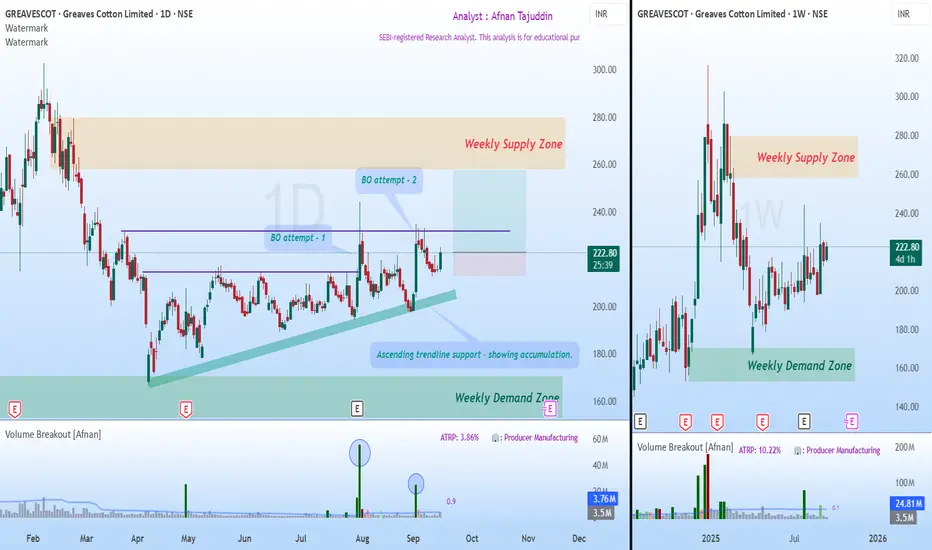
Accumulation and a Possible Breakout Towards Weekly Supply📈 Market Trend and Structure 📈
After forming an all-time high, price began its decline and developed a weekly supply zone . This supply zone now stands as the major target area for buyers.
Following the decline, price touched the weekly demand zone , which acted as a powerful reversal point . As supply-demand traders, this gave us a strong indication of the probable bottom.
From there, price recovered and moved into a phase of sideways consolidation , reflecting the tug of war between buyers and sellers.
⚡ Breakout Attempts and Trendline Support ⚡
During this consolidation, price attempted two breakouts with strong volumes . Both times, sellers stepped in aggressively at the horizontal resistance line.
Buyers, however, showed resilience by consistently defending an ascending trendline . This steady support is a sign of accumulation and growing demand.
Recently, price and volume contracted , forming an inside candle —a balance between buyers and sellers.
Today, this inside candle was broken to the upside, which could make this third breakout attempt successful.
🎯 Trading Plan 🎯
Bias: Bullish continuation.
Entry Trigger: Two previous breakout attempts + today’s breakout of the inside candle.
Target: Weekly supply zone.
Stop Loss: Below the previous swing low.
Risk-to-Reward: Approximately 1:3, a favorable setup.
✨ In Short : Sellers are still active near horizontal resistance, but buyers are showing greater strength at higher lows. The breakout of today’s inside candle tilts the balance towards buyers, making this the most promising pre-breakout setup so far.
🚀💡 “In trading, patience to wait and courage to act make all the difference.”
Lastly, Thank you for your support, your likes & comments. Feel free to ask if you have questions.
⚡ Stay disciplined, trade smart, and let the charts guide your story! 📊✨
This analysis is purely for educational purposes and is not intended as a trading or investment recommendation. I am not a SEBI registered Analyst.
BOMBAY BUMRAH TRADINGBombay Burmah Trading Corp Ltd
1. forming support near the opening gap/discount zone and reversing with a bullish engulfing candle.
2. Price has broken the downtrend channel and confirmed a market structure shift (MSS) above ₹1900.
3. If sustained, momentum can carry it towards ₹2100+, while a close back below ₹1850 would weaken the setup

Gold faces early selling pressure | Main trend still Buy🟡 XAU/USD – 15/09 | Captain Vincent ⚓
🔎 Captain’s Log – News Context
FED rate cut probabilities this week :
-25bps : 96.4% (up from 89.1%).
-50bps : only 3.0% (down sharply from 10.9%).
Trump : Announced more sanctions on Russia, urged NATO to stop buying Russian oil; also emphasized “the possibility of significant FED rate cuts.”
Key event today : New York Manufacturing Index at 1:30 (US time).
⏩ Captain’s Summary : The sharp drop in -50bps expectations caused early selling pressure on Gold this morning. But overall, FED is still certain to cut rates and inflation is cooling → the bigger trend continues to favor Buy .
📈 Captain’s Chart – Technical Analysis
Storm Breaker (Resistance / Sell Zone) : 3665 – 3670 (Weak High & upper cap).
Golden Harbor (Support / Buy Zone) : 3623 – 3603 – 3587.
Market Structure :
On H1, Gold is moving within a tightening triangle with EqH and EqL .
Main trend stays bullish, but needs a retest of support before rallying toward 3665 – 3670.
🎯 Captain’s Map – Trade Plan
✅ Buy (priority)
Buy Zone 1
Entry: 3623 – 3625
SL: 3612
TP: 3640 – 3650 – 3660 – 3665+
Buy Zone 2 (FVG)
Entry: 3603 – 3605
SL: 3592
TP: 3620 – 3640 – 3655 – 3665
Deep Buy Zone
Entry: 3587 – 3590
SL: 3575
TP: 3610 – 3630 – 3650
⚡ Sell (short scalp at resistance)
Sell Zone
Entry: 3665 – 3670
SL: 3678
TP: 3655 – 3645 – 3635 – 36xx
⚓ Captain’s Note
“The Golden ship faces headwinds this morning as sailors reduce expectations for a -50bps cut. But the larger sail remains filled with dovish FED winds, steering the voyage north. Golden Harbor 🏝️ (3623 – 3603 – 3587) is the safe dock to gather strength. Storm Breaker 🌊 (3665 – 3670) may raise waves, suitable for short Quick Boarding 🚤 . The main journey still favors Buy , waiting for the FED to blow more tailwind into the Golden sails.”

HAL CMP 4745 Rectangle BOHAL CMP 4745 dated 12-9-2025
1. Rectangle BO 4750
Buy above 4750 SL 4625 target 4785-4815-4850-
4885-4900-4940-4975-5000-5035-5075-5100-5160
It is just a view Please trade at your own risk
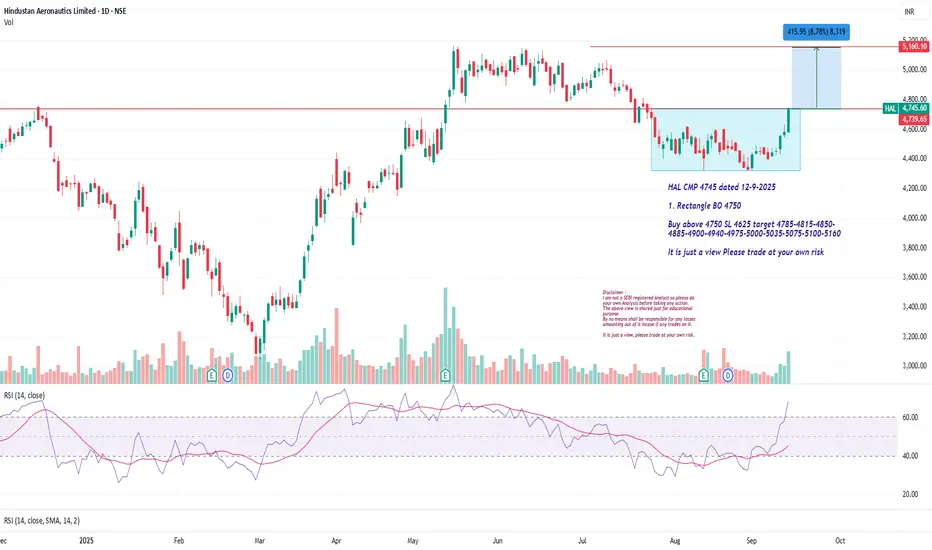
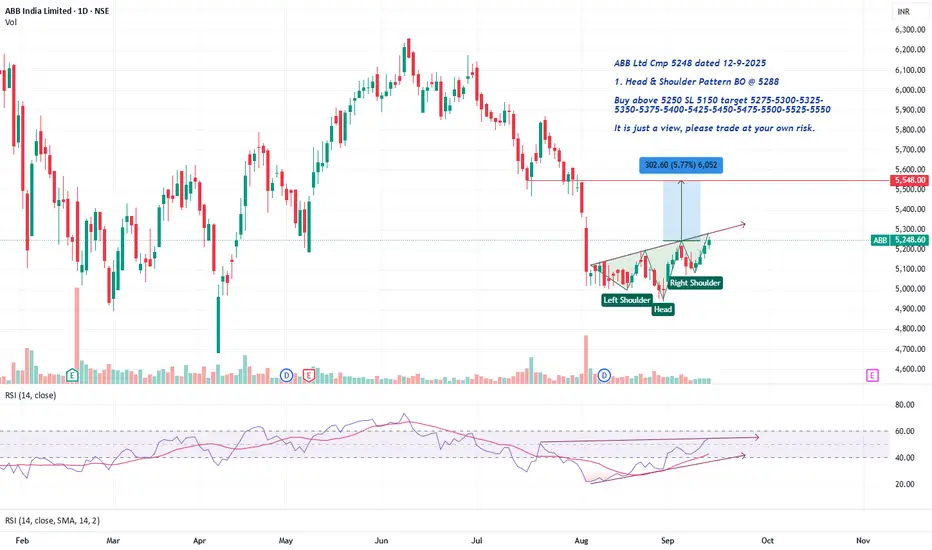
ABB Ltd Cmp 5248 Head & Shoulder Pattern BOABB Ltd Cmp 5248 dated 12-9-2025
1. Head & Shoulder Pattern BO @ 5288
Buy above 5250 SL 5150 target 5275-5300-5325-
5350-5375-5400-5425-5450-5475-5500-5525-5550
It is just a view, please trade at your own risk.
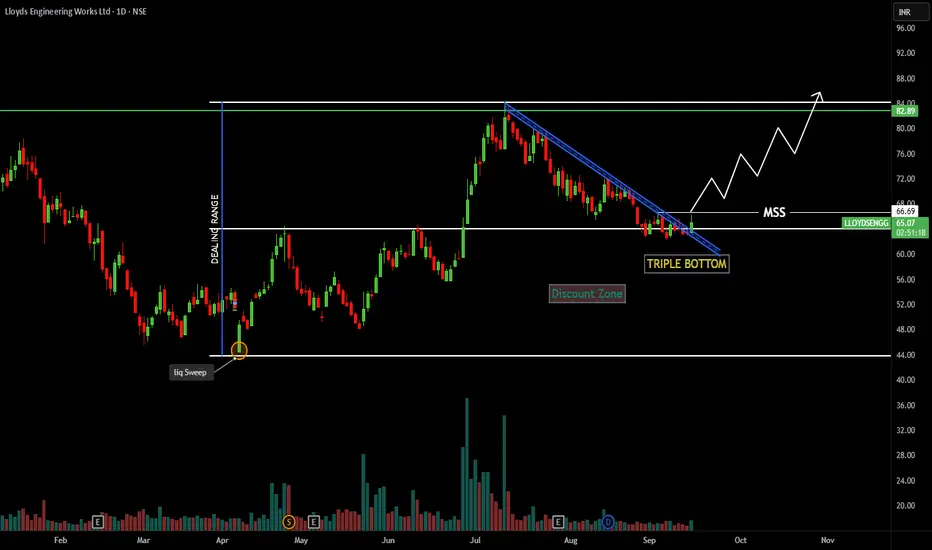
LLOYEDS ENGINEERINGPrice Structure:
Liquidity Sweep: Price earlier swept liquidity at the lows (highlighted in yellow circle), which often indicates smart money accumulation.
Dealing Range: Clear defined range with upper resistance near 82.89 and lower support around 44.
Discount Zone: Price traded back into the lower range (discount zone), offering institutional buying opportunity.
Triple Bottom Formation: Strong base formed near ₹60 zone – confirming demand.
📉 Recent Price Action:
A downtrend channel (blue trendline) was broken to the upside.
Today’s green candle shows bullish intent with increased volume.
Market Structure Shift (MSS): Price breaking above minor resistance signals buyers are regaining control.
📈 Future Outlook:
If the triple bottom holds and MSS sustains, stock may start a higher-high, higher-low rally.
First resistance: 72–74 zone (short-term target).
Major resistance: 82.89 (previous high / range top).
A breakout above ₹83 could open the way to ₹90+ levels.
⚠️ Risk Factors:
Breakdown below ₹60 will invalidate bullish setup (triple bottom fails).
Watch overall market sentiment and volume confirmation.