XAU/USD tests FvG; awaiting OB and trendline reaction.◆ Market Context
Price is moving within an ascending channel pattern. Each time it touches the upper resistance line, a downward reaction occurs. The most recent decline brought the price to the OB 4,189 area, which currently acts as support. The M30 structure shows the market is in a rebalancing phase after strong volatility.
◆ Price Action – SMC
• The decline from the channel peak created a Fair Value Gap (FvG), which is currently being filled.
• Price remains above the short-term ascending trendline; however, the recovery force is not strong enough to break the resistance area.
• OB 4,189 is the main holding area; if broken, the short-term ascending structure will be invalidated.
◆ Fibonacci & Reaction Zones
• Price is reacting at the Fibo levels 0.382 – 0.5.
• Fibo 0.618 around 4,230 coincides with the FvG area → this is an important resistance zone.
• Closing above 4,230 will trigger an expansion to higher levels.
Trading Plan
➤ Buy Scenario (priority if structure holds)
• Waiting area: 4,189 (OB) or lower trendline
• Condition: price holds the OB bottom and reversal signals appear
• Targets:
▪︎ 4,215
▪︎ 4,230 (strong resistance)
▪︎ expansion: 4,255 → 4,290
➤ Sell Scenario (if structure breaks)
• Condition: price breaks OB 4,189
• SL: above 4,200
• Targets:
▪︎ 4,175
▪︎ 4,165 (deeper support area)
➤ Strong Uptrend Continuation Scenario
• Condition: clear closing above 4,230
• Targets:
▪︎ 4,255
▪︎ 4,290
Summary
• OB 4,189 plays a crucial role in the short term.
• If OB holds, the price is likely to continue advancing to the resistance area 4,230 and beyond.
• If OB is broken, the adjustment target will head towards 4,165.
• The most reasonable action now is to wait for a clear reaction at OB or when the price approaches the 4,230 area.
Support and Resistance

XAU/USD: Gold Rejected at 4,228, Risks Drop to 4,172Gold is struggling in its recovery efforts as prices continue to react negatively at the resistance zone of 4,228. Although the USD shows slight signs of weakening, the overall market sentiment remains cautious as investors await inflation data and new signals from the Fed next week.
In this context, the short-term structure indicates that gold is leaning towards a corrective downtrend – aligning with the sell strategy on the rebound.
📊 MMF Technical Outlook (M30)
🔸 1. Rising Wedge Pattern Has Broken Down
Gold has just broken the “rising wedge” pattern – a clear signal of weakening momentum. The current rebound is merely a retest of the broken structure zone, easily forming a lower high → continued decline.
🔸 2. Important Supply Zone
4,226 – 4,229 → Supply Zone + the starting point of the previous strong decline
If the price touches this zone with weak signals, sellers are likely to regain dominance.
🔸 3. Liquidity Zone – Price Attraction Target
4,172 – 4,173 → Liquidity zone + strong demand + wedge bottom
This is the zone where the market is likely to pull the price during the session.
🎯 MMF Trading Plan – Priority to SELL
▶️ Main Scenario – SELL on the rebound
If the price rebounds to the supply zone:
🔹 SELL zone: 4,226 – 4,229
🔹 SL: above 4,235
🔹 TP1: 4,190
🔹 TP2: 4,172 (main target)
Reason: Price retests the broken resistance + downward momentum remains strong → attractive R:R entry.
▶️ Alternative Scenario – Price drops directly
If the price does not rebound sufficiently to 4,228:
🔹 Wait for a small retest around 4,205 – 4,208 → SELL
🔹 Target remains 4,172
🧭 MMF Daily Bias
Preferred trend: Bearish as long as the price is below 4,228
Strategy: Sell on the rebound – target 4,172
Invalidation: M30 candle closes above 4,235
Note: Volatility may increase near important US news.

Real-Time XAG/USD Chart Analysis: Bullish Momentum Builds TowardFOREXCOM:XAGUSD
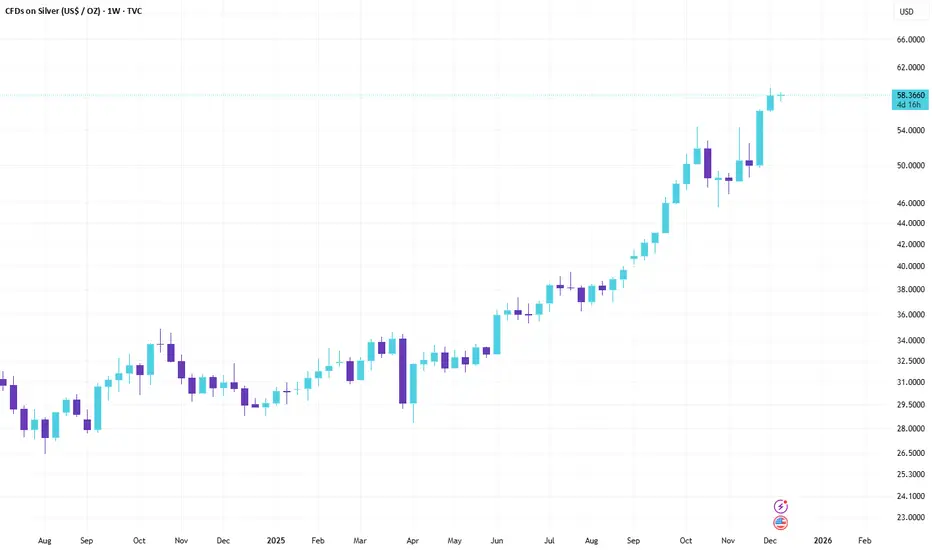
Real-Time XAG/USD Chart Analysis: Bullish Momentum Builds Toward $60
As of December 8, 2025 (Intraday: Early Trading)
Current Price: 58.31 USD (Down ~0.08% from previous close of 58.36; trading range: 57.59–58.74)
Asset: XAG/USD (Silver Spot vs. US Dollar)
Key Context: Silver's consolidating just shy of its all-time high of 59.42 hit earlier this week, with fresh ETF inflows and tightening physical inventories underscoring the uptrend. Amid Fed rate-cut bets and robust industrial demand (solar, AI), the technical setup leans Strong Buy—a pullback could be a gift for longs eyeing new records.
Quick Macro Snapshot
Tailwinds: Weaker USD from softer PCE inflation and labor data, plus record SLV ETF inflows (highest in 10 years). Supply crunch on Shanghai exchanges at multi-year lows, with green tech demand projected to drive deficits. Silver's 2025 YTD gains now at ~83%, outpacing gold's rally.
Headwinds: Overstretched speculative positioning could spark profit-taking; hawkish Fed signals next week might cap upside if yields rebound.
Technical Breakdown
Pulling from daily and 4H charts, the bias is firmly bullish despite minor intraday dips:
Trend & Moving Averages (Strong Buy):
Daily: Price well above rising 200-day EMA (~55.00) and 50-day EMA (~50.00), with all major MAs aligned bullish. 200-hour EMA at 56.30 provides dynamic support.
4H: Golden cross intact on EMAs; buyers defending the ascending channel.
Implication: Uptrend channel from October lows holding; retest of $59+ imminent on volume pickup.
Momentum Indicators (Neutral with Bullish Tilt):
RSI (14): 50.82 (Neutral)—cooled from overbought but no divergence yet, leaving room for extension.
MACD (12,26): Recently slipped negative below zero line (bearish histogram), signaling short-term downside momentum, but line still above signal overall.
Stochastics (9,6): ~65 (Buy territory); not overbought.
CCI (14): Neutral (~0); Williams %R: -45 (Mild buy).
ADX (14): 28 (Moderate trend strength, bullish direction).
Implication: Momentum pausing after the ATH push, but neutral RSI avoids sell signals—watch for bullish crossover.
Volume & Volatility:
ATR (14): ~0.85 (Elevated vs. recent avg., indicating volatility spike post-breakout).
Bull/Bear Power: Bulls dominant (+0.45), with options flow heavy on calls.
Pivot Points & Key Levels (Classic):LevelPriceTypeR359.50ResistanceR259.20ResistanceR159.00ResistancePivot58.15NeutralS157.50SupportS256.50SupportS356.20Support
Support Cluster: 56.20–56.50 (200h EMA + key zone; break below eyes 55.25 weekly support).
Resistance: 59.00–59.35 (recent ATH; clear for $60+ push).
Fibonacci: 61.8% extension from Oct lows targets 60.50.
Weekly Outlook
Broader uptrend: Strong Buy on MAs; Triangle pattern resolving higher, with potential test of 55.25 support before rally to 60.65–68.05. YTD doubling makes $65 realistic if Fed cuts materialize.
Risk: Drop below 56.20 could accelerate to 54–55 (prior resistance-turned-support), but low probability amid deficit forecasts.
Bias: Buy the dip—industrial tailwinds and ETF momentum point to $60 by quarter-end.
Trade Takeaway: Long above 58.15 pivot (stop below 56.50). Target R1 at 59.00 for 1:2 risk/reward. Squad, silver's stealing gold's thunder—$60 next, or Fed-induced pause? What's your play? #XAG #SilverAnalysis #SignalSquad
Real-Time XAU/USD Chart Analysis: Strong Buy Momentum IntactTVC:GOLD
Real-Time XAU/USD Chart Analysis: Strong Buy Momentum Intact
As of December 8, 2025 (Last Close: Sunday Market Pause)
Current Price: 4,215.66 USD (Up ~0.43% from previous close of 4,197.13)
Asset: XAU/USD (Gold Spot vs. US Dollar)
Key Context: With markets closed for the weekend, we're analyzing Friday's close and intraday action. Gold's safe-haven bid remains robust amid sticky inflation and geopolitical whispers, but watch USD strength post-NFP. Overall technical verdict: Strong Buy across moving averages and indicators—bullish continuation likely on Monday open.
Quick Macro Snapshot
Tailwinds: Central banks hoarding (record buys in Q4), weakening real yields, and equity volatility funneling flows into XAU. Correlation with DXY at -0.85 signals upside if dollar dips.
Headwinds: Potential Fed pivot delay could cap gains; Bitcoin's pullback dragging risk assets.
Technical Breakdown
Drawing from hourly and daily charts, here's the pulse:
Trend & Moving Averages (Strong Buy):
Daily: All major MAs (5, 10, 50, 100, 200) flashing buy except MA20 (sell at 4,215.96). Price above key 200-day MA (4,194.69)—bullish structure intact.
Hourly: 11 buys vs. 1 sell; golden cross forming on shorter EMAs.
Implication: Uptrend channel holding; next leg up if breaks 4,225.
Momentum Indicators (Mixed but Bullish Tilt):
RSI (14): 52.18 (Neutral)—room to run without overbought heat.
MACD (12,26): 0.12 (Buy)—line above signal, histogram expanding positively.
Stochastics (9,6): 66.19 (Buy); StochRSI at 93.53 (Overbought—watch for pullback).
CCI (14): 62.32 (Buy); Williams %R: -54.65 (Neutral).
ADX (14): 24.65 (Sell—weak trend strength, but not reversing).
Implication: Momentum building, but overbought StochRSI hints at minor consolidation before push to 4,250.
Volume & Volatility:
ATR (14): 13.45 (Low volatility—coiling for breakout).
Bull/Bear Power: +6.54 (Bulls in control).
Pivot Points & Key Levels (Classic):LevelPriceTypeR34,233.63ResistanceR24,225.40ResistanceR14,221.25ResistancePivot4,213.02NeutralS14,208.87SupportS24,200.64SupportS34,196.49Support
Support Cluster: 4,208–4,200 (watch for bounce here on open).
Resistance: 4,221–4,225 (breakout target for 4,233+).
Fibonacci aligns: 61.8% retrace at 4,208 (strong hold).
Weekly Outlook
Broader uptrend: Strong Buy on MAs; price testing all-time highs near 4,300.
Risk: If slips below 4,196 (S3), eyes on 4,150 psychological.
Bias: Accumulate dips—target 4,300 by year-end if yields stay soft.
Trade Takeaway: Long bias with entry above 4,213 pivot (stop below 4,200). Risk/reward skews 1:2+ to R2. Squad, gold's grinding higher—geopolitics could ignite Monday fireworks. What's your level? #XAU #GoldAnalysis #SignalSquad

XAU/USD: Buy at 4.19x, Sell Short at OB 4.24x1. Market Context (H1)
Gold is moving within a corrective structure after the previous strong rally. The current price action revolves around two main zones:
Buy Support Zone 4,197–4,200: where the price continuously reacts, with multiple BoS – ChoCH increases → indicating that buying pressure still maintains the base.
OB Zone – Sell 4.24x: confluence of Fibonacci 0.5 – 0.618 – 0.786, a zone likely to see a decline reaction before forming a larger trend.
The current structure leans towards a recovery to the OB Sell zone, after which the market may continue to adjust deeper to create liquidity before rising again.
2. Important Technical Zones
🔹 Support – Buy Zone: 4,197 – 4,200
This is a strong price base, where BoS + ChoCH continuously form.
Only when breaking below this zone → the short-term uptrend structure weakens.
🔹 OB Zone – Sell: 4,238 – 4,245
Confluence of Fibonacci retracement (0.5–0.618–0.786).
A favorable zone for the market to create a decline reaction, triggering a liquidity sweep to lower lows.
🔹 Strong Low: 4.17x
This is an important low – if the price sweeps here but does not break → expect a strong rebound to higher targets.
3. Trading Scenarios According to Structure
🔸 Scenario 1: Price recovers to OB Sell 4.24x → look for short-term SELL signals
Wait for the price to hit the OB Sell zone and appear:
Strong rejection candle
ChoCH decreases on M15 frame
Volume increases at the peak
Then expect a decline back to the Support Buy zone 4,197–4,205.
Trading idea:
Sell zone 4,238–4,245
Target: 4.20x
If breaking 4.20x deeply → extend to Strong Low 4.17x
🔸 Scenario 2 (high priority): Buy at Support to catch the rise to 4.25x – 4.27x – 4.29x
After completing the decline according to scenario 1, the price may rebound from the strong demand zone.
BUY conditions:
Price sweeps down to 4,197–4,205 or deeper to 4.17x.
Reversal pattern appears + ChoCH increases.
Recreate HL (higher low) structure.
Targets:
TP1: 4,234
TP2: 4,244
TP3: 4,258
Extended TP: 4,276 – 4,299 (Fibo 1.272 – 1.618)
4. Risk Management Notes
Do not chase Buy when the price is in the OB Sell zone – easy to get swept.
Do not Sell deeply when not reaching OB 4.24x zone – price has not entered a nice premium zone.
Always clearly define invalidation levels:
BUY invalid when price closes H1 below 4.17x.
SELL invalid when price breaks strongly above 4,245 and holds.

BTC Long Term ViewFollowing different long-term trendlines and trying to identify support and resistance levels.

Weekly Wrap : #Nifty50 Bulls are here to stay? First Step of a successful trader is to build a Trade plan & review what he has done. (education purpose for all )
*Trend is up.
*Trade plan: Buy on Dip
* Critical Levels:
* Resistance:26300/26470
* Support: 26060/25950
Jai Hind.
Disclaimer :
This video is only for educational purposes. Please consult your financial advisor before you take any trade.

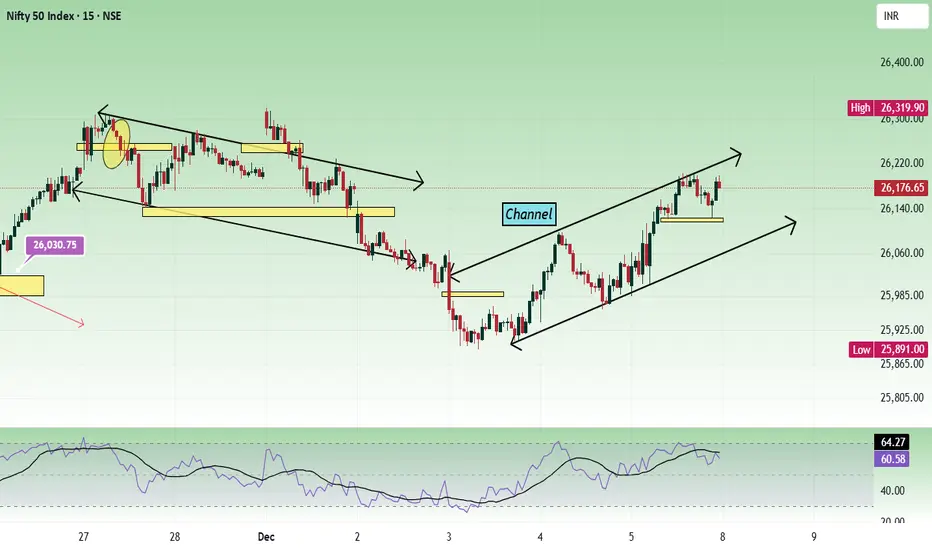
Nifty - Weekly review Dec 8 to Dec 12We can see two types of channels in the chart. Channel resistance and double top resistance is at the 26200 - 26220 zone. 26320 is another resistance. Since we can see 2 resistances nearby, and if the price is unable to gain strength, this zone can be choppy. As long as the price is above 26000, it is buy on dips unless the price falls with strong bearish strength.
Friday's movement was bullish as per the daily chart.
Buy above 26100 with the stop loss of 26050 for the targets 26140, 26180, 26240, 26300, 26360, 26420 and 26480.
Sell below 25900 with the stop loss of 25960 for the targets 25860, 25820, 25760, 25700, 25660, and 25600.
Always do your analysis before taking any trade.
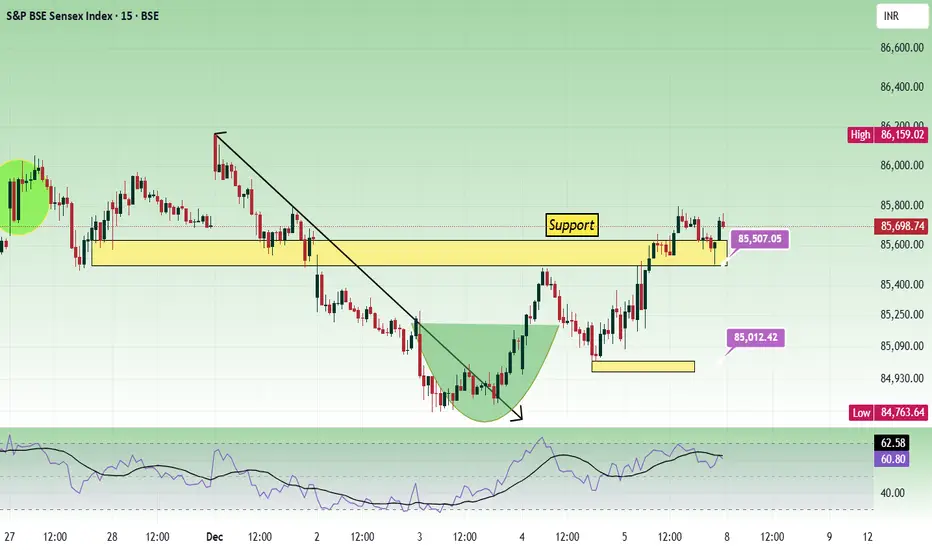
Sensex - Weekly review Dec 8 to Dec 12The price has reached the target of the rounding bottom pattern. And it is near the support zone 85500. Next nearby resistance is at 86000 - 86100.
Buy above 85620 with the stop loss of 85500 for the targets 85740, 85860, 85980, 86100, 86260, 86340 and 86480.
Sell below 85400 with the stop loss of 85540 for the targets 85280, 85140, 85020, 84880, 84740 and 84580.
Double top resistance is seen at the 86150 zone. Profit booking can happen at that level.
Always do your analysis before taking any trade.
Titan on 1W TF1. Titan have taken support on long term support zone for 3 times.
2. Near support zone, it have formed bullish candlestick patterns.
In May 2025, it have formed Bullish Morubozu like candle which was last hit to support zone.
3. In first week of July 2025, there was a strong bearih candle with volume, despite that, stock have sustained near 3400 levels by consolidation and then have bounced back with 2 Bullish belt-holds in the bounce and have tested the long term resistance zone.
And now have retraced around 50%(July - Aug move).
4. Now the current levels are make or break levels, short term trend will be confirmed, bearish or bullish as per the move from these levels (50% zone).
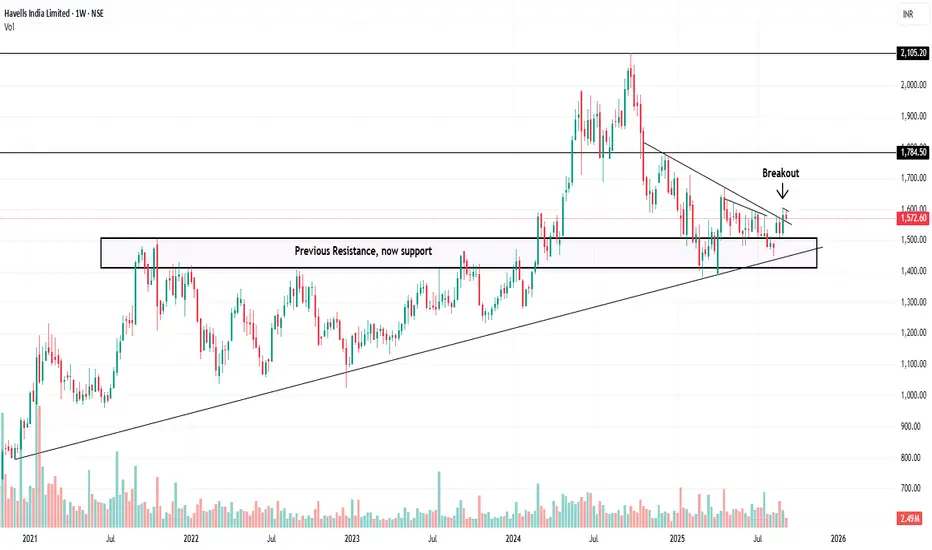
Probability wise looks like it may take support, previous resistance zone should act as support as per price action.
Let's see how it moves further.
Disclaimer: This is not any stock tip/advice to buy or sell. Invest on your own risk.

Simple Trend Analysis with BreakoutDisclaimer: This is just an a price action analysis of stock Tata Motors. Don't consider this as an stock tip or advice. Invest/Trade at your own risk.
L&T on 1W TimeframeStuck in zone for quit a while, now looks like it may show good momentum in upcoming weeks.
Disclaimer: This is just an a price action analysis of stock Tata Motors. Don't consider this as an stock tip or advice. Invest/Trade at your own risk.

BITCOIN 1HRSWING TRADE
- EARN WITH ME DAILY 10K-20K –
BITCOIN Looking good for Downside..
When it break level 88199 and sustain.. it will go Downside...
SELL @ 88199
Target
1st 83769
2nd 80539
Enjoy trading traders.. Keep add this STOCK in your watch list..
Big Investor are welcome..
Like this Post??? Hit like button..!!!
Follow me for FREE Educational Post and Alert..

Attacking the $91k Supply Wall – Breakout SetupBitcoin is currently compressing just below a major area of liquidity. As illustrated on the chart, the $91,100 - $91,300 zone has acted as stubborn resistance, resulting in multiple distinct rejections over the recent period (marked by the red arrows).
Technical Analysis:
The Resistance (Supply): We have seen price action fail to sustain momentum above the red resistance line ($91,140) multiple times. However, the repeated tests of this zone suggest that supply is being absorbed. The more often a level is tested, the weaker it typically becomes.
The Rejection vs. Compression: Despite the sharp rejections shown, BTC is maintaining its structure. The price is currently coiling, looking to challenge this level once more.
The Trigger: A high-volume breakout and candle close above $91,300 would invalidate the bearish order block and likely trigger a move toward the psychological $100k barrier.
If the bulls can finally clear this hurdle, there is very little overhead resistance preventing a run toward the target. Watch for volume confirmation upon the break of the red line.
Trade safe and manage your risk.

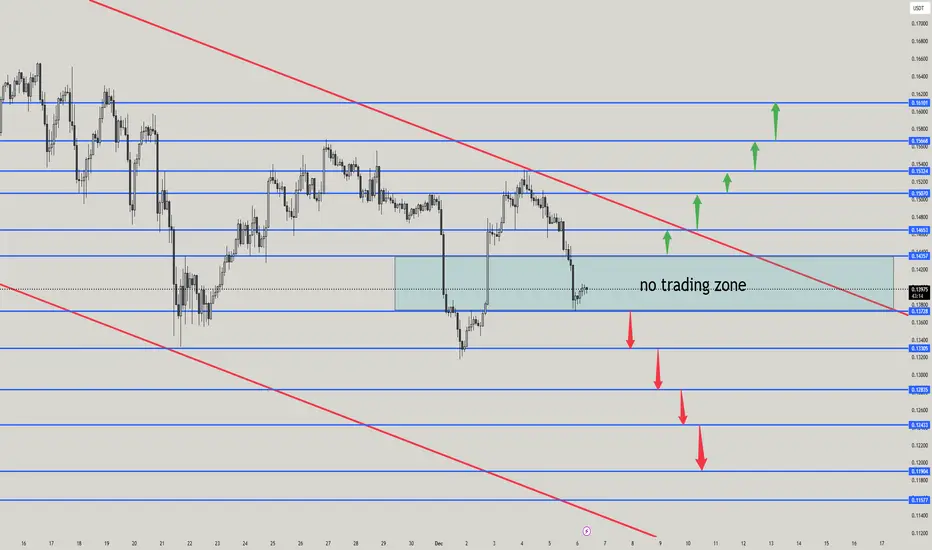
DOGEUSDT Technical analysisDOGEUSDT Technical analysis
✅ 1. NO-TRADE ZONE
The blue shaded box (≈ 0.1378 – 0.1450) is your No-Trade Zone.
Why No-Trade?
Price is inside a sideways compression zone with no clear trend.
Buyers and sellers are equal → high probability of fakeouts.
Best trades come only after breakout + retest from this zone.
🟢 2. BUY SETUP (Long Entries)
BUY ENTRY 1 (Aggressive)
Entry: Above 0.1455
Why:
Breaking out of the no-trade zone
Breaking above downward red trendline
First confirmation that buyers are in control
SL: 0.1424
TP1: 0.1500
TP2: 0.1532
TP3: 0.1568
TP4: 0.1609
BUY ENTRY 2 (Safe Retest Buy)
Entry: Retest of 0.1500 after breakout
Why:
Key resistance → once broken, acts as strong support
Retest = low-risk entry
SL: 0.1470
TP1: 0.1532
TP2: 0.1568
TP3: 0.1609
TP4: 0.1622
🔴 3. SELL SETUP (Short Entries)
SELL ENTRY 1 (Breakdown Sell)
Entry: Below 0.1338
Why:
Clean break below structure
Leaving the no-trade zone to downside
Lower low confirms bearish continuation
SL: 0.1378
TP1: 0.1324
TP2: 0.1283
TP3: 0.1243
TP4: 0.1199
SELL ENTRY 2 (Retest of broken support)
Entry: Retest of 0.1378 from below
Why:
Broken support becomes resistance
Best risk–reward for downside continuation
SL: 0.1405
TP1: 0.1338
TP2: 0.1324
TP3: 0.1283
TP4: 0.1243
💡 Why These Levels? (Price-Action Logic)
🟢 Buy Levels
All your green arrows match previous rejection zones.
When price breaks above these, market shows shift from lower highs → higher highs.
Breakout of the red trendline = trend reversal signal.
🔴 Sell Levels
Your red arrows sit on previous demand zones.
Once broken, these become supply zones, ideal for short selling.
Downtrend channel (red lines) confirms bearish continuation targets.
🛑 FINAL TRADING PLAN SUMMARY
NO TRADE
0.1378 – 0.1450
BUY ABOVE
0.1455
Targets: 0.1500 → 0.1532 → 0.1568 → 0.1609 → 0.1622
SL: 0.1424
SELL BELOW
0.1338
Targets: 0.1324 → 0.1283 → 0.1243 → 0.1199
SL: 0.1378
OBV + MACD Confirmed FVG📉 Bitcoin – Bearish FVG Retracement With EMA200, OBV & MACD Momentum Confluence
This chart highlights a clean bearish structure on BTC, defined by a consistent sequence of Lower Highs (LH) and Lower Lows (LL). Throughout this downtrend, multiple Fair Value Gaps (FVGs) have formed — each created by sharp institutional displacement that leaves behind inefficiencies in price.
As price continues trending below the EMA200, bearish order flow remains firmly intact. Each time BTC retraces into an unmitigated FVG, the market efficiently rebalances the imbalance before resuming downward continuation.
In this setup, the integration of FVGs + EMA200 + OBV + MACD Histogram builds a high-probability roadmap for identifying premium retracement zones and anticipating continuation moves.
The major FVG above current price sits directly under the EMA200 and aligns with weakening OBV momentum. This makes it the most structurally significant bearish reaction zone. A secondary FVG exists below it, but carries less importance due to weaker displacement and reduced confluence.
⸻⸻⸻⸻⸻⸻⸻⸻⸻⸻
📊 Key Observations
1️⃣ Prior Bearish FVG Reaction
A previously formed bearish FVG was cleanly mitigated, followed by immediate downside continuation.
This confirms that institutional order flow remains bearish and that FVG zones are functioning as efficient retracement magnets in the current trend.
2️⃣ High-Priority FVG Under EMA200 (Primary Zone)
This upper FVG has the strongest confluence:
Formed by strong bearish displacement
Sits directly below the EMA200, reinforcing trend direction
Aligns with market structure (LH → LL sequence)
OBV shows weakening buying pressure as price approaches the zone
MACD histogram is decreasing into FVG, signaling bearish momentum shift
This makes it the most likely level for a significant rejection if price retraces into it.
3️⃣ Secondary FVG Reaction Zone
A lower FVG also exists, but:
Formed during a smaller displacement
Does not align with EMA200 rejection
Carries weaker structural significance
It may still produce a minor reaction, but is lower probability compared to the primary FVG above.
4️⃣ OBV Momentum Context
OBV declines as price approaches the FVG, which is a critical confirmation.
When OBV decreases during a retracement, it signals absorption of buy-side pressure → strengthening the bearish continuation case.
5️⃣ MACD Histogram Confirmation
MACD histogram is rolling over and turning negative as price pushes toward the FVG.
This confirms bearish momentum returning, increasing the probability of a strong rejection from imbalance.
6️⃣ Structural Context
BTC maintains a clean LH–LL bearish sequence.
As long as price remains under the EMA200 and below the unmitigated FVGs, retracements are more likely to act as rebalancing moves rather than true reversal attempts.
⸻⸻⸻⸻⸻⸻⸻⸻⸻⸻
📊 Chart Explanation
Symbol → BITSTAMP:BTCUSD
Timeframe → 1D
This visualization demonstrates how Smart Money Concepts and momentum indicators align within a trending environment:
Clear LH → LL market structure
Multiple historical FVGs acting as premium retracement zones
A previously mitigated FVG confirming downside continuation
A high-confluence bearish FVG below the EMA200
OBV weakness during retracement phases
MACD histogram declining into FVG retest
Together, these elements create a textbook sequence:
displacement → inefficiency → retracement → mitigation → continuation
Price remains bearish unless BTC can break and close above the upper FVG with strong momentum and volume.
⸻⸻⸻⸻⸻⸻⸻⸻⸻⸻
📘 How EMA200, OBV & MACD Strengthen FVG Setups (Bullish + Bearish)
🔹 1. Trend Filter: EMA200
Below EMA200 → look for bearish FVG rejections
Above EMA200 → look for bullish FVG reactions
EMA200 acts as a dynamic mean-reversion anchor during trending markets.
🔹 2. OBV + FVG
OBV declining on FVG retest → bearish continuation
OBV rising into bullish FVG → bullish continuation
Volume trend strengthens or invalidates FVG reactions.
🔹 3. MACD Histogram + FVG
Falling histogram → bearish FVG confirmation
Rising histogram → bullish FVG confirmation
MACD shows whether momentum aligns with the imbalance.
🔹 Combined Logic (Works Both Ways)
Displacement creates an FVG
Price retraces into the FVG
Trend filter (EMA200) agrees
OBV + MACD confirm volume + momentum direction
Price rejects and continues trend.
⸻⸻⸻⸻⸻⸻⸻⸻⸻⸻
✅ Summary
Market structure remains bearish with LH → LL continuity
A previously filled FVG validated downside continuation
The upper FVG is the highest-probability zone (EMA200 + OBV + MACD alignment)
The secondary imbalance carries lower significance
OBV and MACD both confirm weakening buyer pressure into FVG
As long as BTC stays below EMA200, retracements into FVG are likely continuation setups
⸻⸻⸻⸻⸻⸻⸻⸻⸻⸻
⚠️ Disclaimer
📘 For educational purposes only
🙅 Not SEBI registered
❌ Not financial or investment advice
🧠 Smart-Money-Concepts explanation only

Nifty Intraday Analysis for 05th December 2025NSE:NIFTY
Index has resistance near 26225 – 26275 range and if index crosses and sustains above this level then may reach near 26450 – 26500 range.
Nifty has immediate support near 25850 – 25800 range and if this support is broken then index may tank near 25625 – 25575 range.
Volatility expected on either side as per the RBI MPC outcome and growth forecast for financial year 2025-26.

Banknifty Intraday Analysis for 05th December 2025NSE:BANKNIFTY
Index has resistance near 59700 – 59800 range and if index crosses and sustains above this level then may reach near 60200 – 60300 range.
Banknifty has immediate support near 58900 - 58800 range and if this support is broken then index may tank near 58400 - 58300 range.
Volatility expected on either side as per the RBI MPC outcome and growth forecast for financial year 2025-26.

Finnifty Intraday Analysis for 05th December 2025 NSE:CNXFINANCE
Index has resistance near 27850 - 27900 range and if index crosses and sustains above this level then may reach near 28075 - 28125 range.
Finnifty has immediate support near 27425 – 27375 range and if this support is broken then index may tank near 27175 – 27125 range.
Volatility expected on either side as per the RBI MPC outcome and growth forecast for financial year 2025-26.

Midnifty Intraday Analysis for 05th December 2025NSE:NIFTY_MID_SELECT
Index has immediate resistance near 14000 – 14025 range and if index crosses and sustains above this level then may reach 14150 – 14175 range.
Midnifty has immediate support near 13750 – 13725 range and if this support is broken then index may tank near 13625 – 13600 range.
Volatility expected on either side as per the RBI MPC outcome and growth forecast for financial year 2025-26.

Gold Uptrend: Retest 4,211 to Surge to 4,236 → 4,254After the Asian session, gold continues to maintain a short-term upward structure as prices consistently create higher lows (HL) and remain trading above the rising trendline. The weakening USD due to expectations of a dovish Fed is also supporting the flow of funds back into precious metals.
Currently, the market is entering a "compression" zone below resistance, signaling signs of accumulation before a new expansion phase.
📊 Technical Outlook – MMF Flow (H1)
1️⃣ Key Supports
4,211 – 4,212 → important retest zone + trendline confluence + previous HL low.
4,187 – 4,188 → deeper support, strong previous buying zone.
When prices hold above 4,211 → short-term trend remains bullish.
2️⃣ Key Resistances / Liquidity Zones
4,236 → nearby supply zone, liquidity cluster.
4,254 – 4,255 → expansion target, large liquidity zone above.
Prices are reacting at the descending trendline, but the upward momentum remains in control.
🧭 Trading Scenario according to MMF
▶️ Main Scenario – BUY with the trend
Wait for price retest:
🔹 BUY zone: 4,211 – 4,213
🔹 SL: below 4,206
🔹 TP1: 4,236
🔹 TP2: 4,254
Logic: Price breaks the intraday down structure, creates higher HL, and is gradually approaching the descending trendline → high breakout potential.
▶️ Alternative Scenario – Deeper BUY
If the market "flushes" to take liquidity:
🔹 BUY at 4,187 – 4,189
TP similar to the main scenario.
🎯 Daily Bias Summary
Bias: Bullish when prices hold above 4,211.
Priority: BUY at retest → SELL only for short-term scalping.
Target: 4,236 → 4,254 is a liquidity zone that the market can easily be pulled up to sweep.

XAU/USD: Pullback to OB & Fibo, then upward trend!1. Market Cont1. Market Context
In the M30 timeframe, the price is in a correction phase after forming a strong bottom area around 4,192–4,195. From there, the market has generated a series of positive signals: the price line gradually moves higher, with consecutive CHoCH appearances, indicating weakening selling pressure and a shift in cash flow towards accumulation.
The resistance area of 4,230–4,240 remains a significant barrier. If it is broken with a clear closing candle, the upward structure will be confirmed, and the price may expand to higher areas.
2. Key Price Areas (SMC Mapping)
Upper Resistance
4,230–4,240: strong reaction area, acting as the first barrier.
4,255–4,256: the next expansion area when the upward trend is confirmed.
4,289–4,290: the final target in the expansion structure of the upward wave.
Support Area – Buying Point
4,200–4,216: OB combined with Fibo area, where the price may adjust to regenerate liquidity before rising.
4,192–4,195: strong low area, where the market has reacted strongly before.
3. Fibo & Price Action
In the current upward move, the price has approached the 0.786 Fibo and encountered resistance at 4,230–4,240. A correction to the 0.382–0.5 area (corresponding to OB 4,200–4,216) would be reasonable before the market continues to retest higher areas.
Notable price action signals:
The consecutive appearance of bullish CHoCH indicates that buying pressure is in control.
The 4,192 low is still protected and acts as an important low of the recovery phase.
If the price retests the OB cleanly, this is a good trigger point for a new upward move.
4. Trading Plan
Preferred Scenario: Buy according to structure
Buy Waiting Area: 4,200–4,216 (OB + Fibo)
Stop Loss: below 4,192
Targets:
4,230–4,240
4,255
4,289–4,290
Confirmation Conditions
The price needs to clearly break the resistance area of 4,230–4,240 to trigger upward momentum.
The retest of the OB must occur with reduced liquidity and a confirming candle pattern.
5. Summary
The market structure shows a short-term upward trend is forming. The price is likely to adjust to the 4,200–4,216 area before continuing upwards to 4,240 and further to 4,255–4,290.
The appropriate strategy is to wait to buy in the OB & Fibo area under the condition of clear confirmation signals.

XAU/USD: Gold Consolidates, Awaiting Pullback for Breakout📊 Market Structure (H1)
Gold is moving within a converging triangle pattern – with the bottom being pushed higher by buying pressure, while the top is continuously blocked by the H1 descending trendline.
After the previous strong decline, the market has consecutively created bullish ChoCH , indicating that capital flow is starting to return, but the pivotal supply remains at the OB Bearish 4.23x area – where the price is currently stuck.
Currently, the price is testing the upper edge of the triangle + supply area, which is primarily used for distribution and liquidity sweep. → Not an optimal area for FOMO BUY.
💎 Key Levels – Important Areas
• OB Bearish – 4.23x: confluence with descending trendline → high probability area for strong reaction or Liquidity Sweep.
• FVG – 4.21x: H1 price gap, the market tends to return to fill before continuing.
• OB Bullish – Buy Zone – 4.201: H1 demand + lower edge of current range → priority area to observe BUY according to trend.
• Liquidity Buy – 4.170: lower liquidity area → price may sweep deep before bouncing strongly if the medium-term uptrend remains effective.
• Upper Target – 4.25x: expanded target if gold successfully breaks the converging triangle.
🎯 Trading Plan – Trading Scenarios
1️⃣ Priority Scenario: Pullback to OB Bullish
If the OB Bearish 4.23x area reacts (wick rejection, reversal pattern, weakening momentum), expect the price to retreat to:
→ FVG 4.21x
→ OB Bullish 4.201
At the 4.20x area, if a bullish ChoCH / engulfing / strong pin bar appears, this will be a reasonable BUY area according to the trend.
Suggested TP:
• TP1: FVG 4.21x
• TP2: Retest OB Bearish 4.23x
• TP3 expanded: 4.25x area if price breaks the triangle
Invalidation: H1 closes below 4.195 → stay out and wait for reaction at Liquidity 4.170.
2️⃣ Alternative Scenario: Deep Sweep to Liquidity Buy
If OB Bullish 4.20x does not hold and the price breaks down strongly, do not catch the falling knife.
→ Wait for gold to reach Liquidity Buy 4.170
→ Observe reaction: long wick, selling pressure depletes, new HL formation…
Only BUY again when the signal is clear.
If the 4.170 area is broken strongly by an H1 candle → temporary uptrend structure loses effectiveness, reduce volume or stay out until the market stabilizes.
⚠️ Risk Management
This is a trading plan based on an idea – not an immediate entry signal.
Do not BUY directly at the 4.23x resistance area.
Be patient for a pullback to the discount area (4.20x – 4.17x) and always set clear risk.
“Liquidity tells the truth — structure confirms the path.” ⚜️
⏰ Timeframe: H1
✍️ Analysis by: Captain Vincent
