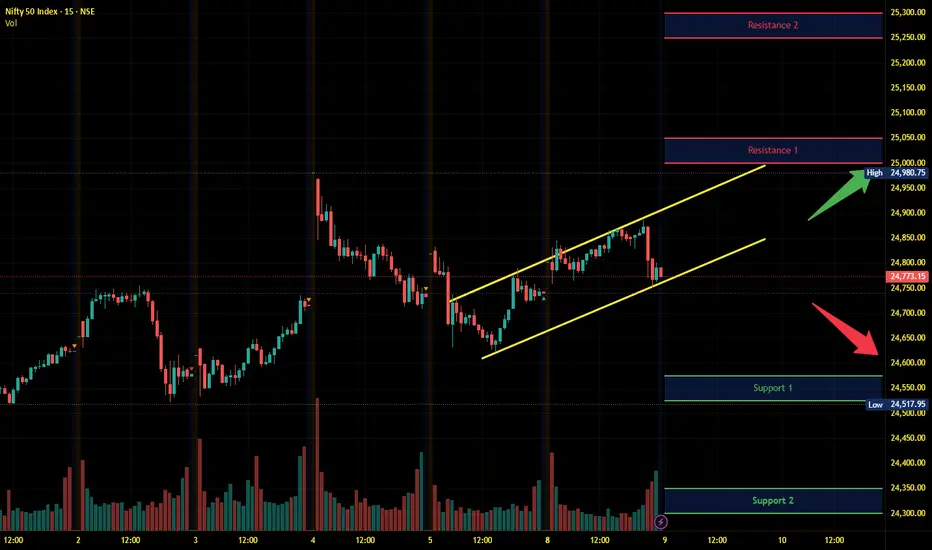
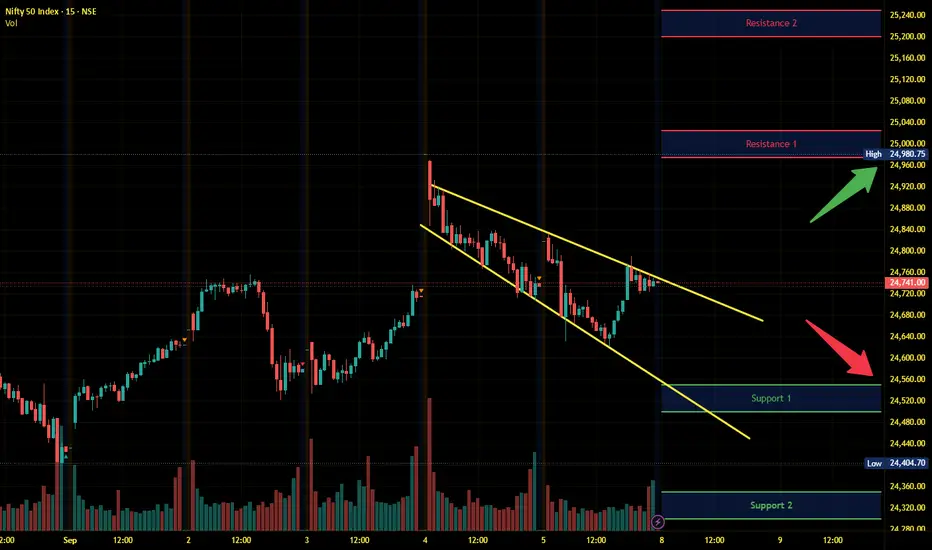
Nifty Intraday Analysis for 09th September 2025NSE:NIFTY
Index has resistance near 25000 – 25050 range and if index crosses and sustains above this level then may reach near 25250 – 25300 range.
Nifty has immediate support near 24575 – 24525 range and if this support is broken then index may tank near 24350 – 24300 range.
Support and Resistance
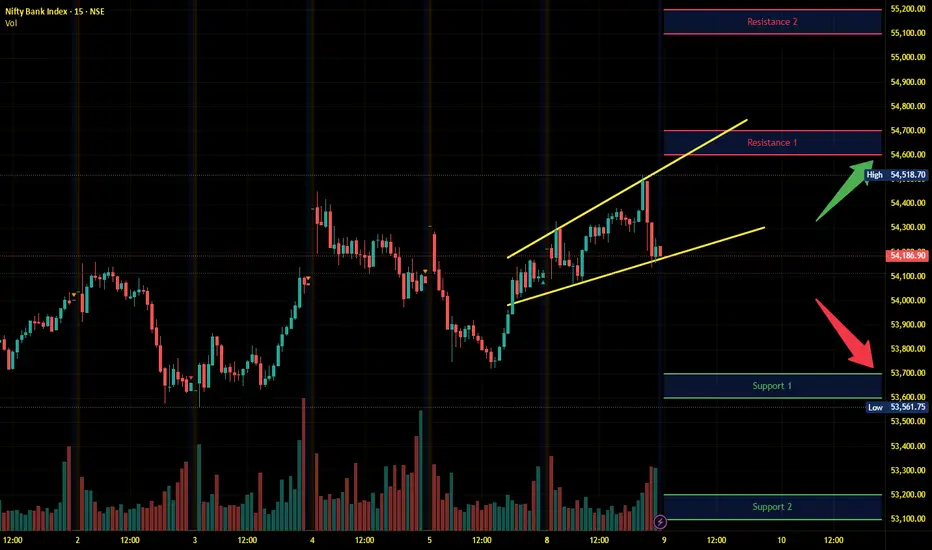
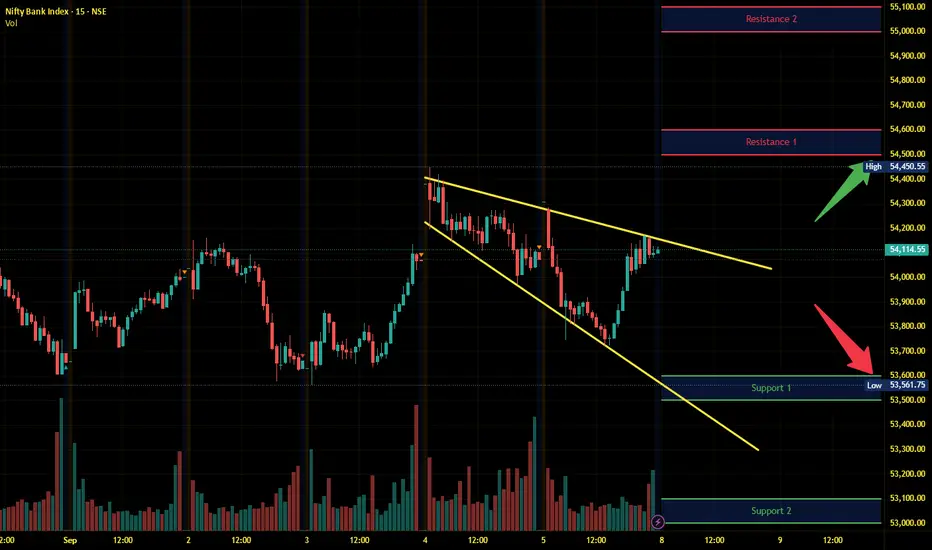
Banknifty Intraday Analysis for 09th September 2025NSE:BANKNIFTY
Index has resistance near 54600 – 54700 range and if index crosses and sustains above this level then may reach near 55100– 55200 range.
Banknifty has immediate support near 53700 - 53600 range and if this support is broken then index may tank near 53200 - 53100 range.
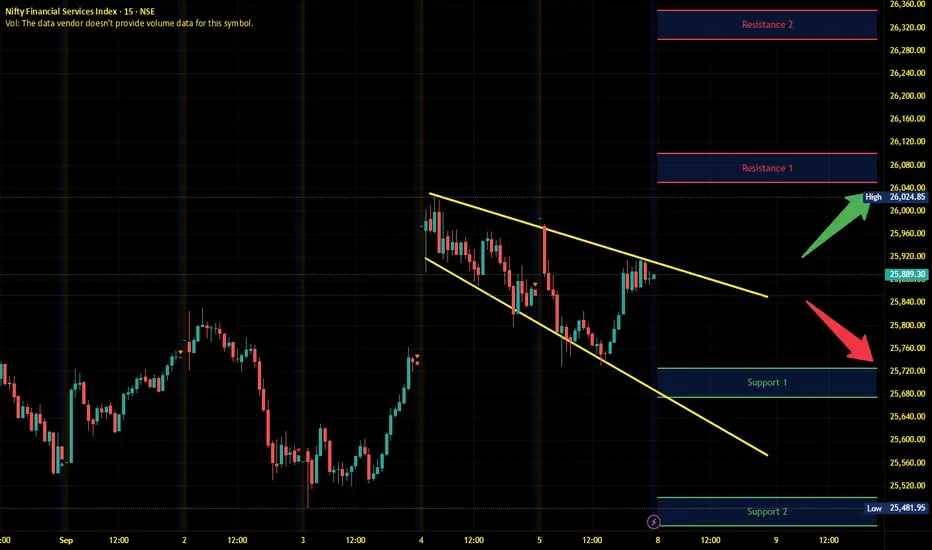
Finnifty Intraday Analysis for 09th September 2025NSE:CNXFINANCE
Index has resistance near 26100 - 26150 range and if index crosses and sustains above this level then may reach near 26300 - 26350 range.
Finnifty has immediate support near 25750 – 25700 range and if this support is broken then index may tank near 25550 – 25500 range.

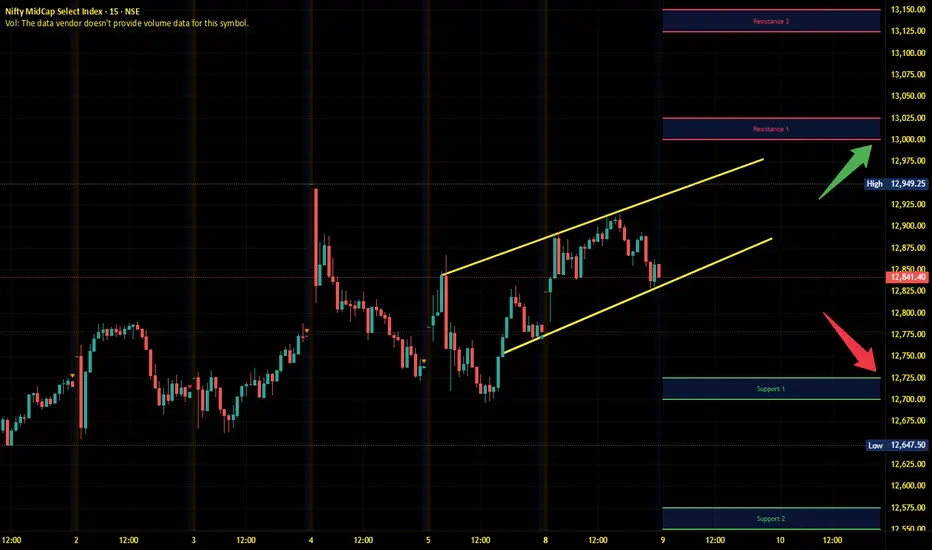
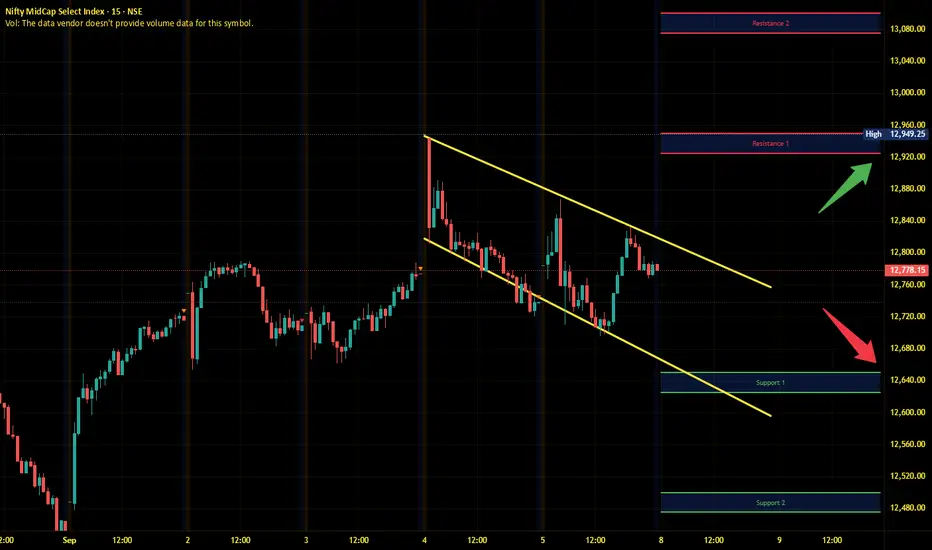
Midnifty Intraday Analysis for 09th September 2025NSE:NIFTY_MID_SELECT
Index has immediate resistance near 13000 – 13025 range and if index crosses and sustains above this level then may reach 13125 – 13150 range.
Midnifty has immediate support near 12725 – 12700 range and if this support is broken then index may tank near 12575 – 12550 range.
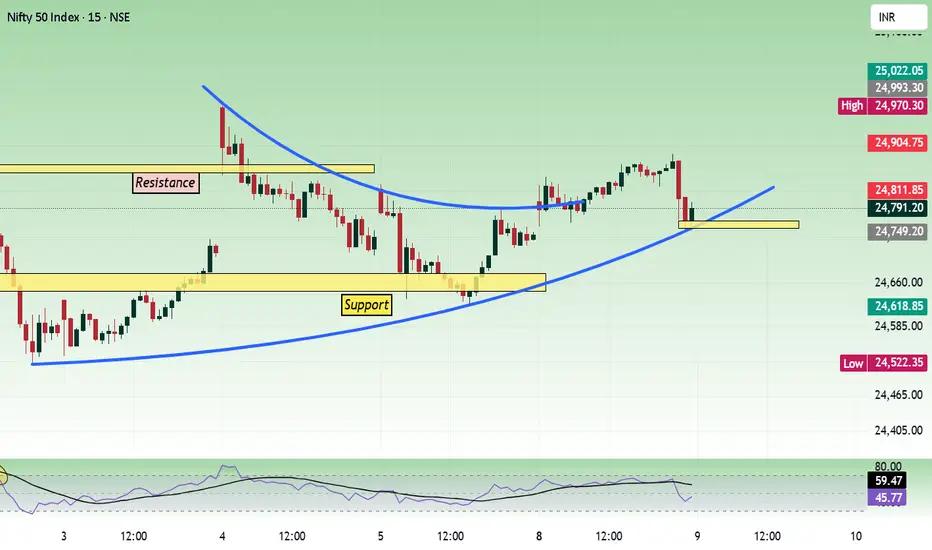
Nifty - Multi time frame analysis Sep 9Today, the price did not gain strength and moved in the range of 24700 to 24900. And 25000 is a psychological level. This type of nearby support/resistance can give choppy movement unless the price shows strength from the opening.
Support levels are 24500, 24600. Resistance levels are 24900, 25000.
We can buy if the price opens at support with bullish strength.
If the opening is flat, buy above 24820 with the stop loss of 24770 for the targets 24860, 24920, 24980, 25020, and 25080.
Sell below 24680 with the stop loss of 24730 for the targets 24640, 24600, 24540, 24500, 24460 and 24420.
As per the daily chart, the price is moving in a range, and it also has nearby trendline resistance.
Strong movement can happen if the trend line is taken with strength.
As per the hour chart, if the price does not gain strength when breaking the range it has formed today, then the expiry will be in range.
Expected expiry day range is 24400 to 24900.
Nifty Macro View & Context Weekly Outlook: Analysts expect rangMacro View & Context
Weekly Outlook: Analysts expect range-bound trading with continued consolidation under 25,000. Nifty rebounded from ~24,400 recently, but a breakout above 25,000 remains elusive. Toby-heavy cues are looking modestly optimistic, supported by domestic macro trends and auto sector strength.
F&O Expiry Dynamics: Weekly options now expire on Tuesday, meaning Monday becomes the new "expiry eve"—a day often marked by increased spot-vol vs. thin volumes and elevated theta (time decay) impact.
Recommended strategy: With limited move expected, options plays like short strangles can capitalize on low directional movement and theta decay.
Technicals Across Timeframes
1-Day (Daily Chart)
Overall tone: Neutral-to-cautious. Price is consolidating; indicators (like RSI & MACD) are flat—no strong directional bias.
4-Hour Chart
Current structure: Sideways rectangular consolidation, roughly between 24,400–25,000.
A breakout either way could define the weekly closing trend.
1-Hour Chart
Short-term setup: 70% of moving averages (20/50/100/200) show bullish bias, although some very short-term (5/10 MA) signals remain mixed — indicating stabilization above mid-range.
Pivot analysis shows key resistance near 24,852–24,875, and support near 24,750–24,730.
15-Minute Action Plan for Tomorrow (Expiry Eve)
Time-Based Setup (09:00–15:30)
Pre-Open to First 30 Minutes
Observe initial range; likely tight consolidation given expiry eve.
Key zone: 24,750–24,850 (intraday range).
Trade Execution Rules
Long Trade:
Trigger: 15-min candle closes above 24,850 with volume support.
Entry: Next candle's open (~24,860).
Targets: 24,900 → 24,950 → 25,000.
Stop-Loss: ~24,830.
Short Trade:
Trigger: 15-min candle closes below 24,750 with confirmation.
Entry: Next open (~24,740).
Targets: 24,700 → 24,650 → 24,600.
Stop-Loss: ~24,770.
Range Day Strategy (if neither breakout triggers)
Trade within the established 24,750–24,850 range.
Small scalps: buy near 24,760, sell near 24,840; stops tight (~5-10 pts).
Astral ltd Cmp 1462 H&S PatternAstral ltd Cmp 1462 dated 8-9-2025
1. H&S pattern BO above 1475
Buy above 1475 SL 1400 target 1490-1500-1510-
1525-1540-1550-1575-1590-1600-1610-1625-1650
1680
It is just a view, please trade at your own risk.

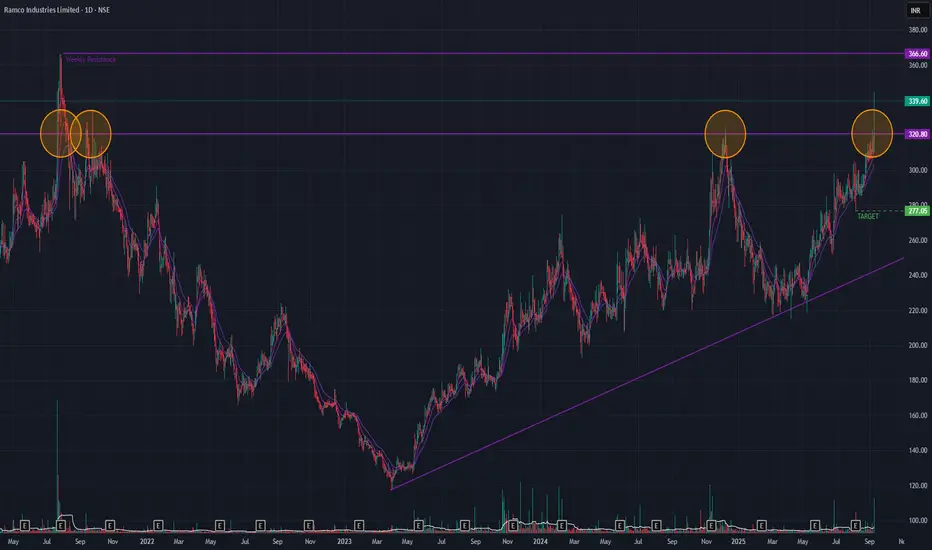
Ramco Ind (Daily Timeframe) - Is this a false BreakOut??Ramco BrokeOut of a multi-year resistance trendline (since 2000) today with huge volume and stock price zooming by 8.03%. The last time it BrokeOut of this trendline was in 2021 which did not sustain but the stock made a new ATH then. Short-term EMAs are in PCO state as well as EMAs & DMAs are in Golden Cross-over state.
On the upside the stock may reach 366 levels & on the downside the stock may reach 277 levels.
The price-action in the coming days will dictate how the stock moves. Keep monitoring.
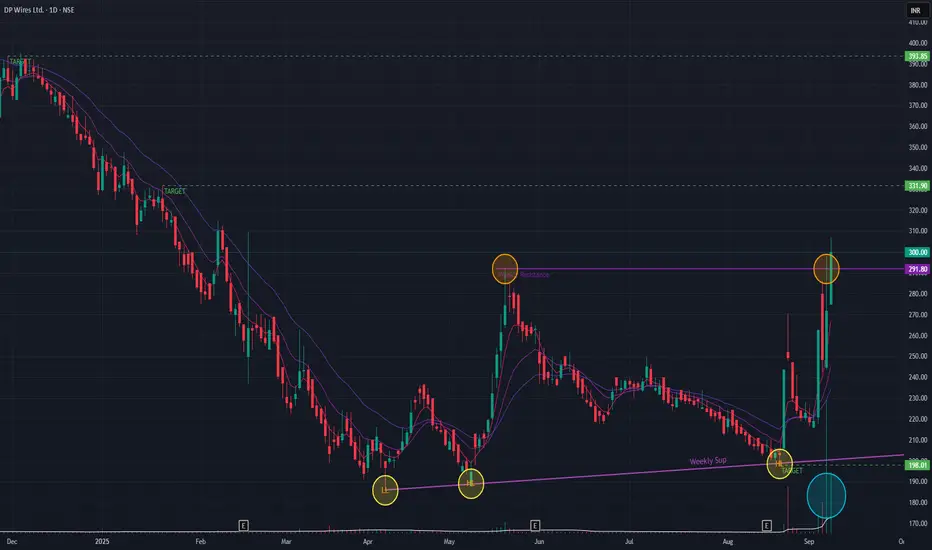
DP Wires (Daily Timeframe) - Can it sustain the momentum??DP Wires has been on a downtrend till Apr 2025 and ever since has been forming Higher Lows which is a bullish signal. Short-term EMAs are in PCO state. With today's bullish candle the stock has broken out of a key resistance trendline with huge volume spike.
The stock may reach 331 levels & thereafter 393 levels if the momentum continues on the upside. We could see levels of 198 if the stock reverses to the downside.
Keep monitoring the price-action!!
BUY TODAY SELL TOMORROW for 5%DON’T HAVE TIME TO MANAGE YOUR TRADES?
- Take BTST trades at 3:25 pm every day
- Try to exit by taking 4-7% profit of each trade
- SL can also be maintained as closing below the low of the breakout candle
Now, why do I prefer BTST over swing trades? The primary reason is that I have observed that 90% of the stocks give most of the movement in just 1-2 days and the rest of the time they either consolidate or fall
Resistance Breakout in ZOTA
BUY TODAY SELL TOMORROW for 5%

BUY TODAY SELL TOMORROW for 5%DON’T HAVE TIME TO MANAGE YOUR TRADES?
- Take BTST trades at 3:25 pm every day
- Try to exit by taking 4-7% profit of each trade
- SL can also be maintained as closing below the low of the breakout candle
Now, why do I prefer BTST over swing trades? The primary reason is that I have observed that 90% of the stocks give most of the movement in just 1-2 days and the rest of the time they either consolidate or fall
Resistance Breakout in STYLAMIND
BUY TODAY SELL TOMORROW for 5%

XAU/USD – GOLD 08/09 | Captain VincentObserving JPY & USD | Buy still holds dominance
🔎 Captain’s Log – News Context
This morning there were no major new updates.
The US session tonight (08/09) will also not release big data.
The latest impact on the market is Japanese PM S. Ishiba’s resignation , which pressured JPY downward and slightly lifted the Dollar.
However, Gold only made a small correction and maintained strong stability.
➡️ Captain’s Summary: Dollar and JPY currently only have indirect influence, not enough to push Gold deeply lower. The main trend is still supported for a bullish rebound.
📈 Captain’s Chart – Technical Analysis
Captain’s Shield (Main Support):
Golden Harbor OB: 3542 – 3549
Main Buy Zone: 3549 – 3551
Liquidity Dock: 3573 – 3575
Storm Breaker (Resistance):
Quick Boarding: 3602 – 3604 (Short-term Sell scalp)
Storm Breaker Peak: 3632 – 3634 (Sell zone – may form a new ATH)
⏩ Price structure remains bullish (continuous BOS). Corrections are mainly liquidity grabs before pushing up to higher resistance zones.
🎯 Captain’s Map – Trade Scenarios
✅ Golden Harbor (BUY – Priority)
Buy Zone: 3549 – 3551 | SL: 3542 | TP: 3553 → 3557 → 3560 → 3563 → 35xx
Liquidity Dock: 3573 – 3575 | SL: 3565 | TP: 3578 → 3581 → 3583 → 35xx
⚡ Quick Boarding (SELL Scalp – Short-term)
Entry: 3602 – 3604
SL: 3610
TP: 3600 → 3597 → 3594 → 3591 → 3588 → 35xx
🌊 Storm Breaker (SELL Zone – New ATH)
Entry: 3632 – 3634
SL: 3640
TP: 3629 → 3625 → 3623 → 3619 → 361x
⚓ Captain’s Note
“The golden ship sails steadily as the seas remain calm this morning, with no big news waves. Golden Harbor 🏝️ (3549 – 3551) together with OB near 3542 is the safe anchorage for sailors riding the bullish trend. Liquidity Dock ⚓ (3573 – 3575) is just a temporary anchor before the bullish winds carry the ship further. Quick Boarding 🚤 (3602 – 3604) is for those who want to ride short-term waves. And if the ship touches Storm Breaker 🌊 (3632 – 3634) , it may be a new wave peak – but the grand journey is still headed North with the bullish sails full of wind.”

BSE Ltd Cmp 2320 Triangle BOBSE Ltd Cmp 2320 dated 5-9-2025
1. Bullish Candle
2. RSI rise
3. Triangle BO @ 2350
Buy above 2325 SL 2220 target 2350-2360-2375-
2400-2420-2450-2475-2500-2525-2550
It is just a view please trade at your own risk.

Nifty Intraday Analysis for 08th September 2025NSE:NIFTY
Index has resistance near 24975 – 25025 range and if index crosses and sustains above this level then may reach near 25200 – 25250 range.
Nifty has immediate support near 24550 – 24500 range and if this support is broken then index may tank near 24350 – 24300 range.
Positive opening expected as US President signalling to cool down the escalated tension with India.
Banknifty Intraday Analysis for 08th September 2025NSE:BANKNIFTY
Index has resistance near 54500 – 54600 range and if index crosses and sustains above this level then may reach near 55000– 55100 range.
Banknifty has immediate support near 53600 - 53500 range and if this support is broken then index may tank near 53100 - 53000 range.
Positive opening expected as US President signalling to cool down the escalated tension with India.
Finnifty Intraday Analysis for 08th September 2025NSE:CNXFINANCE
Index has resistance near 26050 - 26100 range and if index crosses and sustains above this level then may reach near 26300 - 26350 range.
Finnifty has immediate support near 25725 – 25675 range and if this support is broken then index may tank near 25500 – 25450 range.
Positive opening expected as US President signalling to cool down the escalated tension with India.
Midnifty Intraday Analysis for 08th September 2025NSE:NIFTY_MID_SELECT
Index has immediate resistance near 12925 – 12950 range and if index crosses and sustains above this level then may reach 13075 – 13100 range.
Midnifty has immediate support near 12650 – 12625 range and if this support is broken then index may tank near 12500 – 12475 range.
Positive opening expected as US President signalling to cool down the escalated tension with India.
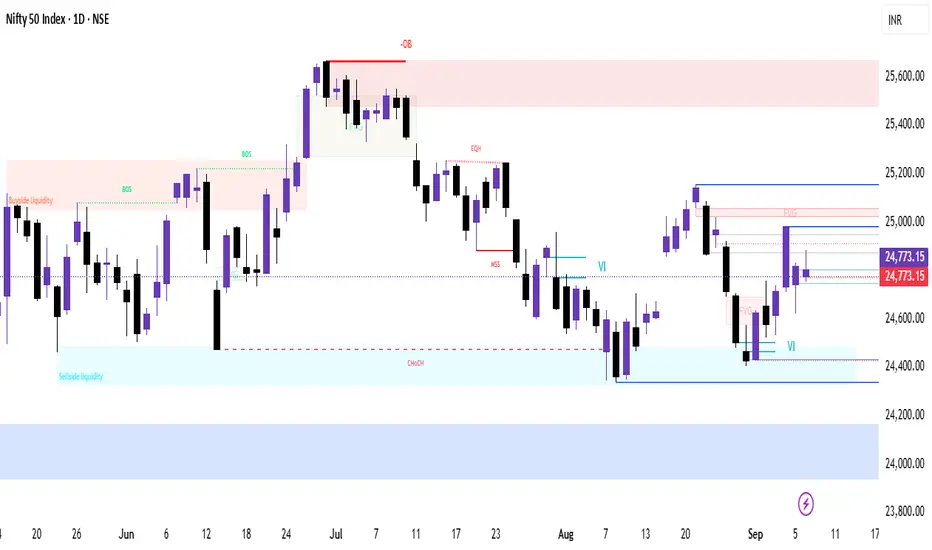
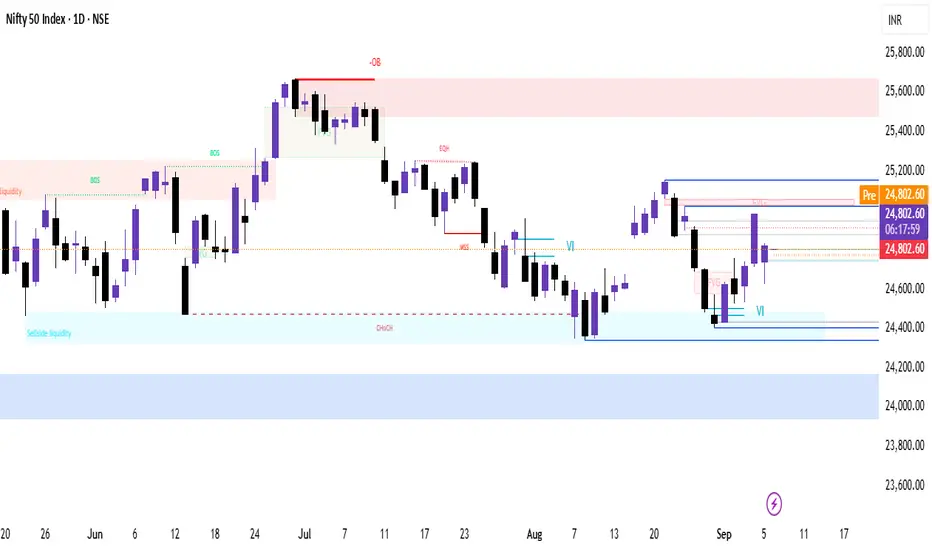
Weekly view (higher-timeframe) / Daily view for NiftyWeekly view (higher-timeframe)
Trend: Consolidation with slight bearish bias — weekly candles have shown limited follow-through above previous highs; failure to hold weekly support would open deeper correction. Use the weekly chart to judge whether weekly close holds above 24.5k
Key weekly levels to watch:
Major support (weekly): 24,150 – 23,775 (secondary targets if 24,500 fails).
Major resistance (weekly): 25,200 – 25,600 (weekly close above this turns bias bullish).
Daily view (what matters for tomorrow’s open)
Bias: Range to bearish unless price decisively gaps/opens above 24,900–25,000 and sustains. Daily momentum indicators referenced in live dashboards show neutral-to-slight-bearish readings (RSI not extremely oversold/overbought), so intraday follow-through matters.
Key intraday levels (actionable):
Immediate support: 24,500 — watch for a probe; below it increases odds of a drop to 24,150 and then 23,950–23,775.
Immediate resistance / bullish pivot: 24,900–25,200 — sustained trade above flips intraday bias toward 25,400+ (short-term targets).
Short setups / playbook for tomorrow (08-Sep-2025)
Bull scenario (momentum long)
Condition: Open/gap above 24,900 and 30-min candle closes above that level with rising volumes.
Plan: look for entries on pullback to 24,900–24,800.
Targets: 25,200 → 25,400.
Stop: close below 24,700 (or 1%–1.5% price-based SL depending on risk).
Bear scenario (momentum short)
Condition: Fails to hold 24,500 on the open or gaps down below 24,500 with follow-through.
Plan: short on retest of 24,500 after breakdown.
Targets: 24,150 → 23,950 → 23,775.
Stop: close above 24,650–24,700 (or 1%–1.5% price-based SL).
Range / neutral day (no trade if uncertain)
If price chops between 24,500–24,900, prefer to stay flat or trade tight intraday scalps with strict stops — higher chance of whipsaw.
Extra checks before market opens
Watch the first 15–30 minutes: the direction of the first 30-min candle + volume will largely determine day’s bias. If you trade, use that as confirmation. (Common intraday rule.)
Monitor macro headlines / premarket flows — anything on GST / policy / global cues may trigger gaps (recent GST news moved markets).
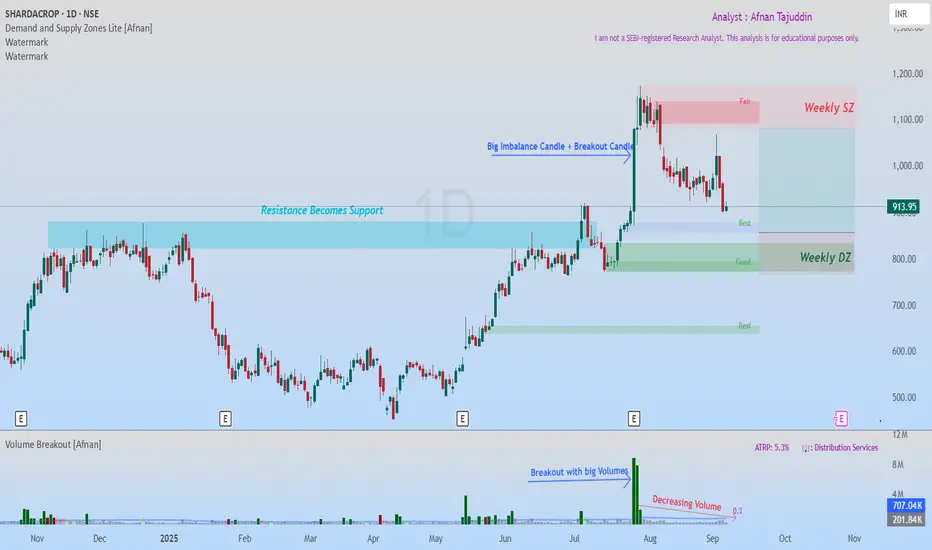
SHARDACROP: Smart Money Demand Zones Align with Classic BreakoutI've been tracking SHARDACROP, and what I'm seeing is honestly one of those setups that doesn't come around too often. There's something brewing here that caught my attention—and it's not just one signal, but two completely different analytical approaches pointing to the exact same conclusion.
Today, I'm breaking down this chart using the modern supply & demand approach that tracks institutional footprints, and the classic technical analysis. When these two methodologies start singing the same tune? That's when you know it's time to pay attention.
What makes this SHARDACROP setup special? Both methods are screaming the same message. And in my experience, that's usually when the big moves happen.
💡 Supply & Demand Analysis - Reading the Smart Money Trail 💡
Let's start with the supply and demand zones. Think of these as crime scenes—they're where the big players left their fingerprints. These aren't random levels; they're areas where massive institutional orders are sitting, waiting to be filled.
🎯 How the Big Players Play 🎯
Here's what most retail traders don't get: when institutions want to buy or sell millions of dollars worth of stock, they can't just hit the market buy button like we do. They'd move the price against themselves instantly. Instead, they layer in orders over time, creating these demand and supply zones.
So when price comes back to test a demand zone, we're betting that the same smart money players who were buying there before still have unfilled orders waiting. It's like they've set a trap—and price is walking right into it.
🔥 What Jumped Out at Me with SHARDACROP 🔥
Solid Weekly Foundation : There's a weekly demand zone that's been acting like a fortress
Stacked Daily Zones : Inside that weekly zone, we've got 1 daily demand zone and another demand zone is latest layered on top of each other.
Leg-out Candle Signature : That leg-out candle? Breaking to new highs, Pure smart money. The size of that imbalance tells me this wasn't retail traders getting excited
📈 The Setup That's Unfolding 📈
Now here's where it gets interesting. Price is drifting back toward our demand zone, and everything's lining up perfectly:
Entry Sweet Spot : Right within that established demand zone
Clean Risk Level : Stop goes below the zone—simple
Clear Target Path : Measured move up to the next supply zone
What I love about this risk-reward setup is the clean path to our 1:2.5 target. There's no major supply zone standing in our way, and the weekly trend is up.
⚡ Traditional Technical Analysis ⚡
Now let's flip the script and look at this through classic technical analysis. And you know what? The story gets even better.
🏗️ The Resistance That Finally Cracked 🏗️
This chart's telling a story I've seen a thousand times, but it never gets old:
The Struggle Phase : Price kept banging its head against the same resistance level, over and over
The Explosion : When it finally broke, it didn't just break—it demolished that level with a massive candle and huge volume
Volume Don't Lie : That breakout volume spike? That's confirmation the move was real
The Polarity Play : Now that old resistance is getting ready to flip into support—textbook price action
📊 Volume Tells the Real Story 📊
What really caught my eye is how volume's behaving on this pullback. As price drifts down toward our support zone, volume's drying up. That's not weakness—that's actually bullish. It means the selling pressure is fading, and when volume contracts like this during a retest, it often sets the stage for the next leg higher.
🎯 When Two Worlds Collide - The Confluence Magic 🎯
Here's where things get really exciting. I'm not just seeing one good setup—I'm seeing two completely different analytical methods pointing to the exact same opportunity:
Supply & Demand Says : Smart money demand zone with layered institutional support
Technical Analysis Says : Classic breakout retest with polarity support and volume confirmation
The Bottom Line : Both methods identify the same zone as the high-probability entry point
When this happens, I call it a "confluence setup." It's like having two different GPS systems both telling you to take the same route—you can be pretty confident you're heading in the right direction.
🌟 Putting It All Together 🌟
SHARDACROP's showing me: institutional footprints perfectly aligned with classic technical patterns. The Multiple Timeframe demand zones, the breakout retest setup, the volume behavior—it's all coming together in a way that makes me sit up and take notice.
But remember, even the best setups can fail. The market doesn't owe us anything, and it certainly doesn't care how confident we are. Trade smart, manage risk, and let the probabilities work in your favor over time.
💪 "The best traders aren't the ones who are right the most—they're the ones who make the most when they're right and lose the least when they're wrong." 📈
Disclaimer: This analysis is purely for educational purposes and isn't meant as trading or investment advice. I'm not a SEBI registered analyst. Always consult with qualified financial advisors before making investment decisions.
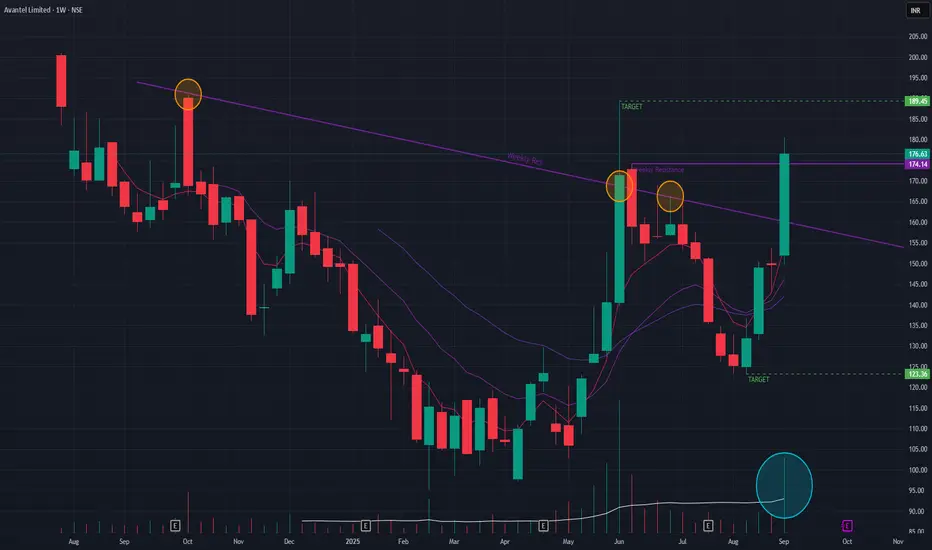
Avantel Ltd (Weekly Timeframe) - Can it sustain the BreakOut??Avantel has been on a downtrend since it's IPO. Since Apr 2025, the stock has been in an uptrend by forming Higher Lows. In the process the stock was able to BreakOut of a key angular resistance as well as a horizontal resistance with a 17.94% surge accompanied with exceptionally huge volume while the short-term EMAs are still in PCO state.
If the momentum continues with some good price-action during the coming week, we may see the stock reach 189 levels. On the downside, we may see the stock reach 123 levels.
Let's watch-out for the price-action during the coming week.
Carysil - Can it sustain the uptrend?Carysil BrokeOut of the horizontal resistance zone and also angular resistance zone with huge volume, last week. The stock surged by 11.59%. Short-term EMAs are still in PCO state which is showing a bullish trend.
With good quarterly earning, the stock may surge further and may reach 1048 levels & thereafter may make new ATHs if the price-action sustains. On the downside, we may see the levels of 768.
Watch-out for next week's price-action.

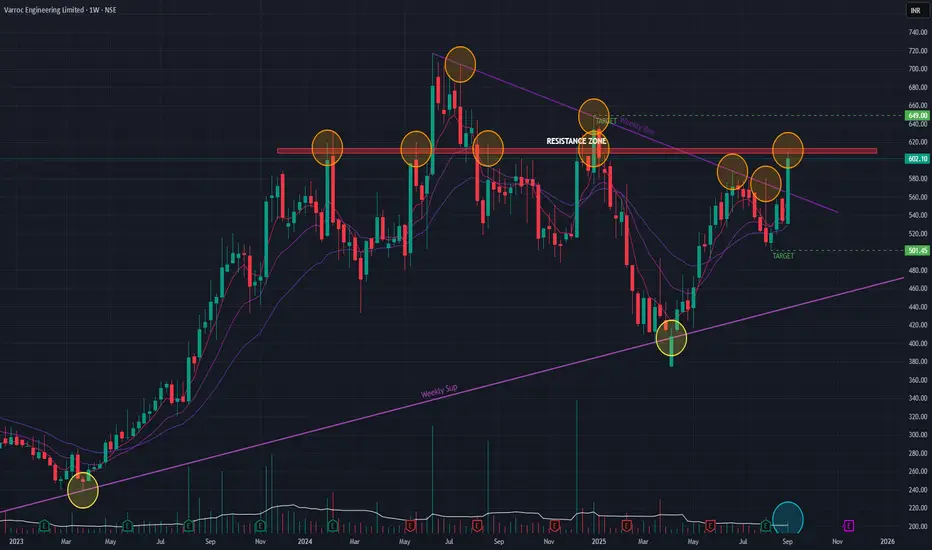
Varroc (Weekly Timeframe) - Potential BreakOut ??Varroc has been mostly in a sideways trend since Dec 2023. Key horizontal resistance zone was brokenout couple of times but that could not be sustained for long. Last week the stock surged by 12.68% with decent volume. With the surge it was able to breakout of a major angular resistance. Short-term EMAs are in PCO state as of last week.
If momentum continues, we may see the stock surge past the resistance zone and may reach 649 levels. On the downside, we may see the stock at 501 levels.
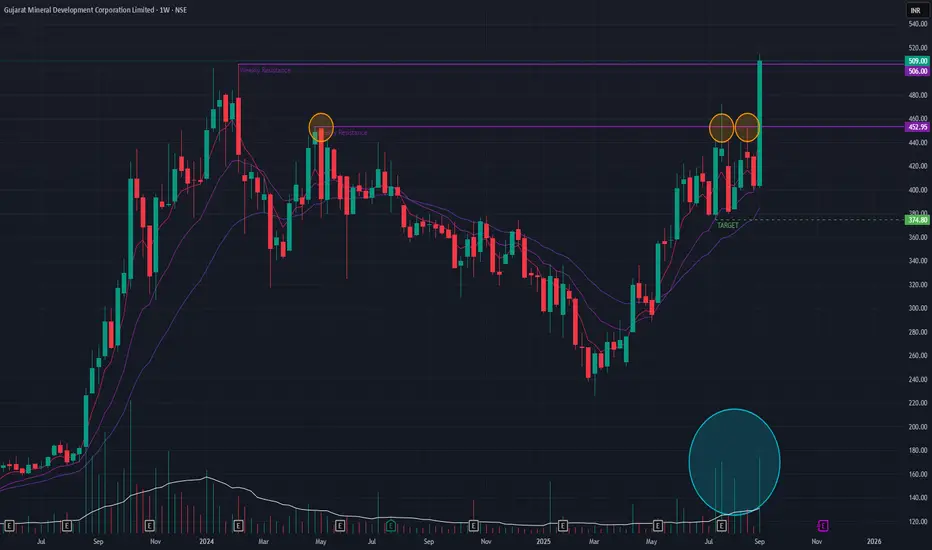
GMDC (Weekly Timeframe) - What next after ATHGMDC was in a short-term downtrend which reversed into an uptrend by Mar 2025. Past few weeks it tried to BreakOut of the horizontal key resistance trendline as indicated. Last week the stock surged by 26.04% with huge volume and made a new ATH. What can we expect after the new ATH, I would expect some profit booking in the coming week.
If the momentum sustains then we may see the stock surge to 640 levels on the upside. On downside, we may see 374 levels. All depending on the coming week's price-action.
To be watched !!