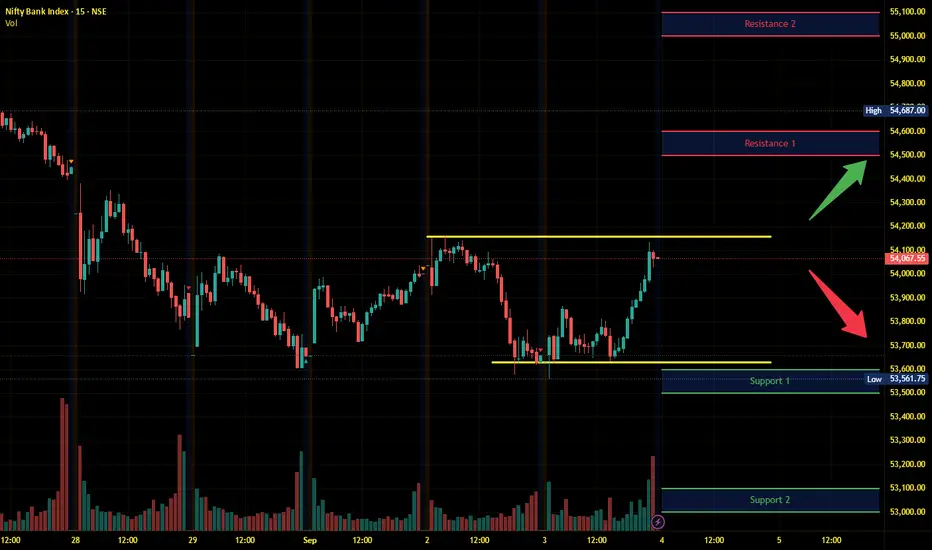
Banknifty Intraday Analysis for 05th September 2025NSE:BANKNIFTY
Index has resistance near 54500 – 54600 range and if index crosses and sustains above this level then may reach near 55000– 55100 range.
Banknifty has immediate support near 53600 - 53500 range and if this support is broken then index may tank near 53100 - 53000 range.
Support and Resistance
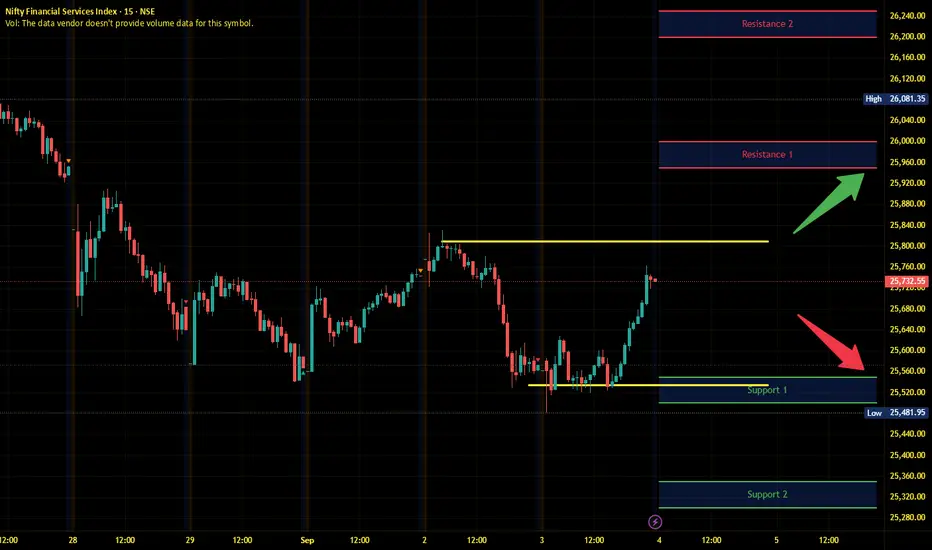
Finnifty Intraday Analysis for 05th September 2025NSE:CNXFINANCE
Index has resistance near 26025 - 26075 range and if index crosses and sustains above this level then may reach near 26250 - 26300 range.
Finnifty has immediate support near 25650 – 25600 range and if this support is broken then index may tank near 25450 – 25400 range.
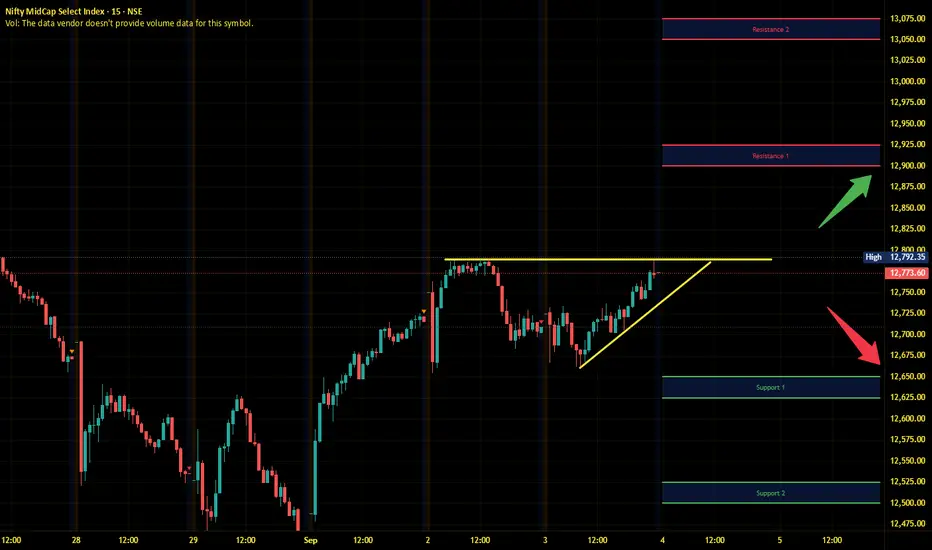
Midnifty Intraday Analysis for 05th September 2025NSE:NIFTY_MID_SELECT
Index has immediate resistance near 12875 – 12900 range and if index crosses and sustains above this level then may reach 13025 – 13050 range.
Midnifty has immediate support near 12625 – 12600 range and if this support is broken then index may tank near 12500 – 12475 range.
FED dovish, Gold stays bullish; SELL only for scalps⚓️ Captain Vincent – Gold Plan XAU/USD
1. Market Wave 🌍
The probability of a FED rate cut in September surged to 96.6% (vs 90.4% earlier) after the JOLTS report showed weakening job prospects.
Several FED officials, from Kashkari to Bostic, shifted dovish. Only Musallim maintained a hawkish stance with a scenario of just one cut.
👉 Result: Capital flows returned to Gold as the No.1 safe haven, pushing prices strongly higher overnight.
📌 Key data today (04/09 – US time):
ADP Nonfarm (7:15)
Jobless Claims (7:30)
ISM Services PMI (9:00)
➡️ This trio of data will be crucial catalysts for GOLD volatility.
2. Technical Analysis ⚙️
On M30/H1, Gold continues to form bullish BOS, keeping the main trend upward.
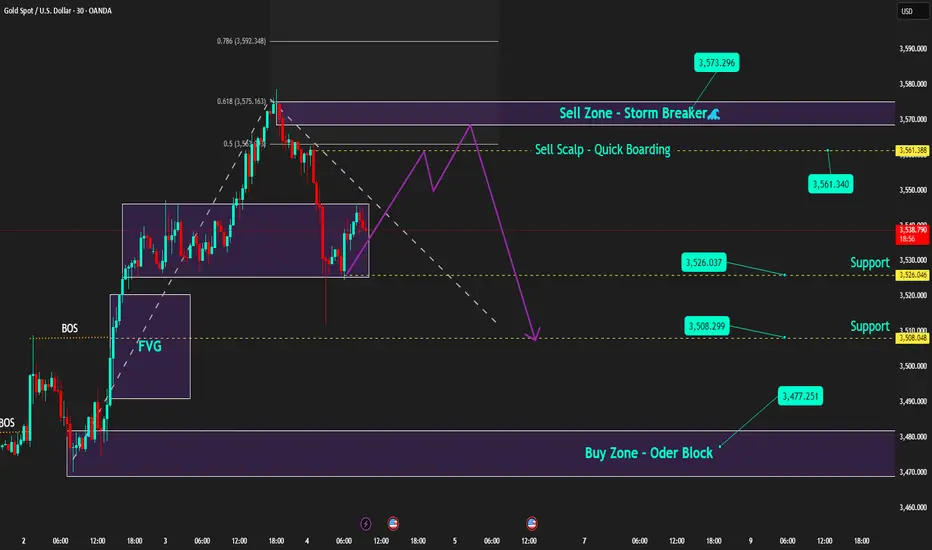
Golden Harbor 🏝️ (Buy Zone 3,477 – 3,479): Old Order Block, strong support if price pulls back.
Quick Boarding 🚤 (Sell Scalp 3,561 – 3,563): Only for short-term scalps.
Storm Breaker 🌊 (Sell Zone 3,573 – 3,575): Aligned with Fibo 0.618–0.786, strong resistance with potential selling pressure.
Captain’s Shield 🛡️ (Support): 3,526 – 3,515 – 3,508
3. Captain Vincent’s Map – Trade Scenarios 🪙
🔺 Golden Harbor 🏝️ (BUY – Priority)
Entry: 3,477 – 3,479
SL: 3,470
TP: 3,480 → 3,483 → 3,486 → 3,491 → 349x → 35xx
🚤 Quick Boarding (SELL Scalp – Short Ride)
Entry: 3,561 – 3,563
SL: 3,569
TP: 3,558 → 3,555 → 3,552 → 354x
🌊 Storm Breaker (SELL Zone – Strong Resistance)
Entry: 3,573 – 3,575
SL: 3,581
TP: 3,570 → 3,565 → 3,560 → 3,555 → 35xx
4. Captain’s Note ⚓
"The golden sail is filled with wind as the FED turns dovish. Golden Harbor 🏝️ (3477) remains the safe haven to align with the bullish trend. SELLs are just Quick Boarding 🚤 scalps at Storm Breaker 🌊 , not long voyages."
Viviana Power Tech – Where Fundamentals Fuel the Breakout?Viviana Power Tech Ltd, based in Gujarat, operates in the power transmission and distribution EPC space, offering services like EHV substations, underground cabling, and testing/commissioning. The company has shown rapid expansion in revenue and profitability, riding on India’s growing power infrastructure demand.
Fundamental Analysis
Financial Performance
Revenue Growth: From ₹66 crore (FY24) to ~₹235 crore TTM, reflecting a 250%+ YoY growth.
Net Profit: Jumped from ₹7 crore (FY24) to ~₹22 crore TTM.
EPS (TTM): ~₹28–35 depending on consolidation basis.
Key Ratios
P/E Ratio: ~34–36× (slightly expensive compared to sector peers).
P/B Ratio: ~12.5× (stretched valuations).
ROE / ROCE: Strong at ~28–31%, respectively.
Debt-to-Equity: Moderate at ~0.48.
Promoter Holding: ~70.3% (indicating strong skin in the game).
Outlook
Strengths: Explosive revenue and profit growth, high return ratios, strong order book visibility.
Risks: Expensive valuations, thin dividend track record, seasonal volatility in September.
Technical Analysis
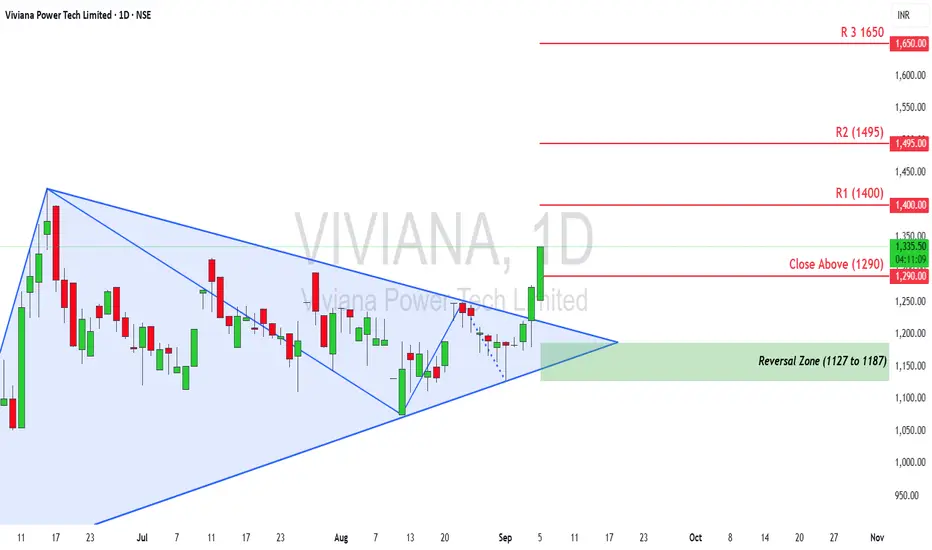
Pattern Formation:
The stock has been consolidating inside a symmetrical triangle since June, and has now given a breakout with strong bullish candles.
Key Levels:
Close Above Zone: ₹1,290 – A decisive breakout level.
Immediate Resistances:
R1: ₹1,400
R2: ₹1,495
R3: ₹1,650
Support/Reversal Zone: ₹1,127 – ₹1,187
Momentum: The breakout with a ~4.7% surge on above-average volumes suggests the beginning of a fresh upward trend.
Trend Outlook:
If the stock sustains above ₹1,290, momentum traders can eye ₹1,400–₹1,495 in the near term, with ₹1,650 as a medium-term target. A fall below ₹1,187 may invalidate the bullish view.
Techno-Fundamental Verdict
Viviana Power Tech stands out as a high-growth mid-cap in the power EPC sector with strong fundamentals, backed by robust ROE and revenue expansion. The recent technical breakout from consolidation adds a bullish confirmation, suggesting renewed investor interest.
For Investors: Attractive for long-term growth seekers, but valuation is expensive—advisable to accumulate on dips near support zones.
For Traders: Sustaining above ₹1,290 opens the door for a rally toward ₹1,400–₹1,495 in the short term. Stop-loss should be placed below ₹1,180 for risk management.
Conclusion:
Viviana is a growth-driven, high-potential, but richly valued stock. Fundamentals indicate strength, and the technical chart signals bullish continuation. A balanced approach—combining staggered investment with tactical trading entries—may offer the best risk-reward.
Disclaimer: lnkd.in
Bearish Pressure Builds: Gold Poised for More RetreatGold retreated sharply today as expected, and directly hit my expected retracement target of 3520-3510 area; the lowest point happened to be around 3511. We added a lot of short positions around 3575 and 3578 overnight, which helped us to make considerable profits during the gold retreat. All short positions made a total profit of 1830pips after being closed.
Since gold has begun to retreat from 3578, and the retracement has reached 670 pips in the short term, a retracement that is rare in recent times, as gold has shown obvious signs of retreat, once large funds begin to withdraw, it may trigger serious selling sentiment in the market. Taking this opportunity, the gold market may usher in a round of sharp correction. Moreover, after gold retreats, 3578 is expected to become the interim peak, which will limit the room for gold to rebound while being conducive to the downward pressure on gold.
In addition, gold rose sharply before the NFP market, probably to reserve room for the NFP market to fall, so I think gold still has the demand and space to continue to retreat, so the current decline has not ended yet, and I think the current short-term rebound provides us with good conditions for entering the short market.
According to the current structure, gold still needs to retreat after fluctuating at high levels. Therefore, in trading, we can still look for suitable opportunities to short gold during the gold rebound. First of all, we need to pay attention to the short-term resistance area of 3545-3555. Once gold cannot effectively stand in this area during the rebound, gold will also test the 3510-3500 area. After falling below this area, it is expected to continue to the 3490-3480 area.

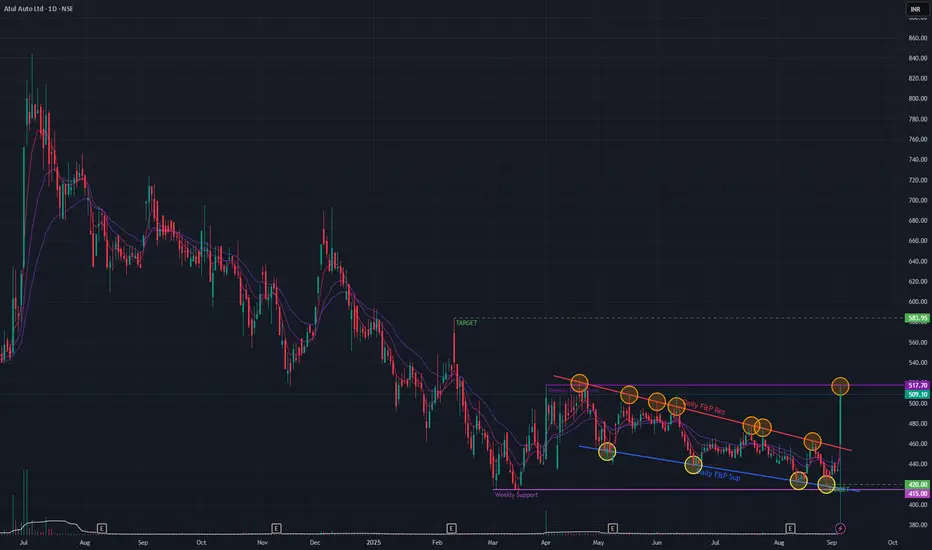
Atul Auto (Daily Timeframe) - Is it the Bullish reversal ??Atul Auto has been in a downtrend since the All Time High. Resistance & Support trendlines in the recent past has been respected well as marked. Today the stock BrokeOut of the angular trendline with a 17% spike and huge volume spurt. Currently the stock is encountering a key resistance.
Overall the stock is in a downtrend but a bullish divergence can be seen along with short-term EMAs in positive cross-over state. Till further positive price action, a bullish trend may not be foreseen.
If the stock moves in an uptrend then we might see the levels of 583 & in case of a downtrend we might see the levels of 420.
Keep monitoring!!
BUY TODAY SELL TOMORROW for 5%DON’T HAVE TIME TO MANAGE YOUR TRADES?
- Take BTST trades at 3:25 pm every day
- Try to exit by taking 4-7% profit of each trade
- SL can also be maintained as closing below the low of the breakout candle
Now, why do I prefer BTST over swing trades? The primary reason is that I have observed that 90% of the stocks give most of the movement in just 1-2 days and the rest of the time they either consolidate or fall
Resistance Breakout in ZYDUSWELL
BUY TODAY SELL TOMORROW for 5%

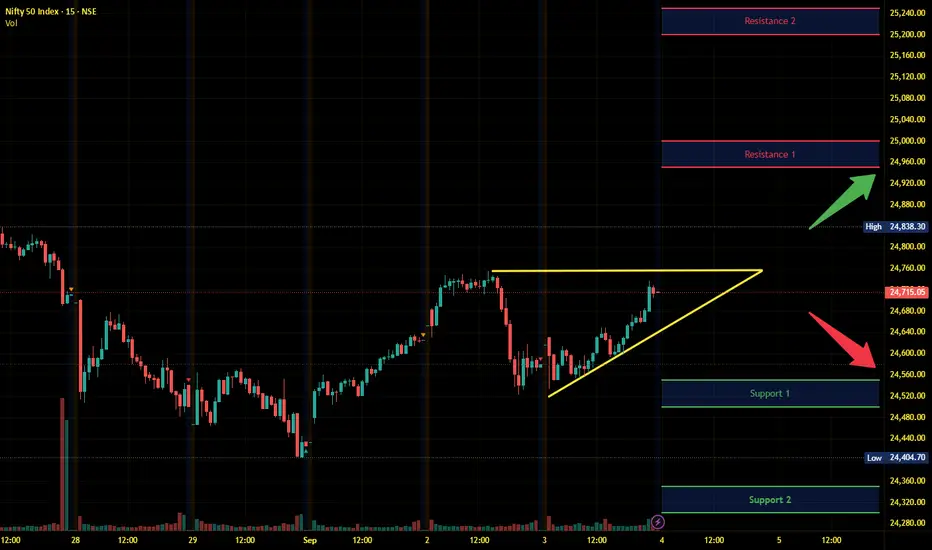
Nifty Intraday Analysis for 04th September 2025NSE:NIFTY
Index has resistance near 24950 – 25000 range and if index crosses and sustains above this level then may reach near 25200 – 25250 range.
Nifty has immediate support near 24550 – 24500 range and if this support is broken then index may tank near 24350 – 24300 range.
Volatility may increase with downside risk if any fresh news emerges on tariff war.
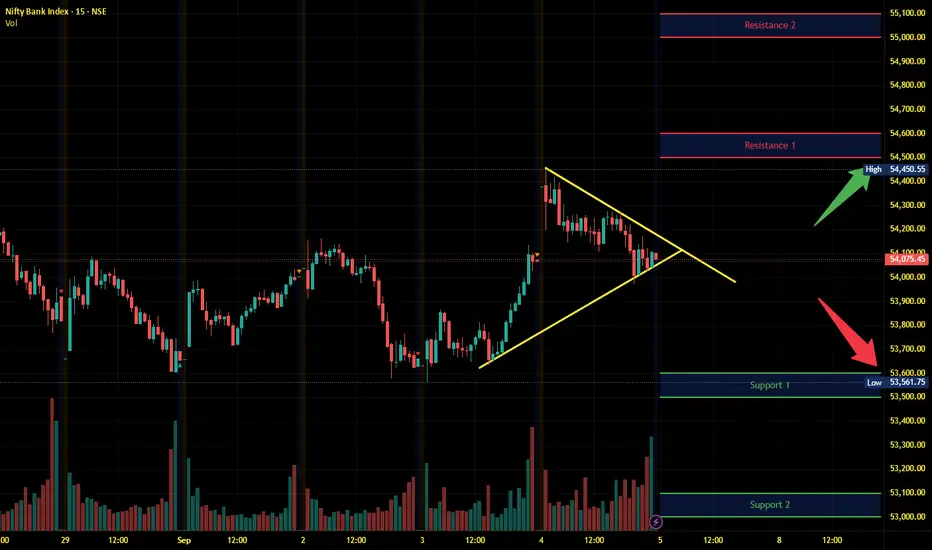
Banknifty Intraday Analysis for 04th September 2025NSE:BANKNIFTY
Index has resistance near 54500 – 54600 range and if index crosses and sustains above this level then may reach near 55000– 55100 range.
Banknifty has immediate support near 53600 - 53500 range and if this support is broken then index may tank near 53100 - 53000 range.
Volatility may increase with downside risk if any fresh news emerges on tariff war.
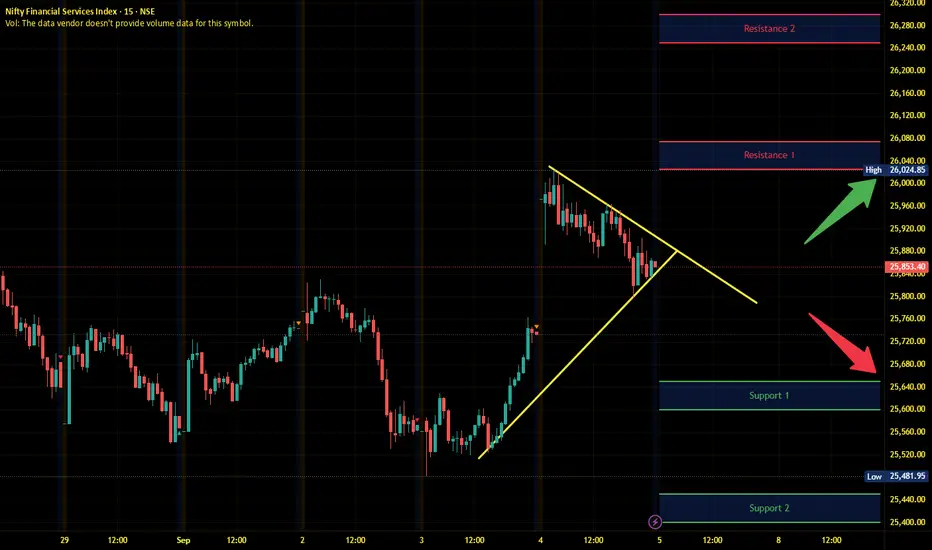
Finnifty Intraday Analysis for 04th September 2025NSE:CNXFINANCE
Index has resistance near 25950 - 26000 range and if index crosses and sustains above this level then may reach near 26200 - 26250 range.
Finnifty has immediate support near 25550 – 25500 range and if this support is broken then index may tank near 25350 – 25300 range.
Volatility may increase with downside risk if any fresh news emerges on tariff war.
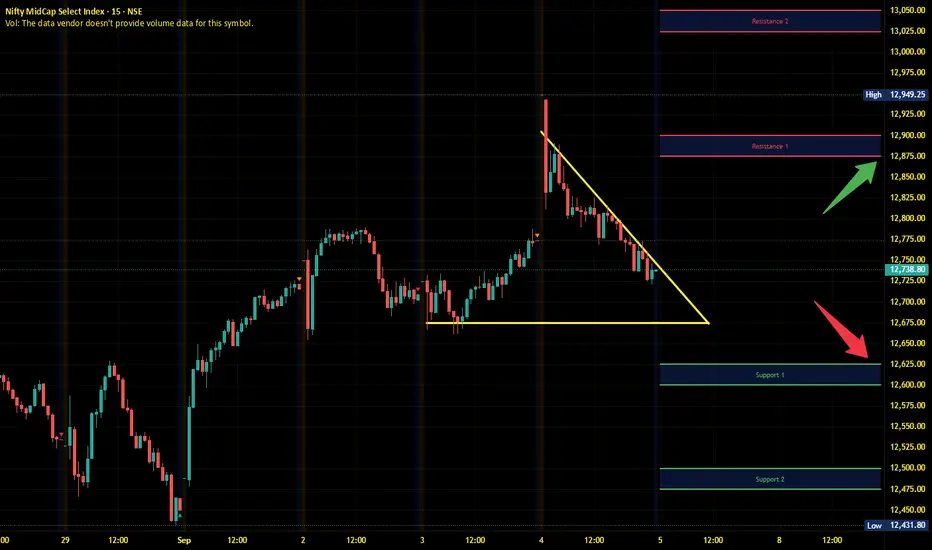
Midnifty Intraday Analysis for 04th September 2025NSE:NIFTY_MID_SELECT
Index has immediate resistance near 12900 – 12925 range and if index crosses and sustains above this level then may reach 13050 – 13075 range.
Midnifty has immediate support near 12650 – 12625 range and if this support is broken then index may tank near 12525 – 1250 range.
Volatility may increase with downside risk if any fresh news emerges on tariff war.
Bullish Look at this chart closely,
Market take a support of 53000 zone
Now structure is sideways to positive bullish
I think it's time for some time wise condition in 2000 points range
53k to 55k
Nothing else

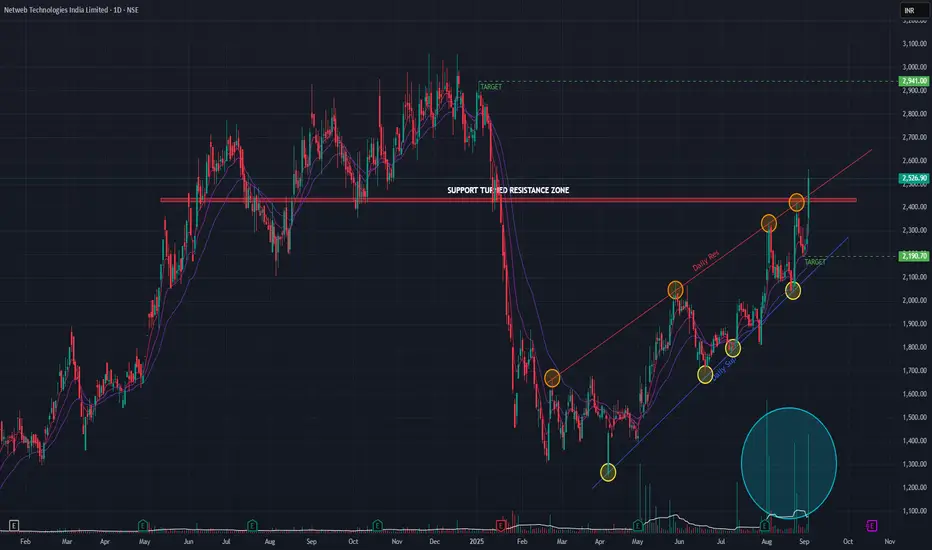
Netweb Tech (Daily Timeframe) - bullish signs ??Netweb has been on an uptrend since Feb 2025 and today it breached a key support turned resistance zone with huge volume. With a +11.48% gain combined with huge volume, the stock also breached the angular resistance trendline as indicated. Short-term EMAs are in positive cross-over state indicating bullish signs.
The recent quarter earnings are also positive for the stock.
If the uptrend momentum continues, then we may see the stock go upto 2940 range. On the downside it may go to 2190 range. The price action on the coming days would be key.
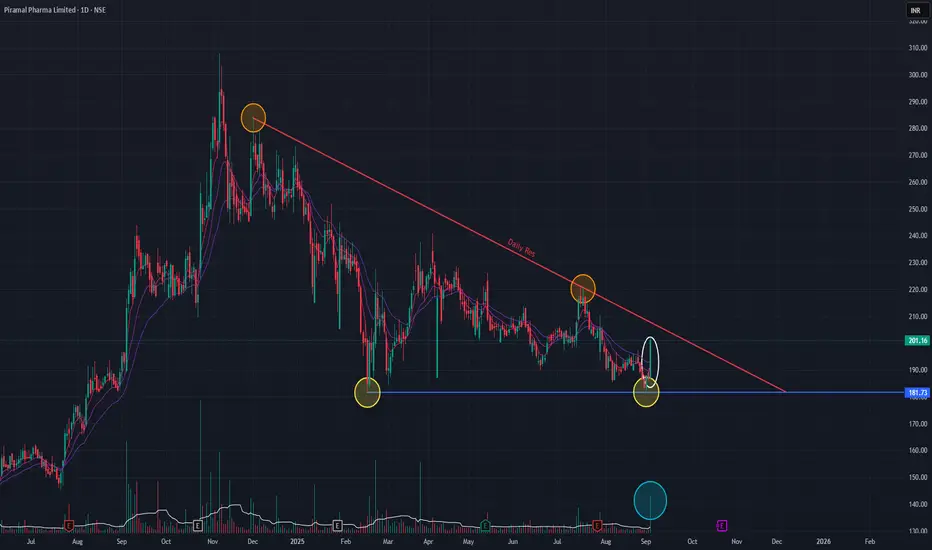
Piramal Pharma (Daily Timeframe) - Potential BreakOutPiramal Pharma, has formed a Double-Bottom chart pattern, indicating Bullish reversal. With today's bullish candle the volume has also spiked. We should watch out for the price action in the coming days. As indicated in the chart, resistance trendline is respected as well as the support trendline. If the stock has to move up, then it has to breach the resistance trendline.
Let's keep a watch on it.
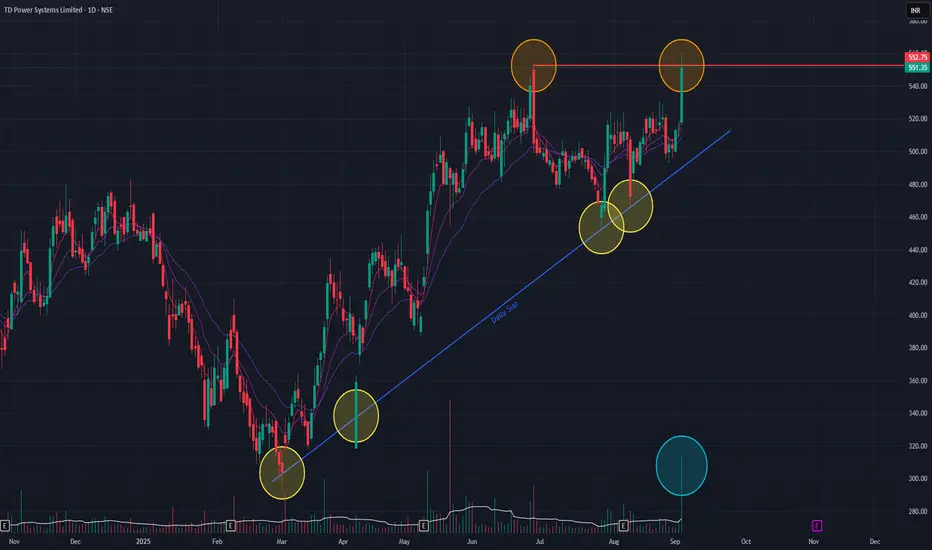
TD Power Systems (Daily Timeframe) - Can it make new ATH ??TD Power made a new All Time High today with huge volume. With that last bullish candle, on daily timeframe, we observe a Double-Top which is a bearish chart pattern. The angular support trendline has been respected as indicated. Short-term EMAs are in positive cross-over state, which is an obvious scenario during Double-Top formation.
We should observe how the price action plays out in the coming days to decide on the possible targets, both upside and downside.
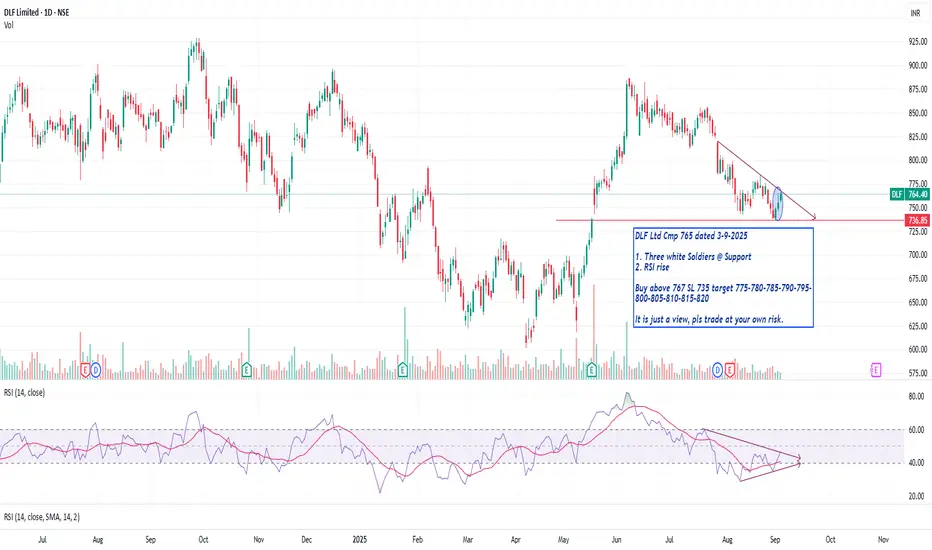
DLF Ltd Cmp 765 Three white Soldiers @ SupportDLF Ltd Cmp 765 dated 3-9-2025
1. Three white Soldiers @ Support
2. RSI rise
Buy above 767 SL 735 target 775-780-785-790-795-
800-805-810-815-820
It is just a view, pls trade at your own risk.
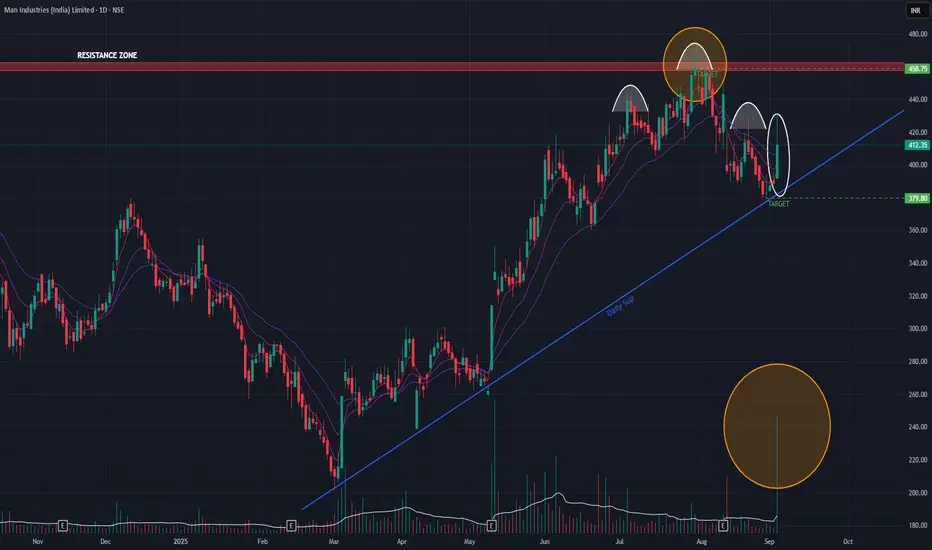
Man Industries (Daily Timeframe) - Upside or Downside??Man industries has been on an uptrend since March 03, 2025 and it tried to BreakOut of the key resistance zone, but invain. Today the stock gained 6% with huge volume. Since March 03, 2025, the stock has been respecting the angular support trendline while making Higher Lows. If we observe carefully, an H&S pattern is formed at the top which indicates a bearish trend. Short-term EMAs are also in Negative Cross-over state.
If the stock gains momentum on the upside, then it may rise to the range of 458. On the downside, the stock may reach the immediate support of 379.
To monitor.
XAUUSD GOLD ANALYSIS ON (03/09/2025)BTCUSD UPDATEDE
Current price - 112200
If price stay above 109000,then next target 114500,118000,122000 and below that 105000
Plan; if price break 112200-111800 area and above that 112200 area,we will place buy oder in BTCUSD with target of 114500 and 118000 & stop loss should be placed at 109000

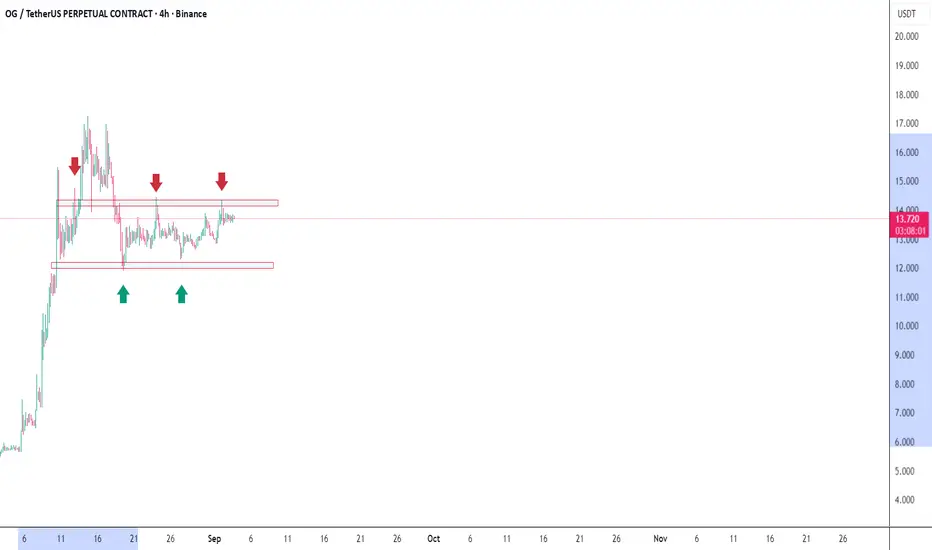
OG Fan Token OverpricedThe OGUSDT Fan Token has exhibited an extraordinary price surge in recent weeks, raising eyebrows across the market. From trading near $5, it rapidly climbed past $10, and is now hovering around $13.5, reflecting a near 170% gain in a short span.
📈 Momentum & RSI Observation This aggressive rally has pushed the Relative Strength Index (RSI) into overbought territory, signaling potential exhaustion in bullish momentum. The RSI’s elevated levels suggest that the token may be due for a correction or consolidation phase.
📍 Supply & Demand Zones On the chart, we observe clearly defined supply and demand zones where price has previously respected key levels. The token is currently consolidating within this range, indicating indecision among buyers and sellers.
🔻 Bearish Scenario Should OGUSDT break below the strong support zone, it could trigger a significant downside move. Traders
should monitor volume and candlestick patterns closely for signs of a breakdown.
#TradingView #OG #fantoken #Trading
Sensex - Sep 4 Expiry Day AnalysisDo you remember that the Sensex weekly expiry is on Thursdays? Today, the price took support from 80000, and gave 500 points move. Nearby resistance is at the 80750 - 80800 zone.
Buy above 80520 with the stop loss of 80420 for the targets 80600, 80720, 80800, 80920, 81040, and 81200.
Sell below 80280 with the stop loss of 80400 for the targets 80200, 80080, 80000, 79880, 79800, and 79680.
Expected expiry day range is 80100 to 81200.
Always do your analysis before taking any trade.

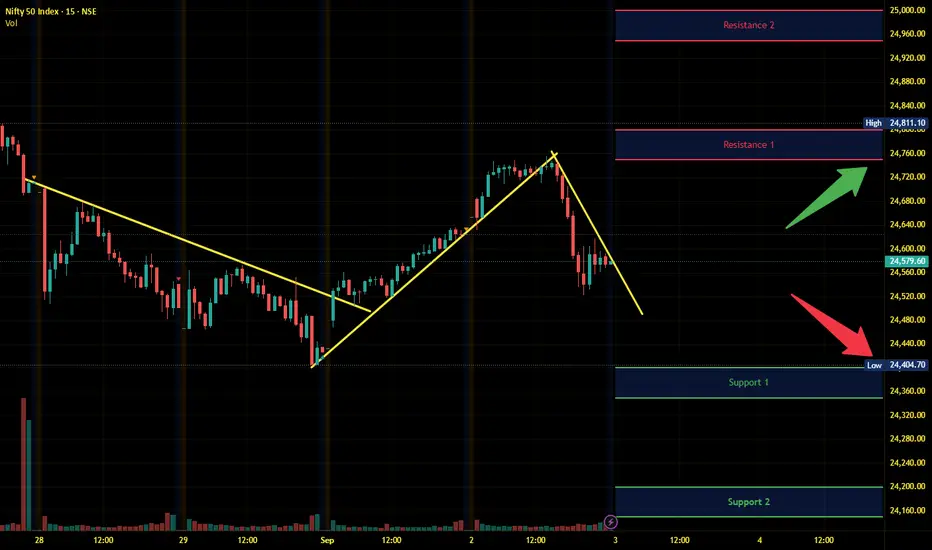
Nifty Intraday Analysis for 03rd September 2025NSE:NIFTY
Index has resistance near 24750 – 24800 range and if index crosses and sustains above this level then may reach near 24900 – 25000 range.
Nifty has immediate support near 24400 – 24350 range and if this support is broken then index may tank near 24200 – 24150 range.
Fresh escalation in trade war by the US will increase volatility in the global market.
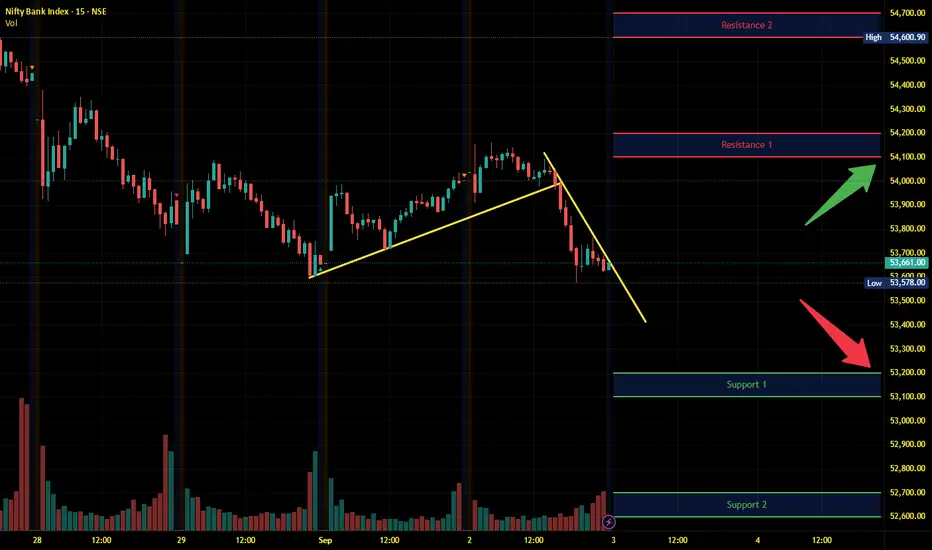
Banknifty Intraday Analysis for 03rd September 2025NSE:BANKNIFTY
Index has resistance near 54100 – 54200 range and if index crosses and sustains above this level then may reach near 54600– 54700 range.
Banknifty has immediate support near 53200 - 53100 range and if this support is broken then index may tank near 52700 - 52600 range.
Fresh escalation in trade war by the US will increase volatility in the global market.