Finnifty Intraday Analysis for 29th August 2025NSE:CNXFINANCE
Index has resistance near 25875 - 25925 range and if index crosses and sustains above this level then may reach near 26150 - 26200 range.
Finnifty has immediate support near 25450 – 25400 range and if this support is broken then index may tank near 25225 – 25175 range.
Volatility expected due to low carry forward OI in September’25 Monthly F&O Contracts with limited upside moment on weekly close.
Support and Resistance

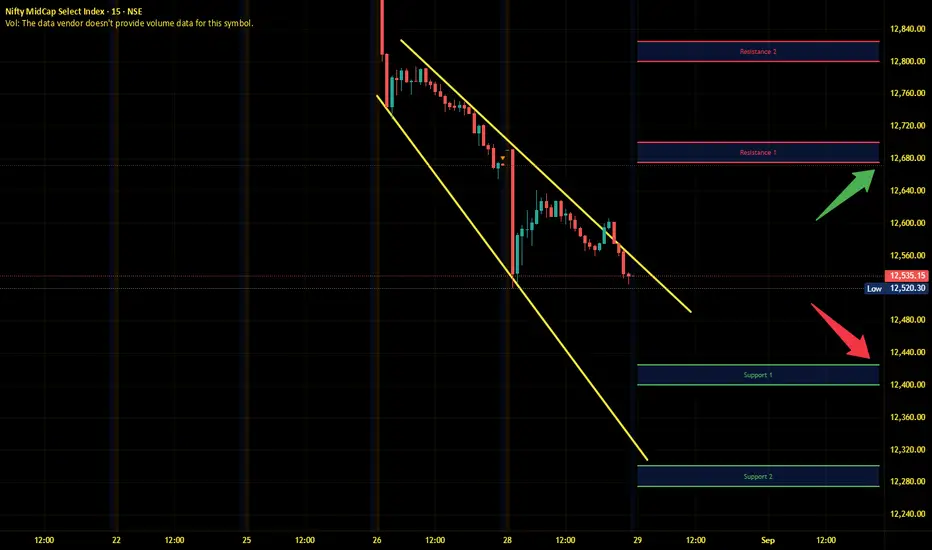
Midnifty Intraday Analysis for 29th August 2025NSE:NIFTY_MID_SELECT
Index has immediate resistance near 12675 – 12700 range and if index crosses and sustains above this level then may reach 12800 – 12825 range.
Midnifty has immediate support near 12425 – 12400 range and if this support is broken then index may tank near 12300 – 12275 range.
Volatility expected due to low carry forward OI in September’25 Monthly F&O Contracts with limited upside moment on weekly close.
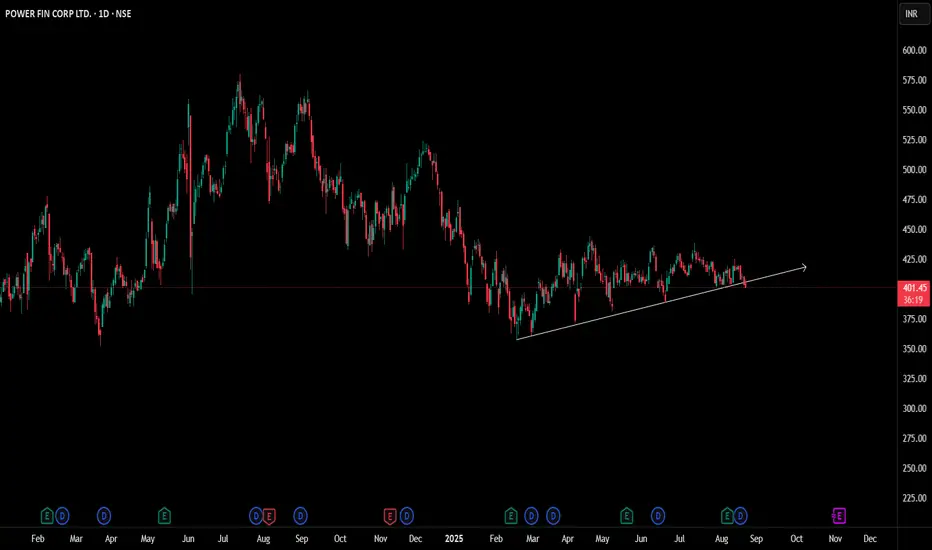
PFC Trend Line Breakot Date : 21-02-2025
Symbol : PFC
As per the image we see the trend line breakout and this can hit hard.
From very past days this was working as a major support and we saw many bounce back from this area. Shocking part is also Price Action Thing because CMP is around Rs 401 and we are seeing this breakout.
Let's See...
Captain Vincent | Gold holds 3400, breakout or pullback next?” FED turns dovish, Gold challenges a new Storm Breaker
1. News Wave 🌍
FED – Waller: “Tariffs are a kind of tax and do not increase inflation. I’m back with the ‘transitory team’ on inflation.”
👉 A clear dovish hint supporting a 25bps rate cut in September, with potential for 1–2 more cuts in the next 3–6 months.
US Senate: Hearing scheduled on Sept 4th for FED nominee S. Miran → Political–monetary spotlight.
Tonight: Market awaits PCE data, FED’s preferred inflation measure.
➡️ Summary: FED leaning dovish = mid-term bullish for Gold.
But short-term, Gold faces profit-taking pressure near resistance.
2. Technical Outlook ⚙️
On H1, Gold has repeatedly formed bullish BOS and crossed above 3,400.
Golden Harbor 🏝️ (Buy Zone 3375 – 3373): Large volume accumulation, aligned with FVG → Attractive entry if price pulls back.
Storm Breaker 🌊 (Sell Zone 3432 – 343x): At old ATH zone, high probability of supply pressure if tested.
Key Levels:
3,375 → Critical support “anchor”.
3,438 → Resistance target if bullish momentum continues.
3. Captain Vincent’s Map – Trade Scenarios 🪙
🔺 Golden Harbor 🏝️ (BUY Zone – Priority)
Entry: 3375 – 3373
SL: 3365
TP: 3378 → 3381 → 3384 → 3387 → 33xx
🔻 Storm Breaker 🌊 (SELL Zone – Old ATH Reaction)
Entry: 3432 – 343x
SL: 3442
TP: 3428 → 3425 → 3423 → 3420 → 33xx
4. Captain’s Note ⚓
"The Gold ship has sailed past 3400, but Storm Breaker 🌊 at 343x remains a tough challenge. If corrective waves appear, patiently wait at Golden Harbor 🏝️ to board for a more bullish September journey."

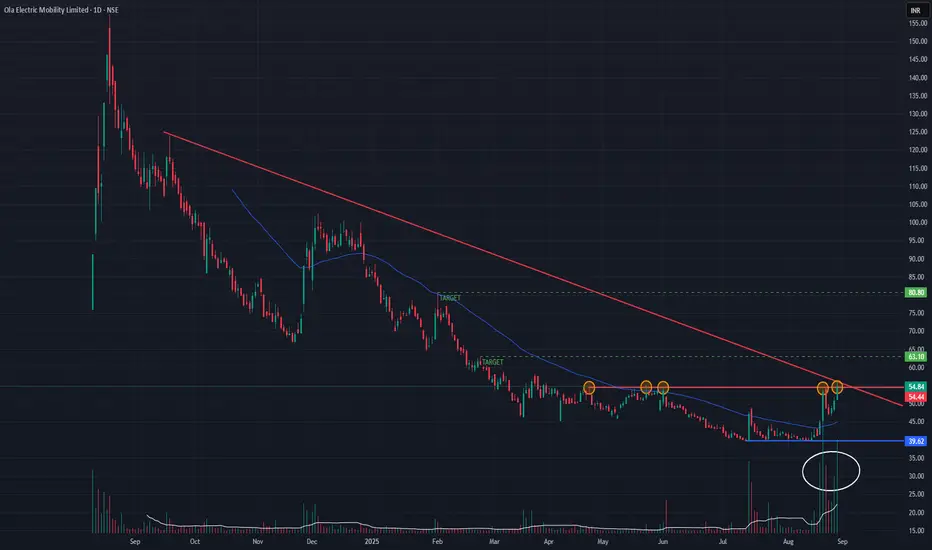
OLA Electric (Daily Timeframe) - Potential Bullish BreakoutOLA has been on a downtrend ever since it's IPO and recently it has shown signs of a reversal . Past few days, the stock has been attempting to Break-Out a major resistance multiple times, as indicated. Today it was able to breach the resistance with huge volume. The next few trading sessions will indicate the stock's trend.
Possible targets are, 62 & 80 if the stock sustains the uptrend.
To be monitored !!!
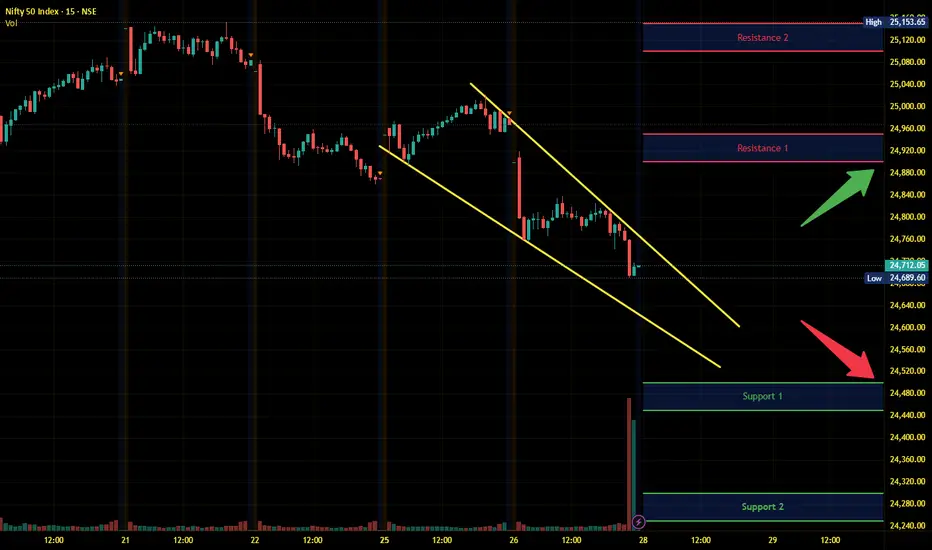
Nifty Intraday Analysis for 28th August 2025NSE:NIFTY
Index has resistance near 24900 – 24950 range and if index crosses and sustains above this level then may reach near 25100 – 25150 range.
Nifty has immediate support near 24500 – 24450 range and if this support is broken then index may tank near 24350 – 24300 range.
Volatility expected due to expiry of the August’25 Monthly F&O Contracts and impact of imposition of additional 25% tariff or any new development on the matter.
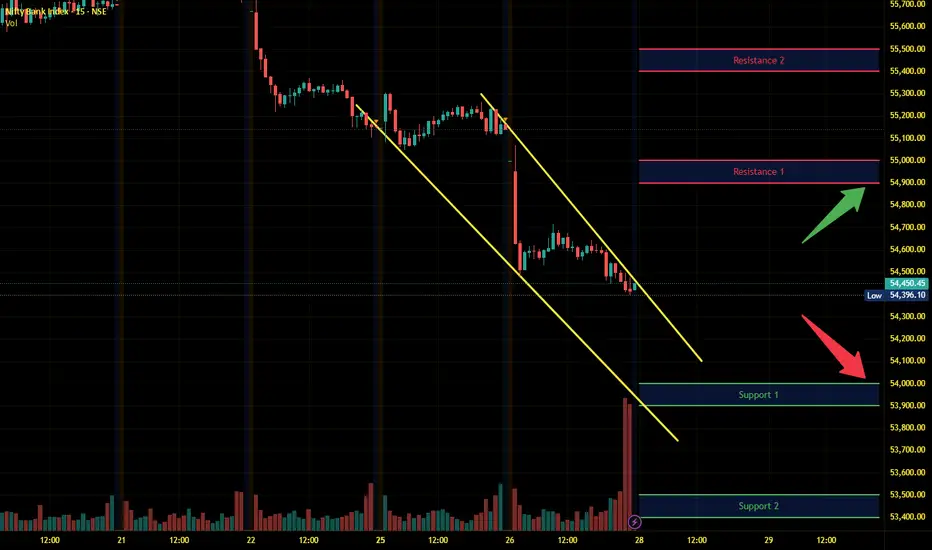
Banknifty Intraday Analysis for 28th August 2025NSE:BANKNIFTY
Index has resistance near 54900 – 55000 range and if index crosses and sustains above this level then may reach near 55400– 55500 range.
Banknifty has immediate support near 54000 - 53900 range and if this support is broken then index may tank near 53500 - 53400 range.
Volatility expected due to expiry of the August’25 Monthly F&O Contracts and impact of imposition of additional 25% tariff or any new development on the matter.
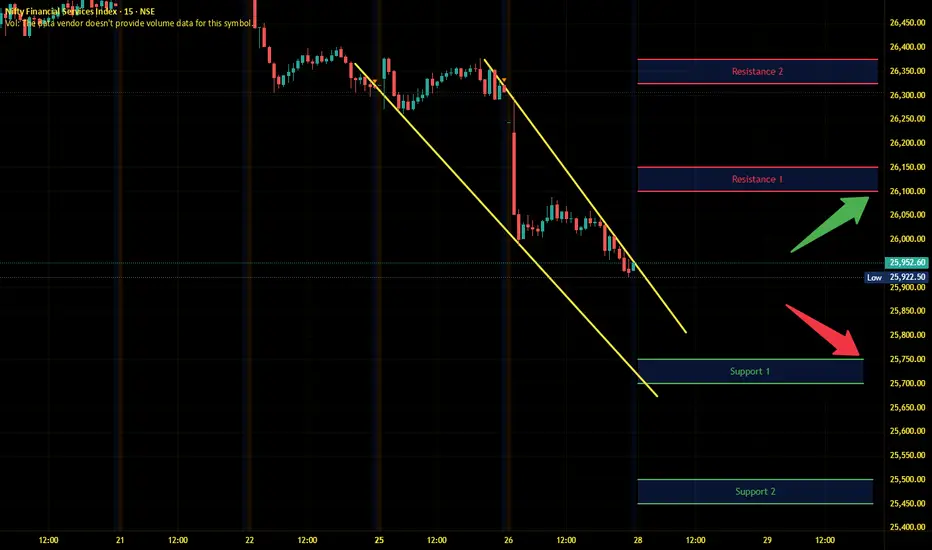
Finnifty Intraday Analysis for 28th August 2025NSE:CNXFINANCE
Index has resistance near 26100 - 26150 range and if index crosses and sustains above this level then may reach near 26325 - 26375 range.
Finnifty has immediate support near 25750 – 25700 range and if this support is broken then index may tank near 25500 – 25450 range.
Volatility expected due to expiry of the August’25 Monthly F&O Contracts and impact of imposition of additional 25% tariff or any new development on the matter.
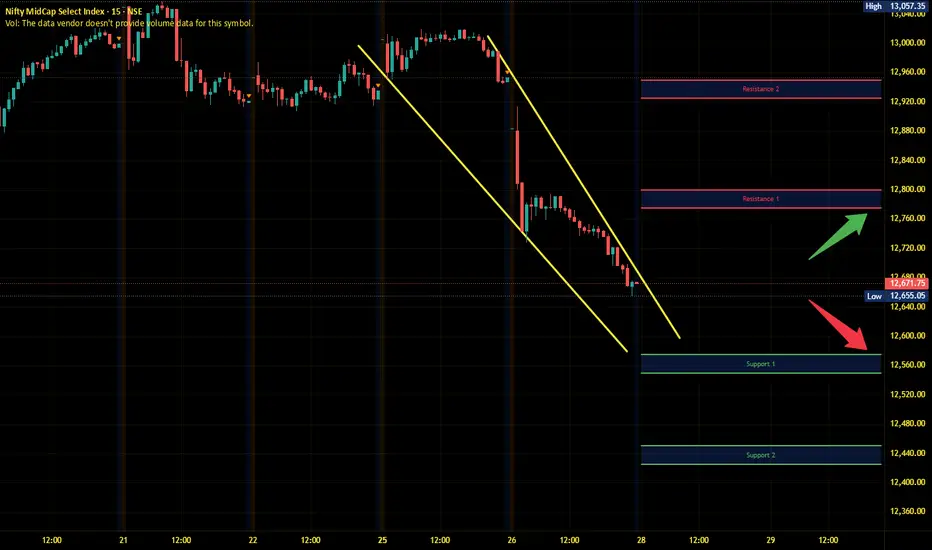
Midnifty Intraday Analysis for 28th August 2025NSE:NIFTY_MID_SELECT
Index has immediate resistance near 12775 – 12800 range and if index crosses and sustains above this level then may reach 12925 – 12950 range.
Midnifty has immediate support near 12575 – 12550 range and if this support is broken then index may tank near 12450 – 12425 range.
Volatility expected due to expiry of the August’25 Monthly F&O Contracts and impact of imposition of additional 25% tariff or any new development on the matter.
Nifty - Monthly Expiry Day Analysis Aug 28The trend direction deciding zone is 24650. Bulls have to show strength, and if the price sustains above 24700, then it can move towards 24850. We are having nearby resistance at the 24850 zone.
If the price faces resistance around 24600 and is unable to break through it, then the movement will be bearish.
Buy above 24720 with the stop loss of 24660 for the targets 24760, 24820, 24860, and 24920.
Sell below 24600 with the stop loss of 24650 for the targets 24560, 24520, 24460, and 24400.
Always do your analysis before taking any trade.

Gold Plan (28/08) – Ahead of 3,400: Breakout or Correction to ??XAU/USD – Gold hits Storm Breaker 3400: Accumulation before breaking ATH?
1. Market Wave 🌍
Throughout last week, Gold continuously formed BOS (Break of Structure) , confirming that buyers remain in control.
Currently, price is consolidating around 3,394 – 3,400, right at the Storm Breaker 🌊 , the crucial barrier before heading towards the old ATH at 3,424.
The key question: Will Gold accumulate here and smash through ATH, or will it need a pullback to safe harbors before a strong rally in September?
2. Technical Analysis ⚙️
Storm Breaker 🌊 (Strong Resistance): 3400 – 3424 (old ATH). The gateway Gold must conquer to open a new bullish leg.
Golden Harbor 🏝️ (Key Support): 3375 – 3355 – 3330. Confluence with FVG + Fibonacci 0.5/0.618 , likely to attract liquidity if price corrects.
Short-term scenario: Price may pull back to Golden Harbor before breaking higher.
3. Captain Vincent’s Map – Trade Scenarios 🪙
🔺 Quick Boarding 🚤 (BUY Scalp – Rebound Priority)
Entry: 3353 – 3355
SL: 3349
TP: 3356 → 3359 → 3361 → 33xx
🔻 Storm Breaker 🌊 (SELL Reaction – Old ATH)
Entry: 3422 – 3424 (if tested)
SL: 3430
TP: 3419 → 3415 → 3410 → 3405 → 33xx
4. Captain’s Note ⚓
"The Gold ship is now pressing against Storm Breaker 🌊 3400 – 3424 . If it breaks through, the vast ocean opens a new trend. But if the waves push back, patiently wait at Golden Harbor 🏝️ to anchor and catch the September tide."

USD/CHF 15M Long SetupMarket washed out weak hands, now sitting at demand with liquidity grabbed.
Entry locked, risk defined — if this runs, bears will be forced to cover at higher levels.
Discipline over prediction.

DLFThe price fall for the first 30 minutes and then it was consolidating in a narrow range, forming a descending triangle. As long as the price is below 760, it is bearish.
Resistance: 760
Pattern: bearish
Pattern name: Descending triangle.
Sell below 750 with the stop loss of 756 for the targets 744, 736, 730, and 724.
Always do your analysis before taking any trade.

Bitcoin Bear OutlookHas the Bitcoin bull run ended? From my outlook, I see a strong push to the downside, followed by a potential retracement back up that could form a head-and-shoulders pattern, adding more confluence to my bearish view.

Gold (XAUUSD) 4H AnalysisPrice tapped into the supply zone and showed rejection.
If sellers hold this level, we can expect a sharp drop toward the previous demand area.
Watching for confirmation before execution.
I will update here exact entry and exit if Price gives me my setup

Gold Plan 27/08 – Captain Vincent (IN)XAU/USD – Trump strengthens control over the FED, Gold consolidates near Storm Breaker
1. News Wave 🌍
Trump: “We will soon have majority control at the FED. Miran may be moved to another position with a longer term.”
Trump: “I already have a candidate in mind to replace FED Governor L. Cook.”
US Senate: Preparing hearings next week for Trump’s nominee – S. Miran .
👉 Message: Trump is consolidating power within the FED. Market fears FED losing independence → USD volatility rises, Gold benefits from safe-haven flows .
2. Technical Outlook ⚙️
Gold is approaching Storm Breaker 🌊 (3400 – 3402) , overlapping with resistance 3392 – 3406 → profit-taking likely .
On H1, multiple FVGs remain unfilled around 3355 & 3330 → Price may correct to retest these supports before choosing direction.
Intraday bias: Range-bound → Sell at resistance, short Buy at supports.
3. Captain Vincent’s Map – Key Levels 🪙
Resistance (Kháng cự):
3406 – 3400 – 3392 (Storm Breaker 🌊)
Support (Hỗ trợ):
3372 (Minor Shield 🛡️)
3355 (Quick Boarding 🚤 – Buy Scalp Zone)
3344 (Intermediate Shield 🛡️)
3330 (Golden Harbor 🏝️ – Main Buy Zone)
4. Trade Scenarios 📌
🔻 SELL at Storm Breaker 🌊 (Priority)
Entry: 3400 – 3402
SL: 3408
TP: 3395 → 3393 → 3389 → 3386 → 33xx
🚤 BUY Scalp – Quick Boarding
Entry: 3353 – 3355
SL: 3345
TP: 3358 → 3361 → 3363 → 33xx
🏝️ BUY at Golden Harbor (Strong Support)
Entry: 3330 – 3332
SL: 3325
TP: 3335 → 3338 → 3341 → 33xx
5. Captain’s Note ⚓
"Gold today faces Storm Breaker 🌊 above, but multiple shields of support remain below. Smart traders will scalp quickly at Quick Boarding 🚤, or patiently wait for Golden Harbor 🏝️ to anchor safely."

BTCUSD Weekly – Supply Pressure vs Key Support (110K in Focus)On the weekly timeframe, BTC is trapped between major supply (117K–119K) and key support (110K–112K).
Supply Zone: Price has faced multiple rejections near 117K–119K, showing strong seller presence.
Order Block/Resistance: The yellow zone around 113K is acting as an active selling area, preventing BTC from reclaiming higher ground.
Support Zone: BTC is currently testing the 110K–112K support zone. If this level holds, we could see another attempt to reclaim 113K.
Scenarios:
1. Bullish Breakout (less likely unless strong volume appears):
Needs to reclaim 113K and break above 119K.
Target zone → 126K–134K.
Stop loss for longs → below 110K.
2. Bearish Breakdown (higher probability if 110K fails):
If 111K–110K zone breaks, BTC likely retests the 103K–106K demand zone.
If that fails → extended move possible toward 97K.
Stop loss for shorts → above 113.5K.
Bias: Neutral to Bearish unless BTC reclaims 113K with strong volume.

Gold about To Fly! ATH soon!Gold has been In Consolidation for past 5 Months.
4 occasions when it had settled near 3300.
It's about time for Gold to take Shorts For Cleaners?
This time around it's about to Settle near 3400.
3420 3440 will be Crucial for Bears to Defend if they wish to hold grip over this Consolidation.
Longs will get aggressive above 3440 3450 Targeting 3550 3750
😲
A prolonged consolidation could continue in case 3420 shows Profit Booking
For time Being 3375 3350 looks like providing support.
If it continues to Hold then it may build the Bull Case

Long escorts - for educational purposesI can see a breakout possibility. if it breaks out above this resistance with volume and a strong candle, long gets triggered atleast with a 1:2 RRR

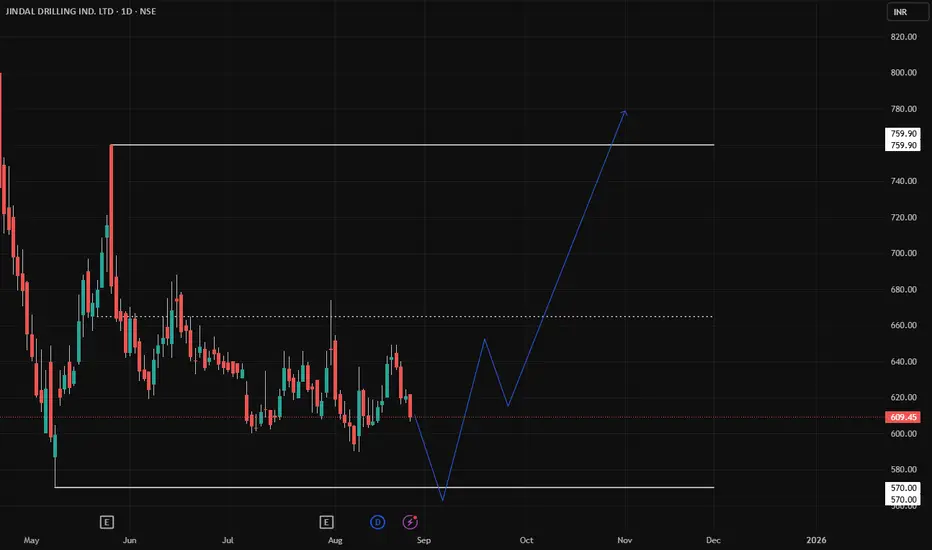
JINDRILL HTF Swing Trade SetupJINDRILL is currently trading within a range between ₹570 – ₹760.
Price is hovering near the lower band of this range. We can get a good long setup here if the level holds or shows a strong rejection.
USDJPY POTENTIAL SETUPPrice has pulled back into the H1 Fair Value Gap (FVG) and is showing signs of support. As long as this zone holds, the bias remains bullish with potential continuation towards the 147.93 liquidity level.
A clean rejection from the FVG would strengthen the case for further upside, while a breakdown below could invalidate the setup.
I will post here exact entry and exit if Price gives me my setup

Cummins 3836 Trendline Breakdown below 3815Cummins 3836 dated 26-8-2025
1. Trendline Breakdown below 3815
2. RSI in downward trend
Sell below 3810 SL 3885 target 3785-3770-3750-
3740-3725-3700
It is just a view, please trade at your own risk.

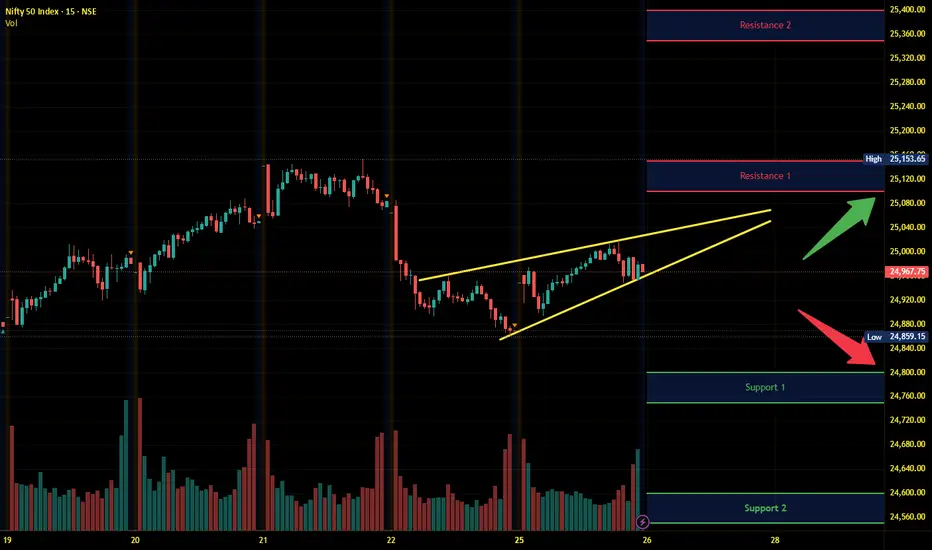
Nifty Intraday Analysis for 26th August 2025NSE:NIFTY
Index has resistance near 25100 – 25150 range and if index crosses and sustains above this level then may reach near 25350 – 25400 range.
Nifty has immediate support near 24800 – 24750 range and if this support is broken then index may tank near 24600 – 24550 range.
Profit booking expected before implementation date (27th August 2025, Market closed) of additional 25% tariff if no positive news surfaces.