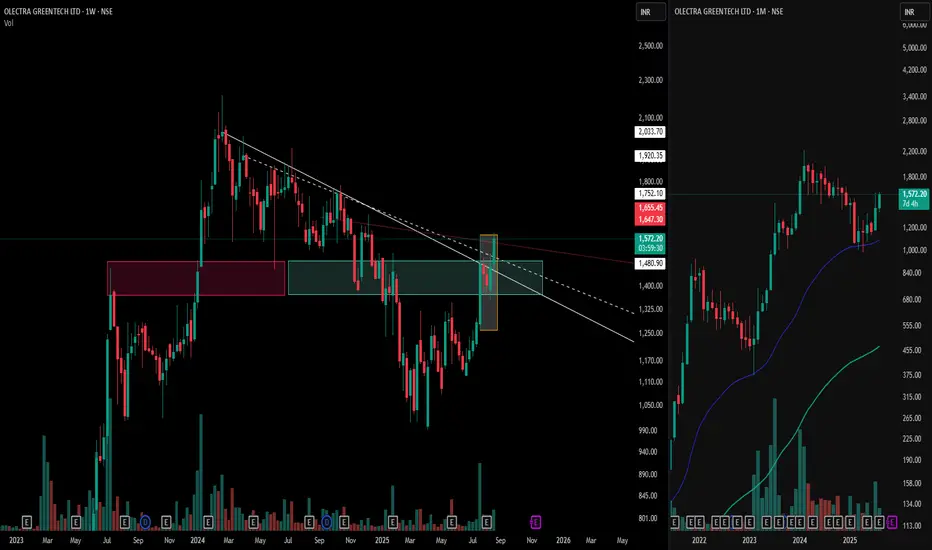
Olectra Greentech: Power of the Mother Candle & Zone Flip📊 White trendlines mark the crucial control trend and resistance levels.
🕯️ The bold Mother Candle (highlighted in the orange box) is marked .
💗 Notice the Pink Zone — formerly a tough resistance area — now flipped into strong support after the breakout, a classic supply-to-demand flip!
💎 The Cyan Box highlights an emerging demand zone, where buying interest gathers
⚡ Right side is a Representation of Market structure on the Biggest Time frame ( Monthly time frame ) showcasing a Higher high and Higher low formation and respecting the EMA plotted .
This is a stellar example of price structure and supply-demand dynamics in action—perfect study material for keen market observers.
⚠️ Disclaimer: This post is for educational and research purposes only. It does not constitute financial advice or a forecast. Always do your own analysis before making trading decisions.
Support and Resistance
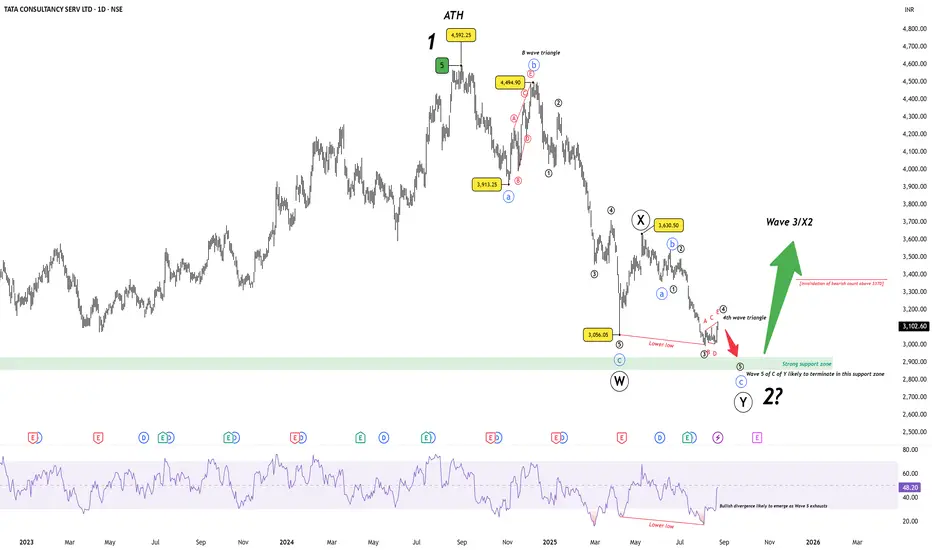
TCS – Wave 2 Correction Nearing Completion?TCS has been in a prolonged corrective phase since the all-time high at ₹4592. The decline has unfolded best as a W–X–Y double zigzag, with the current leg (Wave Y) progressing into its final stages.
Wave W ended at ₹3056 after a sharp A–B–C decline.
Wave X retraced to ₹3630.
Wave Y is in progress, and its C leg appears close to exhaustion. A mini 4th-wave triangle has developed, suggesting a final push lower remains.
The termination zone for Wave 2 is highlighted between ₹2926–₹2850, aligning with the prior Wave 4 support zone. Importantly, bullish divergence is likely to emerge on RSI if price makes a marginal new low.
Key Levels:
Support zone : 2926–2850 (probable Wave 2 low).
Bearish invalidation : A sustained move above 3370 would invalidate the immediate bearish count.
Bigger picture : If this structure holds, it would complete Wave 2 of a higher degree, setting the stage for a powerful Wave 3 rally ahead.
Disclaimer: This analysis is for educational purposes only and does not constitute investment advice. Please do your own research (DYOR) before making any trading decisions.
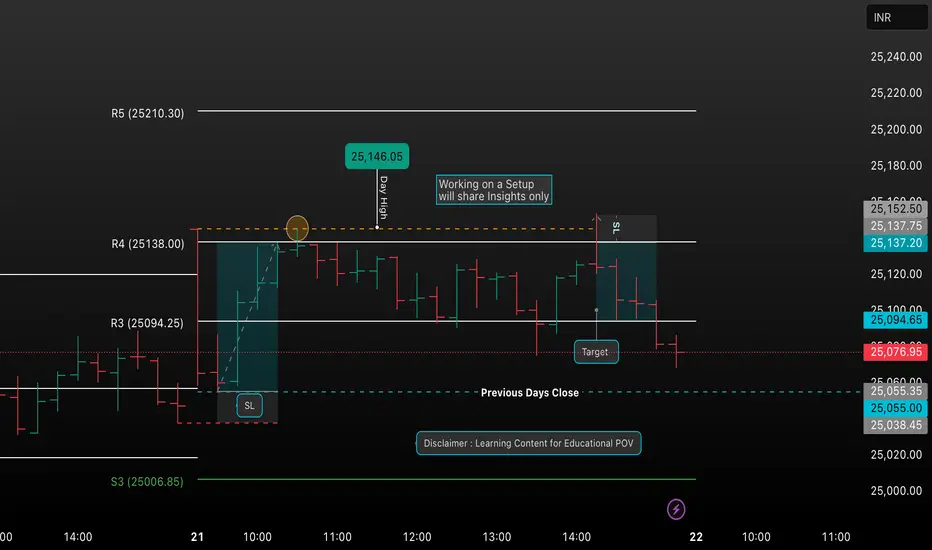
Learn & Trade: Nifty StrategiesDaily Nifty chart setups, insights, and detailed trade ideas. Follow for real-time analysis and educational tips—ideal for new and experienced traders looking to learn disciplined market strategies.”
2. “Sharing structured Nifty setups, key trading zones, and transparent trade planning. Join in for actionable analysis, risk management techniques, and a supportive learning environment for all traders.”
3. “A platform dedicated to simplifying technical analysis and real-world trading. Expect clear charts, honest reviews of trades, and an open community to discuss and improve each other’s strategies.”
You can use or adapt any of these as your TradingView chart post description or as a community introduction. This combination emphasizes your focus on actionable setups, ongoing learning, and engaging with fellow traders.
Indian Hotel Cmp 796 Dark Cloud Cover Candle @ top Indian Hotel Cmp 796 dated 21-8-2025
1. Dark Cloud Cover Candle @ top
2. RSI reversal
Sell below 790 SL 812 target 785-780-775-770-765
760-755-750
It is just a view, please trade at your own risk.

XAUUSD GOLD ANALYSIS ON(21/08/20025)#XAUUSD UPDATEDE
Current price - 3328
If price stay above 3310 then next target 3355,3375 and below that 3310
Plan;If price break 3328-3323 area,and stay above 3330,we will place buy order in gold with target of 3355,3375 & stop loss should be placed at 3310

Jindal Stainless Cmp 774 Shooting Star Candle @ TopJindal Stainless Cmp 774 dated 21-8-2025
1. Shooting Star Candle at Top in uptrend
Sell below 768 SL 798 target 765-760-755-750-740-730-720
It is just a view, please trade at your own risk.

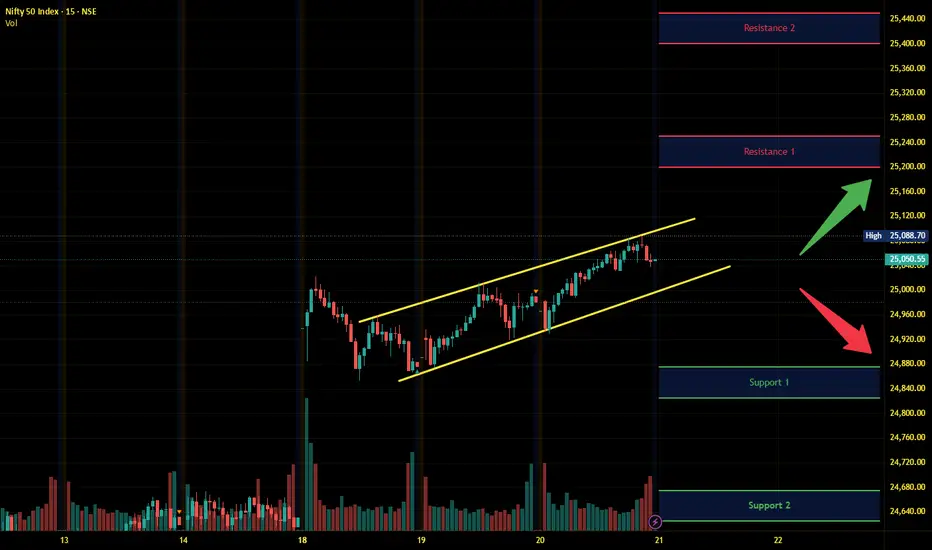
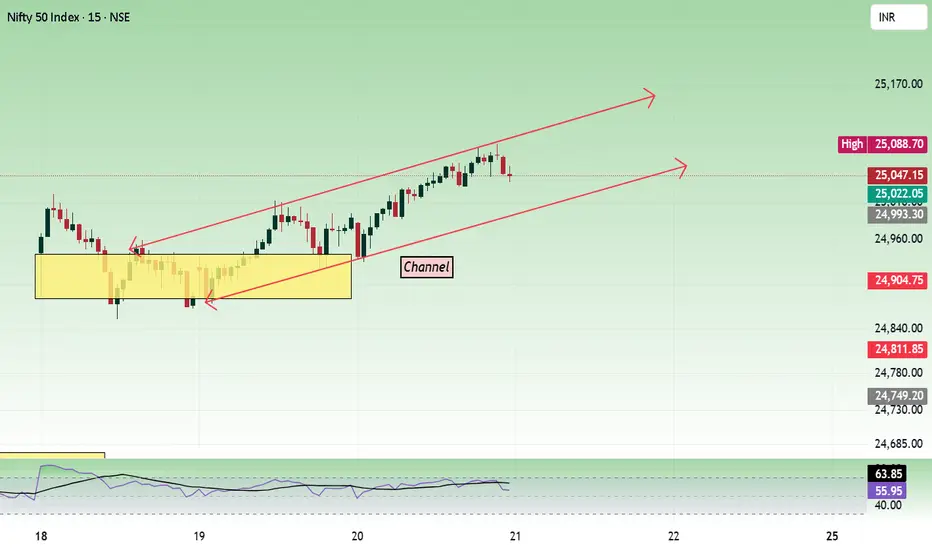
Nifty Intraday Analysis for 21st August 2025NSE:NIFTY
Index has resistance near 25200 – 25250 range and if index crosses and sustains above this level then may reach near 25400 – 25450 range.
Nifty has immediate support near 24875 – 24825 range and if this support is broken then index may tank near 24675 – 24625 range.
Banknifty Intraday Analysis for 21st August 2025NSE:BANKNIFTY
Index has resistance near 56100 – 56200 range and if index crosses and sustains above this level then may reach near 56600– 56700 range.
Banknifty has immediate support near 55300 - 55200 range and if this support is broken then index may tank near 54800 - 54700 range.

Finnifty Intraday Analysis for 21st August 2025NSE:CNXFINANCE
Index has resistance near 26650 - 26700 range and if index crosses and sustains above this level then may reach near 26850 - 26900 range.
Finnifty has immediate support near 26300 – 26250 range and if this support is broken then index may tank near 26100 – 26050 range.

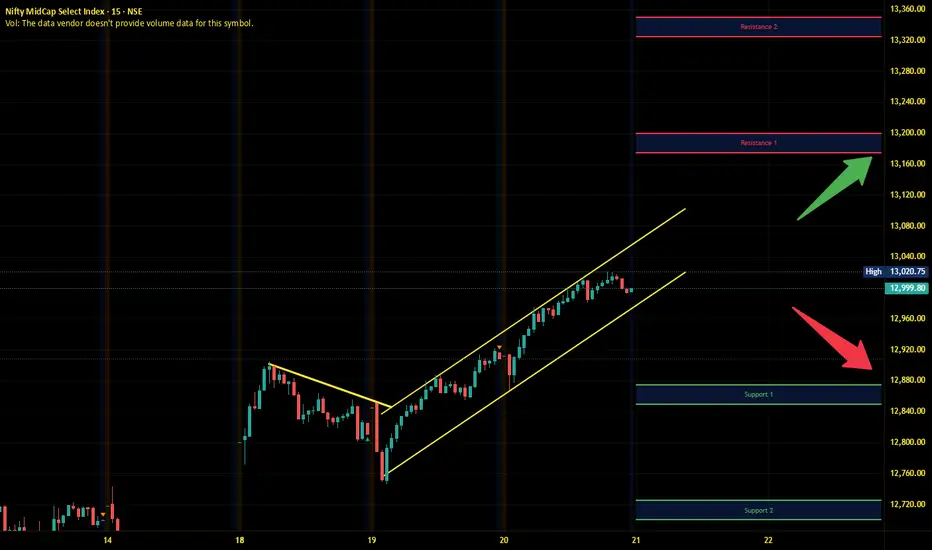
Midnifty Intraday Analysis for 21st August 2025NSE:NIFTY_MID_SELECT
Index has immediate resistance near 13175 – 13200 range and if index crosses and sustains above this level then may reach 13325 – 13350 range.
Midnifty has immediate support near 12875 – 12850 range and if this support is broken then index may tank near 12725 – 12700 range.
DMART BREAKINGLONG TERM RESISTANCE WEEKLYDMART breaking long time resistance on weekly chart
huge volume, bullish RSI above 60
trading above 20 ema
GST Reform effect
target1 4900 target2 5400
sl 3900 use ur own sl
NO BUY/SELL RECOMENDATION

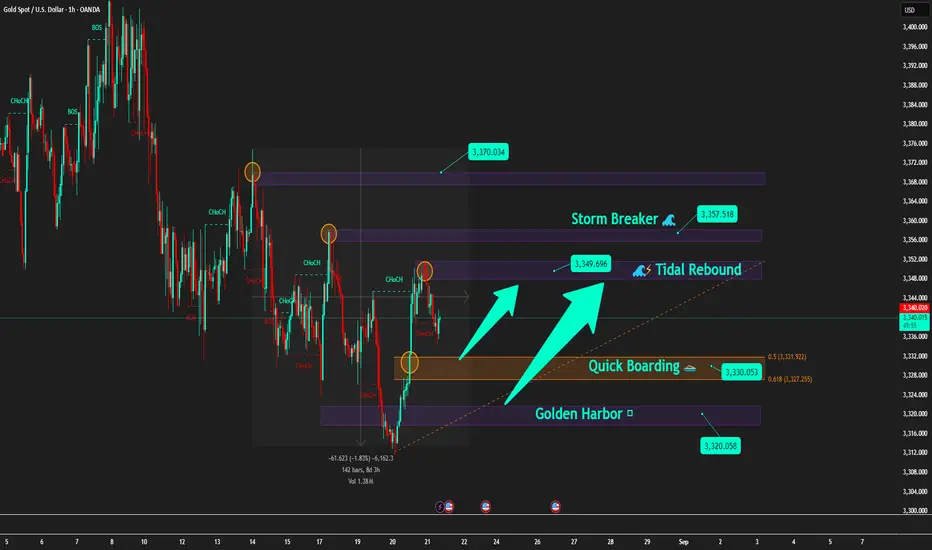
Gold after FOMC: Just a pullback or the start of a new wave?[Background
After the early morning FOMC session , Gold is showing signs of a sell-side pullback to gain momentum.
On higher timeframes (H4–D1), the structure remains bearish with lower highs .
However, consistent buying pressure around 3320 – 3330 keeps this zone as the key battlefield .
🪙 Key Levels Today
🔹 Storm Breaker 🌊 (Sell Zone 3357 – 3355)
SL: 3362
TP: 3350 → 3345 → 3340 → 33xx
🔹 Tidal Rebound 🌊⚡ (Sell Scalp 3349 – 3347)
SL: 3353
TP: 3345 → 3340 → 3335 → 33xx
🔹 Quick Boarding 🚤 (Buy Scalp 3330 – 3328)
SL: 3322
TP: 3335 → 3337 → 3339 → 3341
🔹 Golden Harbor 🏝️ (Buy Zone 3320)
SL: 3313
TP: 3325 → 3330 → extend further
📌 Trading Scenarios
After FOMC, the market may show rebound waves .
During Asia–Europe, price may consolidate between 3345 – 3357 .
If price tests Storm Breaker 🌊 → Prioritise Sell setups in line with the main bearish trend.
If price drops to Quick Boarding 🚤 or Golden Harbor 🏝️ → Short-term Buy scalps on pullback moves.
📰 Market Context
FED remains dovish leaning , with high probability of a rate cut in September (~82%, CME FedWatch) .
Geopolitical variables (Trump–Putin, Ukraine) remain unpredictable and may spark sudden volatility.
⚓ Captain’s Note
"Let Storm Breaker 🌊 test the buyers’ strength. Those who board at Golden Harbor 🏝️ will be lifted by the waves, but those who drift into the storm will soon feel the sea’s fury."
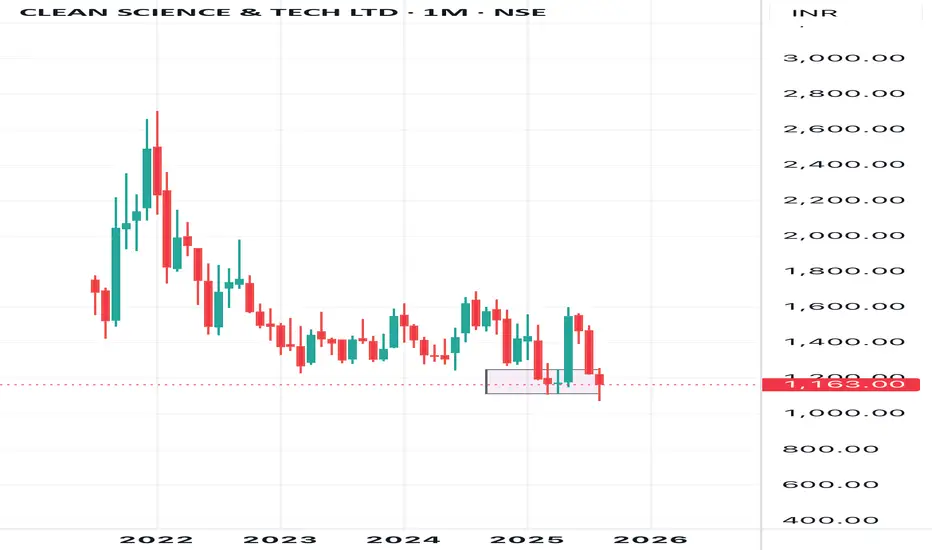
Clean Science: A Hold on Shaky Ground
We are initiating coverage on Clean Science and Technology with a Hold recommendation. The company's strong fundamentals are currently overshadowed by significant near-term risks and a high valuation.
Investment Case
Clean Science is a global leader in its niche, known for its strong financials and high-quality products. However, the stock's recent performance has been concerning, with the price now trading at or near its all-time low since its listing in 2021. The market is reacting to a major promoter stake sale via a block deal, which has created uncertainty.
Technical Analysis
* The stock is currently trading at or near its all-time low since its IPO in July 2021.
* It is in a significant downward trend, with its share price recently falling sharply.
* This downward move was triggered by a large promoter stake sale, and the stock is currently testing a key support level. A break below this level could lead to further decline.
The Bull Case
* Global Dominance: The company is a leading manufacturer of specialty chemicals and holds a dominant position in its key products.
* Strong Financials: Clean Science maintains high profit margins and has a debt-free balance sheet, providing financial stability.
* Sustainable Innovation: Its focus on eco-friendly, in-house R&D gives it a competitive edge in the long run.
The Bear Case
* Promoter Selling: The recent block deal by a promoter has shaken market confidence and is the primary reason for the sharp price drop.
* Premium Valuation: Despite the significant price fall, the stock still trades at a high valuation, which leaves it vulnerable to any further negative news.
* Sectoral Headwinds: The broader specialty chemicals sector is facing a slowdown, which could impact the company's future revenue and earnings.
XAUUSD | 21/08/2025 Technical AnalysisHello,
Gold is create Same HH and moving HL pattern on daily timeframe. Soon we can see it moving towards ATH. One retracement is pending then we can see start of new uptrend move.
Disclaimer: This is only for educational purpose.
Thanks

LIC (Life Insurance Corp of India) – At a Critical Support ZonePrice has pulled back into a strong demand zone, which has acted as a base since the early structure. If this zone holds, we could be looking at the start of Wave 5 thrust, with potential to retest recent highs near 980 and beyond.
The RSI is holding higher lows , suggesting underlying strength despite the correction.
However, risk management is key:
If 874 support fails, then Wave 4 might not be complete yet, and price could slide further to retest the long-term trendline support (currently aligned near 760).
The bullish invalidation for this count sits below 760.
So, the playbook is simple:
Above 874 → bias for Wave 5 continuation.
Below 874 → extended Wave 4 correction toward trendline.
Disclaimer: This analysis is for educational purposes only and does not constitute investment advice. Always do your own research (DYOR) before making trading decisions.

XAUUSD GOLD ANALYSIS ON(20/08/2025)#XAUUSD UPDATEDE
Current price - 3341
If price stay above 3330 then next target 3365,3380 and below that 3312
Plan;If price break 3343-3340 area,and stay above 3345,we will place buy order in gold with target of 3365,3380 & stop loss should be placed at 3330

Nifty Intraday Analysis for 20th August 2025NSE:NIFTY
Index has resistance near 25150 – 25200 range and if index crosses and sustains above this level then may reach near 25350 – 25400 range.
Nifty has immediate support near 24800 – 24750 range and if this support is broken then index may tank near 24600 – 24550 range.

Banknifty Intraday Analysis for 20th August 2025NSE:BANKNIFTY
Index has resistance near 56400 – 56500 range and if index crosses and sustains above this level then may reach near 56900– 57000 range.
Banknifty has immediate support near 55500 - 55400 range and if this support is broken then index may tank near 55000 - 54900 range.

Finnifty Intraday Analysis for 20th August 2025NSE:CNXFINANCE
Index has resistance near 26850 - 26900 range and if index crosses and sustains above this level then may reach near 27100 - 27150 range.
Finnifty has immediate support near 26400 – 26350 range and if this support is broken then index may tank near 26150 – 26100 range.

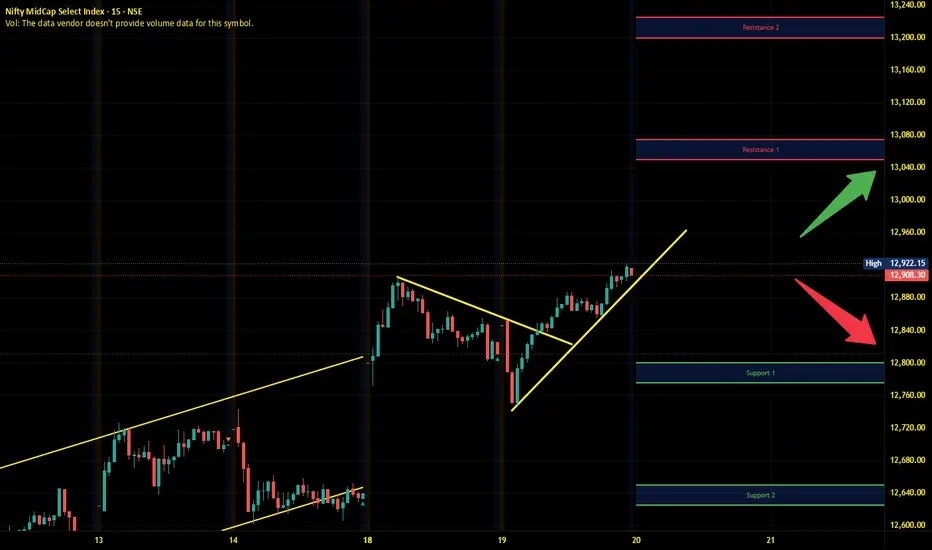
Midnifty Intraday Analysis for 20th August 2025NSE:NIFTY_MID_SELECT
Index has immediate resistance near 13050 – 13075 range and if index crosses and sustains above this level then may reach 13300– 13225 range.
Midnifty has immediate support near 12800 – 12775 range and if this support is broken then index may tank near 12650 – 12625 range.
Nifty - Expiry day analysis Aug 21Today price took support from the 24900 zone and moved up. Movement was with less trend strength. If the price does not gain strength, we can expect a range move between 24900 to 25100 levels. 25000 is a strong support.
Buy above 25020 with the stop loss of 24970 for the targets 25060, 25100, 25160, and 25220.
Sell below 24900 with the stop loss of 24950 for the targets 24860, 24800, 24760, and 24700.
Always do your analysis before taking any trade.
VEDANTA Swing Trade with 1:3 RR (Long)Sellers failed to take price below the demand zone and a clear Change of Character (market structure shift) happened that shows buyers have taken control of the price of Vedanta.
So if Nifty and Metal sector are not bearish in coming sessions, then it is high probability that Vedanta will touch Rs 475.
Don't use hard SL. Manage position sizing as it is a high probability setup.
Connect with me if you have any questions. I am happy to help.
ChoCh - Change of Character
Sw or Sweep - Liquidity Sweep
BoS - Break of Structure

Buy Mobikwik for Short-term✅️Buy mobikwik with given levels for shorterm.
💲Also for longterm looks good as the company about to start broking business
↗️Increase in revenue expected.
↗️Fii & Mutual fund increase stake in june quarter.
