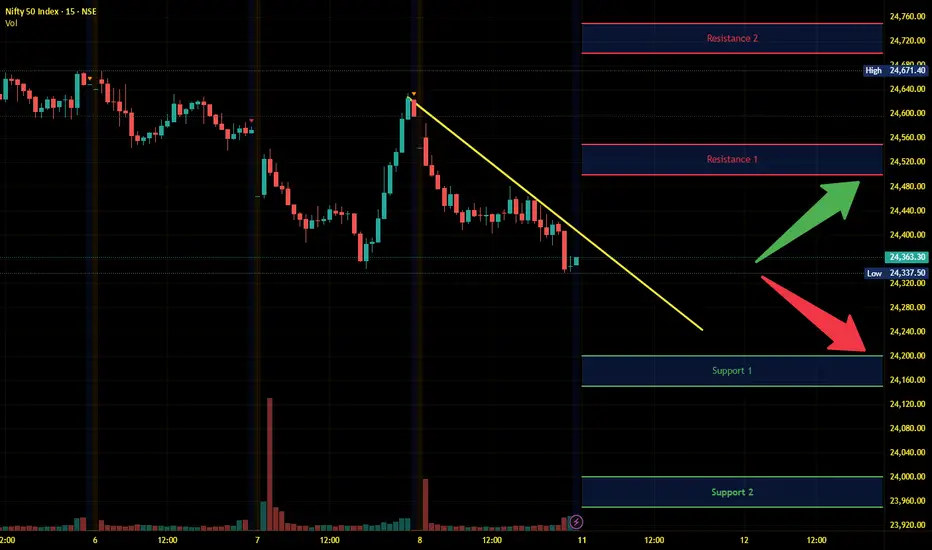
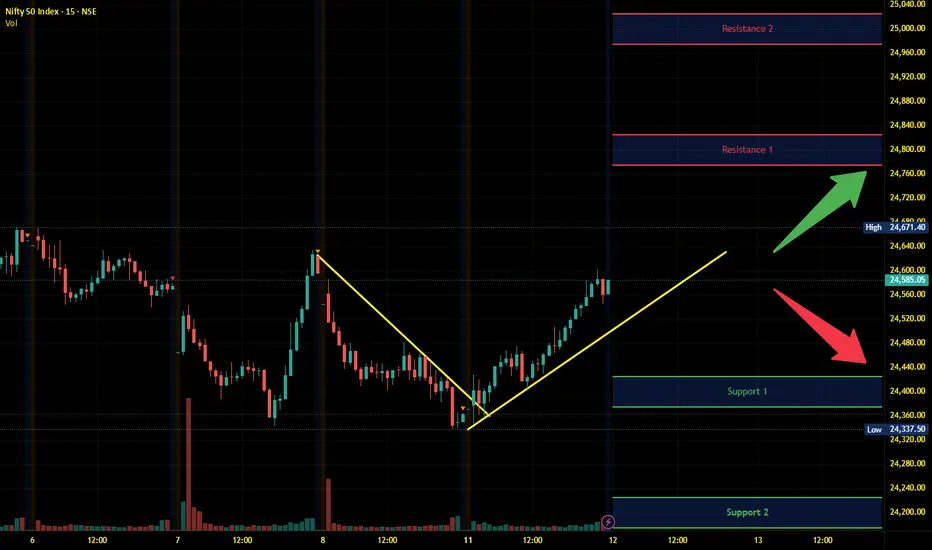
Nifty Intraday Analysis for 14th August 2025NSE:NIFTY
Index has resistance near 24800 – 24850 range and if index crosses and sustains above this level then may reach near 25000 – 25050 range.
Nifty has immediate support near 24500 – 24450 range and if this support is broken then index may tank near 24300 – 24250 range.
Support and Resistance

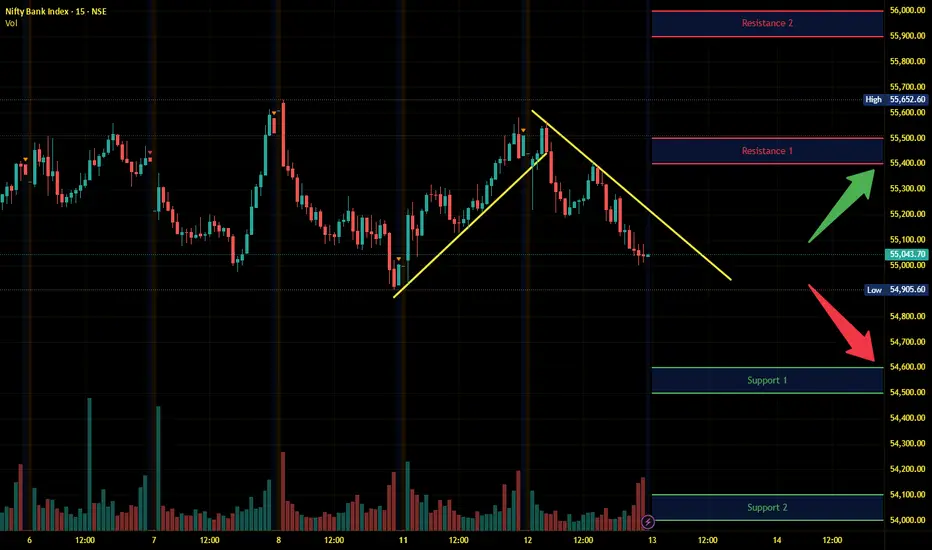
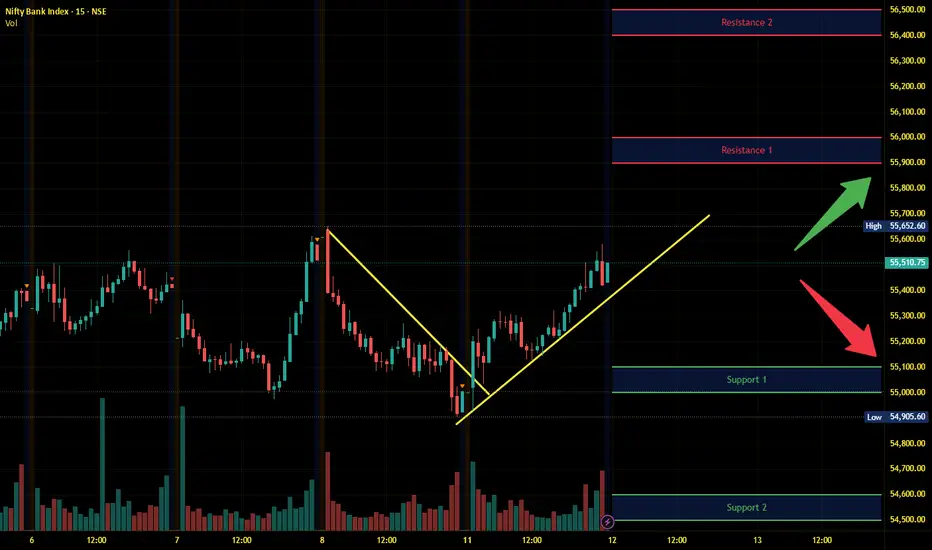
Banknifty Intraday Analysis for 14th August 2025NSE:BANKNIFTY
Index has resistance near 55600 – 55700 range and if index crosses and sustains above this level then may reach near 56100– 56200 range.
Banknifty has immediate support near 54700 - 54600 range and if this support is broken then index may tank near 54200 - 54100 range.

Finnifty Intraday Analysis for 14th August 2025NSE:CNXFINANCE
Index has resistance near 26475 - 26525 range and if index crosses and sustains above this level then may reach near 26700 - 26750 range.
Finnifty has immediate support near 26050 – 26000 range and if this support is broken then index may tank near 25800 – 25750 range.

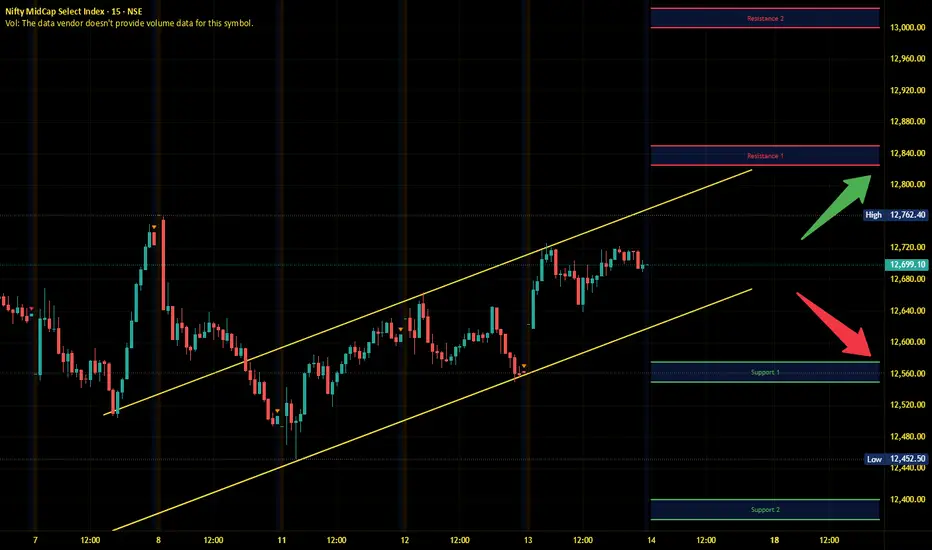
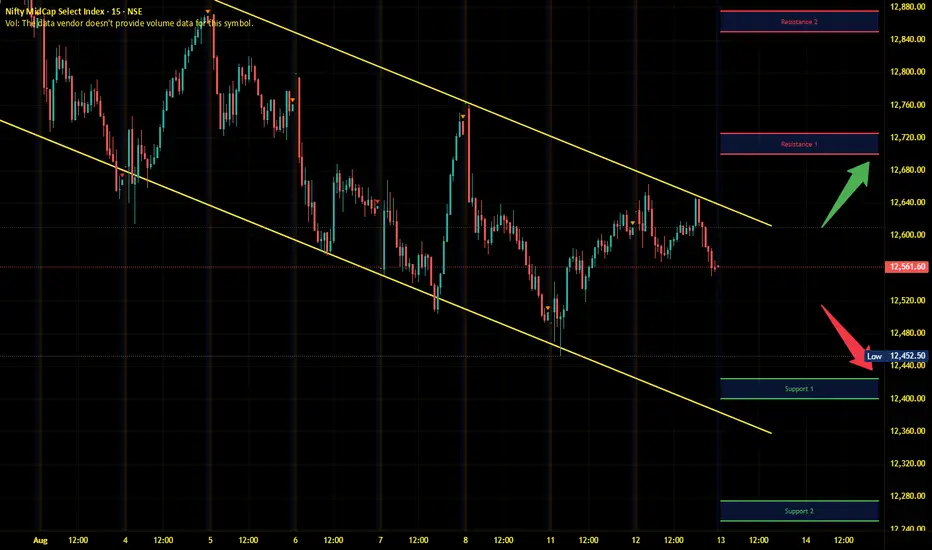
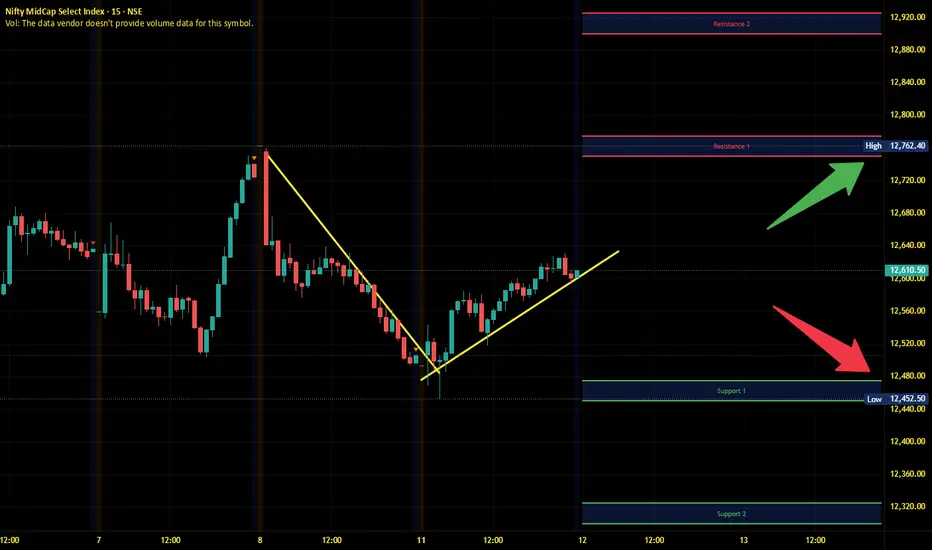
Midnifty Intraday Analysis for 14th August 2025NSE:NIFTY_MID_SELECT
Index has immediate resistance near 12825 – 12850 range and if index crosses and sustains above this level then may reach 13000– 13025 range.
Midnifty has immediate support near 12575 – 12550 range and if this support is broken then index may tank near 12400 – 12375 range.
Crizac Ltd: Breaking Out with Strong FundamentalsCrizac Ltd operates as an asset-light overseas education platform, connecting thousands of student recruitment agents with global universities, primarily in the UK, Ireland, Canada, and other markets.
Key Financial Highlights (FY25)
Revenue: ₹849 Cr (+60% YoY)
PAT: ₹153 Cr (+30% YoY)
Operating Margin: ~25%
ROE: ~36% | ROCE: ~48%
Debt-to-Equity: 0.00x (virtually debt-free)
Cash Flow: Strong operating cash flows with modest capex needs
Strengths:
High growth and returns with minimal capital employed
Strong promoter holding (~80%) ensures alignment
Diversified agent network (~10,362 registered, ~3,948 active in FY25)
Risks:
Heavy UK revenue concentration (~95% in FY25)
Dependence on top 3 institutions (~53% revenue share)
Rising receivable days (~91 days FY25 from 67 days FY24)
Technical Analysis
Chart Structure
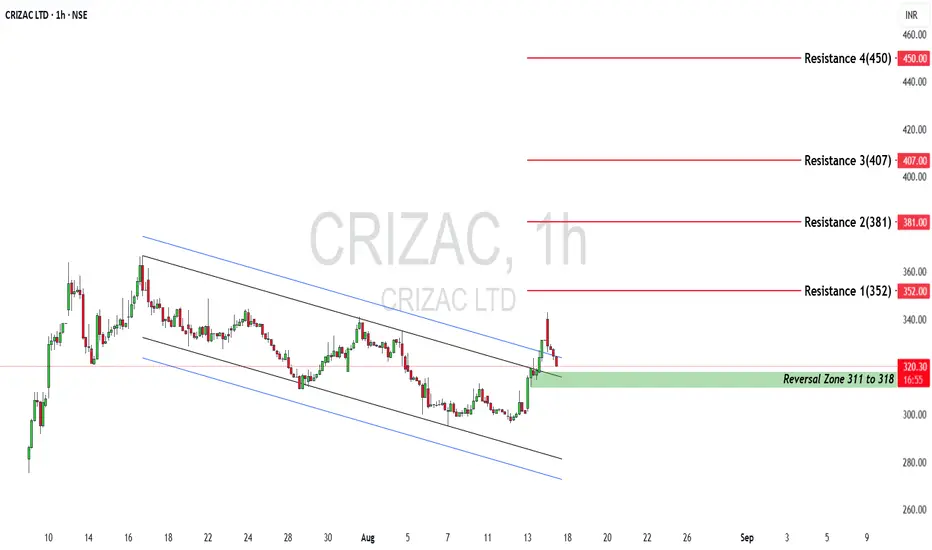
On the 1-hour timeframe, CRIZAC had been trading within a downward-sloping channel since mid-July, marked by consistent lower highs and lower lows. The recent price action shows a decisive breakout above the upper trendline of this channel, signaling potential reversal momentum.
Key Technical Levels
Reversal Zone (Support): ₹311–₹318
Immediate Resistance 1: ₹352
Next Resistance 2: ₹381
Resistance 3: ₹407
Major Resistance 4: ₹450
Interpretation
The breakout from the descending channel, with price now sustaining above the ₹318 reversal zone, is a bullish technical signal.
If momentum sustains, the stock could test the ₹352–₹381 zone in the short term.
A close above ₹381 could open the path toward ₹407 and eventually ₹450.
On the downside, failure to hold ₹318 may see the stock re-enter the previous channel, retesting lower supports.
Techno-Fundamental View
The fundamentals support the breakout story:
High ROCE/ROE with debt-free balance sheet
Consistent revenue and PAT growth
Strong free cash flow generation
The technical breakout adds a near-term bullish trigger, suggesting that investor sentiment is aligning with the company’s strong business performance.
However, the key to sustaining the uptrend will be:
Confirmation of higher volumes on breakout
Continued positive earnings momentum in upcoming quarters
Any progress on geographic diversification to reduce UK dependency
Bottom Line
Crizac Ltd is transitioning from a consolidation phase to potential upside momentum, backed by strong operational and financial performance. The breakout above the downtrend channel, coupled with a robust business model, makes the current setup attractive for growth-oriented investors—provided they can tolerate the risks of geographic concentration and post-IPO volatility.
Disclaimer: lnkd.in
ILV Setup – Consolidation at Major SupportAfter a strong rally, ILV has pulled back and is now consolidating within a major support zone — setting the stage for a potential next leg higher.
Trade Setup:
• Entry Zone: $17.00 – $18.00
• Take Profit Targets:
🥇 $20.00 – $24.00
🥈 $29.00 – $35.00
• Stop Loss: Just below $16.00

BTCUSD Analysis on (03/08/2025)BTCUSD UPDATEDE
Current price - 113400
If price stay above 109000,then next target 116500,119000,122000 and below that 105000
Plan; if price break 112500-111500 area and above that 113500 area,we will place buy oder in BTCUSD with target of 116500 and 122000 & stop loss should be placed at 109000

Nifty - Expiry day analysis - Aug 14We had a choppy movement today as the price did not gain strength to give a trending move. Sustaining above 24600 is important to be bullish. If the price is unable to gain strength, then we may get a choppy range between 24500 to 24700.
Buy above 24620 with the stop loss of 24570 for the targets 24660, 24700, 24760 and 24800.
Sell below 24480 with the stop loss of 24530 for the targets 24440, 24400, 24340 and 24300.
Always do your analysis before taking any trade.

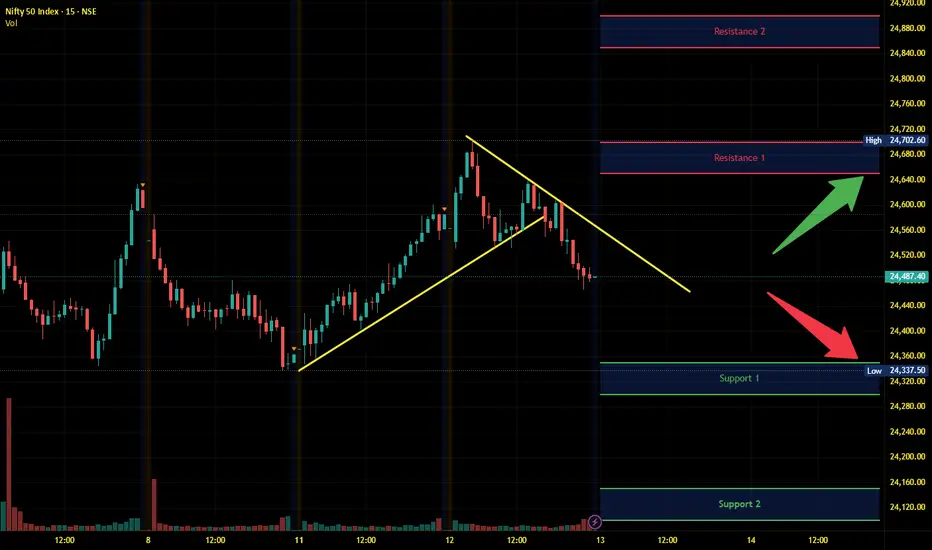
Nifty Intraday Analysis for 13th August 2025NSE:NIFTY
Index has resistance near 24650 – 24700 range and if index crosses and sustains above this level then may reach near 24850 – 24900 range.
Nifty has immediate support near 24350 – 24300 range and if this support is broken then index may tank near 24150 – 24100 range.
Banknifty Intraday Analysis for 13th August 2025NSE:BANKNIFTY
Index has resistance near 55400 – 55500 range and if index crosses and sustains above this level then may reach near 55900– 56000 range.
Banknifty has immediate support near 54600 - 54500 range and if this support is broken then index may tank near 54100 - 54000 range.
Finnifty Intraday Analysis for 13th August 2025NSE:CNXFINANCE
Index has resistance near 26375 - 26425 range and if index crosses and sustains above this level then may reach near 26600 - 26650 range.
Finnifty has immediate support near 26000 – 25950 range and if this support is broken then index may tank near 25750 – 25700 range.

Midnifty Intraday Analysis for 13th August 2025NSE:NIFTY_MID_SELECT
Index has immediate resistance near 12700 – 12725 range and if index crosses and sustains above this level then may reach 12850– 12875 range.
Midnifty has immediate support near 12425 – 12400 range and if this support is broken then index may tank near 12275 – 12250 range.
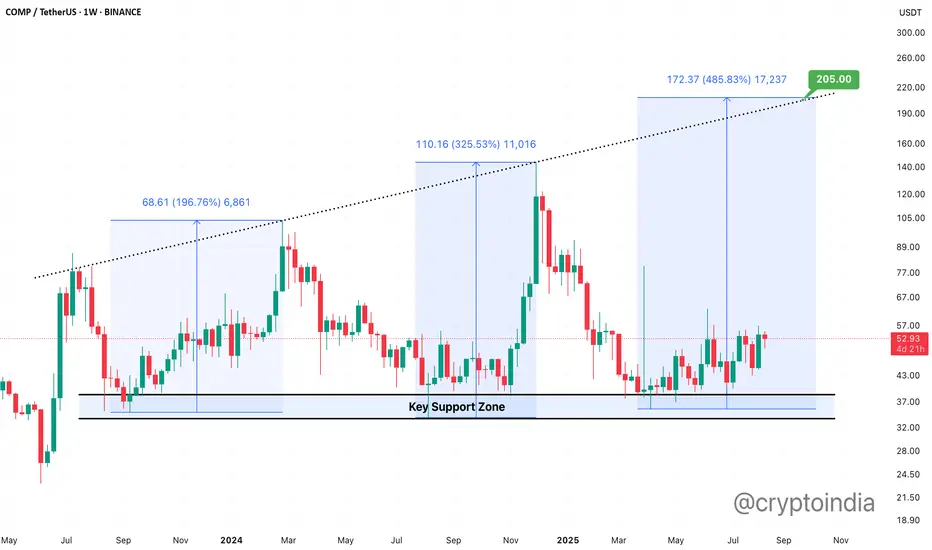
COMP Ready for a Monster Move!The last two moves from the key support zone delivered +200% and +300% 🔥
Now, the setup is screaming a potential +400% explosion! 💥
History loves to repeat… are you ready? 👀
Sensex - Expiry day analysis Aug 12The morning session was within a range, and the afternoon session gave a breakout of that range, and now the price is at an important support zone.
80450 to 80750 zone is important, and the price can move in this range if it does not gain strength.
Buy above 80580 with the stop loss of 80420 for the targets 80720, 80900, 81040, 81200, 81360, and 81480.
Sell below 80300 with the stop loss of 80420 for the targets 80200, 80060, 79920, 79800, 79660, and 79540.
Always do your analysis before taking any trade.

Nifty Intraday Analysis for 12th August 2025NSE:NIFTY
Index has resistance near 24775 – 24825 range and if index crosses and sustains above this level then may reach near 24975 – 25025 range.
Nifty has immediate support near 24425 – 24375 range and if this support is broken then index may tank near 24225 – 24175 range.
Banknifty Intraday Analysis for 12th August 2025NSE:BANKNIFTY
Index has resistance near 55900 – 55000 range and if index crosses and sustains above this level then may reach near 55400– 55500 range.
Banknifty has immediate support near 55100 - 55000 range and if this support is broken then index may tank near 54600 - 54500 range.
Finnifty Intraday Analysis for 12th August 2025NSE:CNXFINANCE
Index has resistance near 26600 - 26650 range and if index crosses and sustains above this level then may reach near 26800 - 26850 range.
Finnifty has immediate support near 26250 – 26200 range and if this support is broken then index may tank near 26050 – 26000 range.

Midnifty Intraday Analysis for 12th August 2025NSE:NIFTY_MID_SELECT
Index has immediate resistance near 12750 – 12775 range and if index crosses and sustains above this level then may reach 12900– 12925 range.
Midnifty has immediate support near 12475 – 12450 range and if this support is broken then index may tank near 12325 – 12300 range.
Nifty swing Pullback Failure 15mins Hello,
Nifty again bounce from previous low/support levels of 24350 to high of 24700 and pullback is failed and falled again CMP 24510 ......50SMA support and RSI adjusted from overbought also more than 50% retracement near by 61% reatrce making it good Pullback Reversal Set up for swing+postional

Gold Plan 12/08 – Captain VincentGold Plan 12/08 – Captain Vincent ⚓
Background:
After sliding from the Storm Breaker 🌊, Gold has broken below the 3358 zone and successfully retested it. The ship is now heading straight towards the Buy Scalp – Quick Boarding 🚤 dock.
Today’s Plan: Only buy when price reaches the pre-defined support zones — no chasing in open waters.
Zone 1 – Quick Boarding 🚤 (Buy Scalp)
Entry: 3,333 – 3,331
SL: 3,327
TP: 3,336 → 3,339 → 3,342 → 3,345 → 3,348 → 33xx
Note: Fast in & out. Take partial profits at each TP hit.
Zone 2 – Golden Harbor 🏝️ (Main Buy Zone)
Entry: 3,311 – 3,309
SL: 3,305
TP: 3,315 → 3,319 → 3,323 → 3,327 → 3,331 → 33xx
Note: Main accumulation zone. Hold longer if buying momentum stays strong.
Today’s Scenarios:
If price hits Quick Boarding → Wait for a reversal signal (pin bar, engulfing) on M15/H1 before entering.
If price dips to Golden Harbor → Observe the bounce strength; enter only on clear confirmation.
If neither zone is touched → Stay on the shore; wait for the next voyage.
Captain’s Note:
“The Gold ship has left the 3358 waters, turning its bow towards Quick Boarding 🚤. If docking is smooth, the crew will sail out swiftly to the open seas. Golden Harbor 🏝️ remains the main refuge if stronger waves push deeper.”

SJVNThe stock appears to be reversing from the Fibonacci retracement levels, in the aligning with the 200 EMA and 200 DMA on the weekly timeframe.

XAUUSD GOLD ANALYSIS ON (12/08/2025)#XAUUSD UPDATEDE
Current price - 3355
If price stay below 3375, then next target 3332,3320 and above that 3390
Plan;If price break 3360-3365 area, and stay below 3360, we will place sell order in gold with target of 3332 and 3320 & stop loss should be placed at 3375

Nifty Intraday Analysis for 11th August 2025NSE:NIFTY
Index has resistance near 24500 – 24550 range and if index crosses and sustains above this level then may reach near 24700 – 24750 range.
Nifty has immediate support near 24200 – 24150 range and if this support is broken then index may tank near 24000 – 23950 range.