Trend Reversal Rejection Strategy | Higher High + Candle Confirm🔍 Idea Summary:
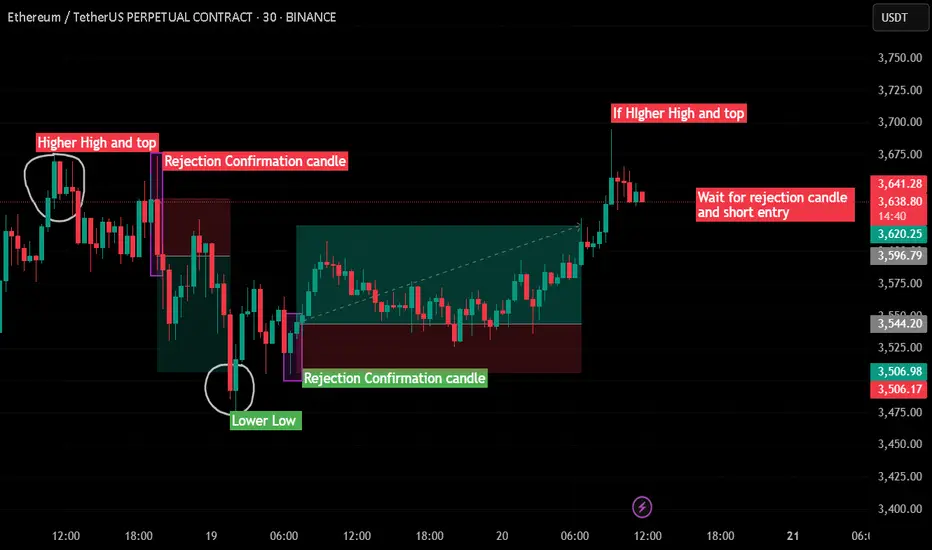
This strategy focuses on identifying trend reversal zones using classic Higher High (HH) and Lower Low (LL) structures followed by rejection confirmation candles.
🔻 Short Setup:
Price forms a Higher High.
Wait for a rejection candle (long wick, body closes inside previous range).
Confirm structure break and take short entry on confirmation.
✅ Example: On the left side of the chart, price printed a HH, followed by a strong rejection candle. That led to a clean move downward.
🔺 Long Setup:
Price forms a Lower Low.
Watch for a rejection candle near key support.
Enter long trade after confirmation.
✅ Example: Mid-chart shows price breaking to LL, then instantly rejecting with a strong bullish candle. Followed by a sustained move up.
🔴 Current Price Action:
Price is testing a potential new Higher High.
📌 Strategy suggests: Wait for a bearish rejection candle before shorting!
📈 Strategy Benefits:
Avoids impulsive entries
Combines structure with candle logic
Great for reversal traders and range scalpers
🔥 Like & follow for more real-time trading ideas!
💬 Drop your thoughts or questions below – let’s grow together, traders! 💪
#ETHUSDT #PriceAction #RejectionCandle #TrendReversal #SupportResistance #Scalping #TradingStrategy #Crypto #ChartPatterns #TechnicalAnalysis
Support and Resistance
Tata MotorsWeekly charts have been more reliable.
Tata motors is now following a cup and handle pattern and taking retracement at a support 480
big buy deal with reversal at 480

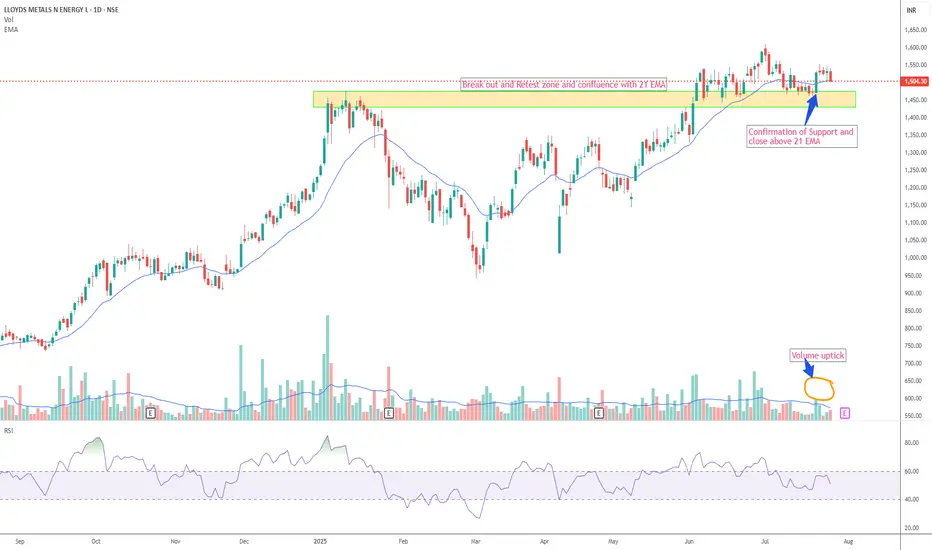
LLOYDSME – Breakout Retest with 21 EMA ConfluenceAs part of my personal trading strategy, I am closely watching LLOYDSME, which is currently retesting a recent breakout zone and hovering near a key support level. This area also coincides with the 21 EMA on the daily chart, adding to the technical confluence.
I am considering a long position if the price action confirms support at this level, in line with my predefined risk management rules. From my perspective, the current chart structure offers a potentially favorable risk-reward setup, with scope for upward movement if the retest holds.
Disclaimer
This analysis reflects my personal views and is shared for educational and informational purposes only. It does not constitute investment advice or a recommendation. I am not a SEBI-registered investment advisor. Please consult a qualified financial advisor and do your own due diligence before making any investment decisions.
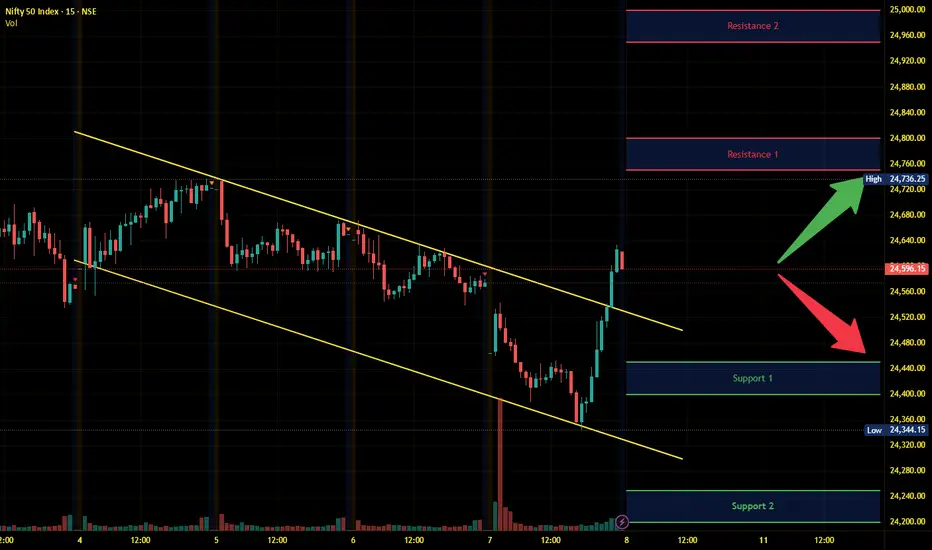
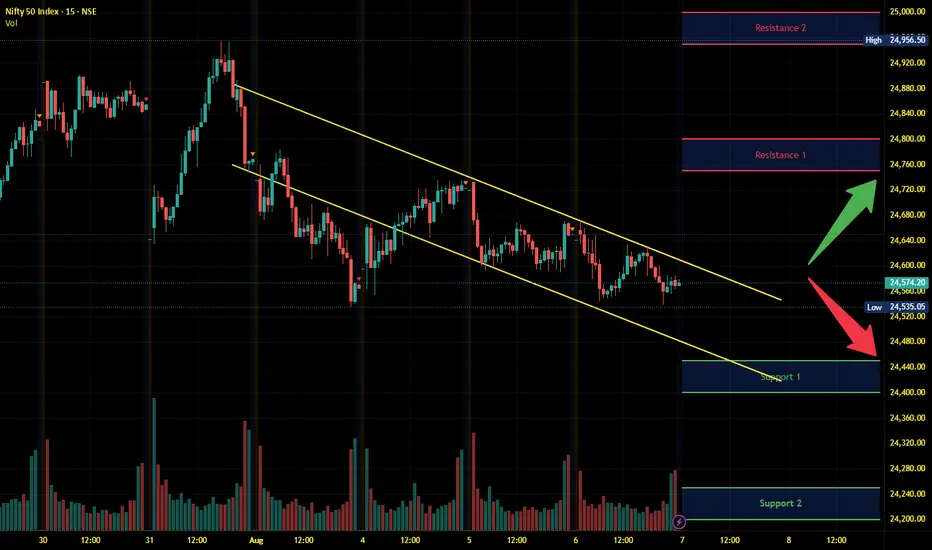
Nifty Intraday Analysis for 08th August 2025NSE:NIFTY
Index has resistance near 24750 – 24800 range and if index crosses and sustains above this level then may reach near 24950 – 25000 range.
Nifty has immediate support near 24450 – 24400 range and if this support is broken then index may tank near 24250 – 24200 range.
Volatility expected due to further executive orders to be issued by the US President.
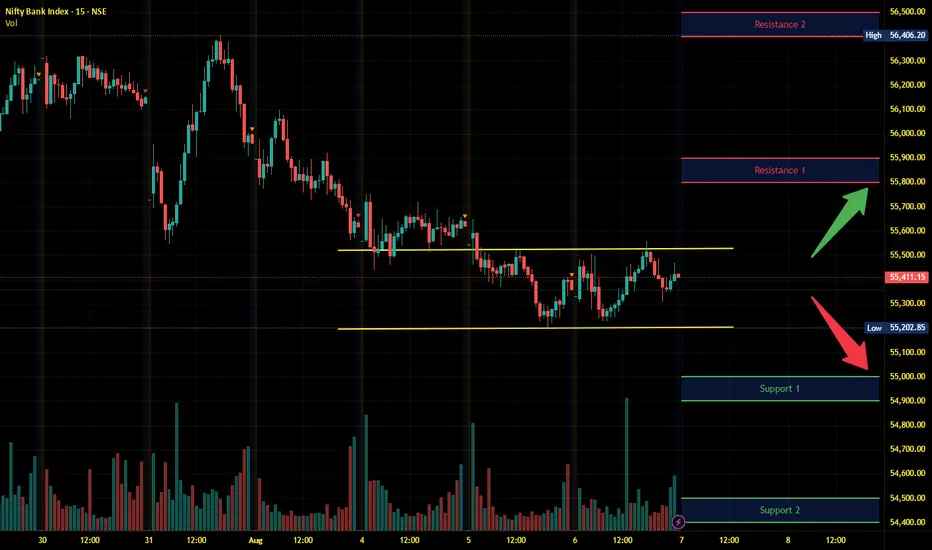
Banknifty Intraday Analysis for 08th August 2025NSE:BANKNIFTY
Index has resistance near 55900 – 56000 range and if index crosses and sustains above this level then may reach near 56400– 56500 range.
Banknifty has immediate support near 55000 - 54900 range and if this support is broken then index may tank near 54500 - 54400 range.
Volatility expected due to further executive orders to be issued by the US President.

Finnifty Intraday Analysis for 08th August 2025NSE:CNXFINANCE
Index has resistance near 26600 - 26650 range and if index crosses and sustains above this level then may reach near 26800 - 26850 range.
Finnifty has immediate support near 26250 – 26200 range and if this support is broken then index may tank near 26050 – 26000 range.
Volatility expected due to further executive orders to be issued by the US President.

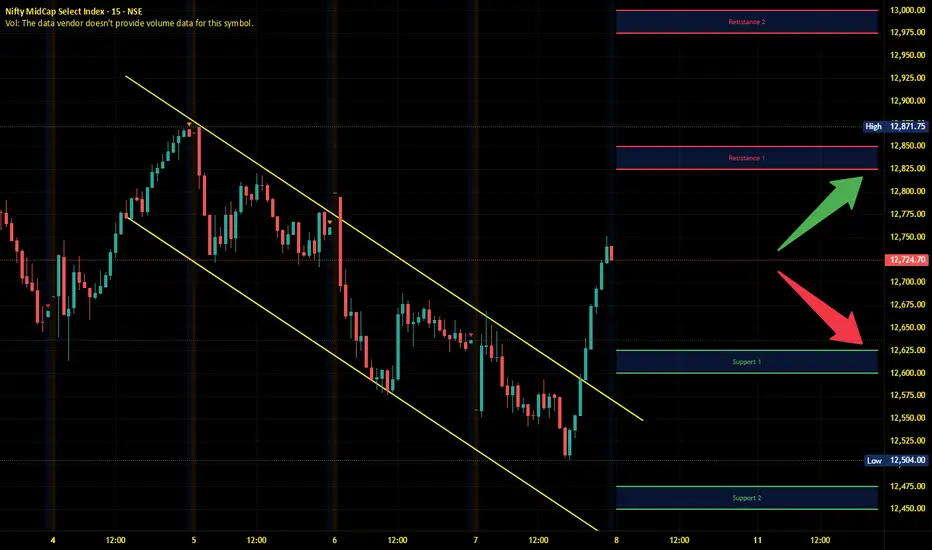
Midnifty Intraday Analysis for 08th August 2025NSE:NIFTY_MID_SELECT
Index has immediate resistance near 12825 – 12850 range and if index crosses and sustains above this level then may reach 12975– 13000 range.
Midnifty has immediate support near 12625 – 12600 range and if this support is broken then index may tank near 12475 – 12450 range.
Volatility expected due to further executive orders to be issued by the US President.
Link possible movement Link at its resistance area now if it break successfully then on the retest we can go for long if BTC holds or up from here
Scenario 2 if unable to break then we can short on the trend line break down

Live: XAUUSD - TP hit - 07/08/251.Support formed in 1 hr time frame
2. Weekly , Monthly , timeframes are Bullish
3. fakeout done during NY session in 1 hr
4. Took Entry during pulback
5. TP 1:1
Happy Trading.! ✨

Corrective Rise UpNifty seems to completed the formation of the corrective down pattern which was a Diametric formation.
From here we could expect an up move to take place, which will most likely be a corrective rise too.
The first warning that the downside it still in progress will be price entering the range of around 24290 and a break below the level of 23900 will confirm that this wave was just the starting of a larger correction
Happy Trading!!
Nifty Intraday Analysis for 07th August 2025NSE:NIFTY
Index has resistance near 24750 – 24800 range and if index crosses and sustains above this level then may reach near 24950 – 25000 range.
Nifty has immediate support near 24450 – 24400 range and if this support is broken then index may tank near 24250 – 24200 range.
Volatility expected due to probable tariff escalation from the US President on imports from India.
Banknifty Intraday Analysis for 07th August 2025NSE:BANKNIFTY
Index has resistance near 55800 – 55900 range and if index crosses and sustains above this level then may reach near 56400– 56500 range.
Banknifty has immediate support near 55000 - 54900 range and if this support is broken then index may tank near 54500 - 54400 range.
Volatility expected due to probable tariff escalation from the US President on imports from India.
Finnifty Intraday Analysis for 07th August 2025NSE:CNXFINANCE
Index has resistance near 26550 - 26600 range and if index crosses and sustains above this level then may reach near 26750 - 26800 range.
Finnifty has immediate support near 26200 – 26150 range and if this support is broken then index may tank near 26000 – 25950 range.
Volatility expected due to probable tariff escalation from the US President on imports from India.

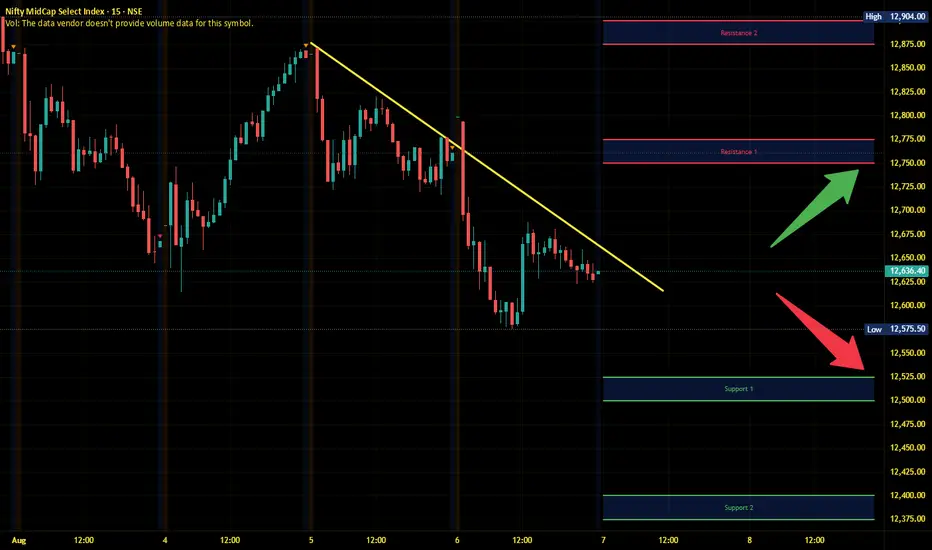
Midnifty Intraday Analysis for 07th August 2025NSE:NIFTY_MID_SELECT
Index has immediate resistance near 12750 – 12775 range and if index crosses and sustains above this level then may reach 12875– 12900 range.
Midnifty has immediate support near 12525 – 12500 range and if this support is broken then index may tank near 12400 – 12375 range.
Volatility expected due to probable tariff escalation from the US President on imports from India.
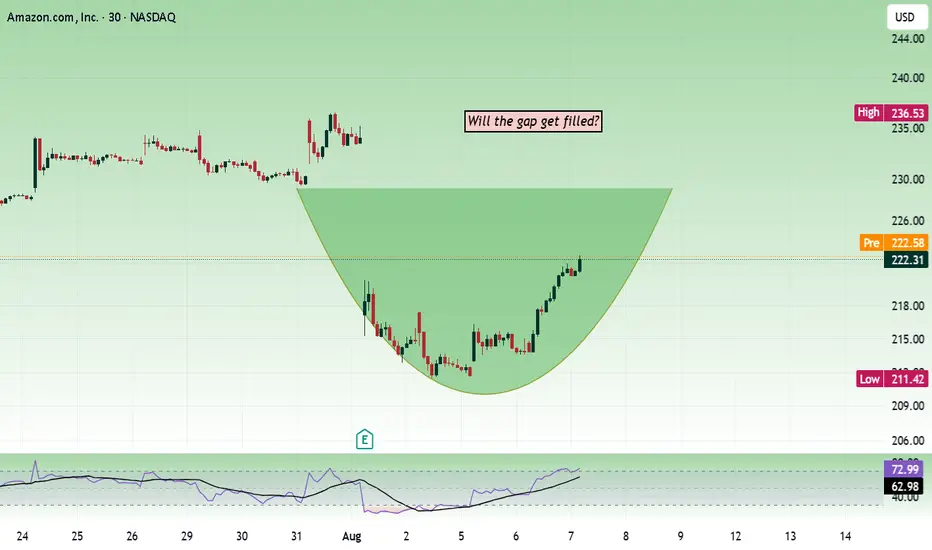
Amazon - Will the gap get filled?Price is sustaining an important level of 220. It can make the price move towards the 230 zone.
Below 220, the price will start to lose bullish strength. The next support is at 200–202, with 220 being a strong support.
Buy above 221.5 with the stop loss of 220 for the targets 223, 224.5, 227, and 228.5.
Always do your analysis before taking any trade.
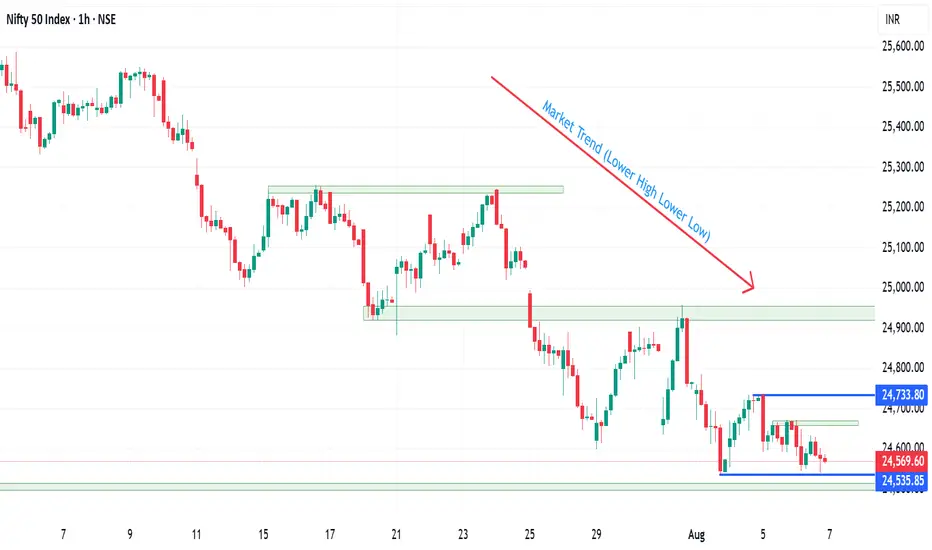
Nifty at important level - August 7Trump imposed an additional 25% tariffs on Indian goods, bringing the total to 50%. Will it affect market movement today? Nifty is sustaining above the 24500 zone so far. Will it break it? According to the daily chart, where is the support?
The support is in zone 24460 - 24480. If this level is also breached, we can expect the price to find support in the zone of 24360 -24380.
Now we will see how to trade using these levels.
If the price opens in the zone 24460 and shows bullish strength, then it can move towards 24600.
If there is no trend strength, then we can expect range volatile movement in the area 24360 to 24500. Please remember the price is in a bearish trend, and bears will try to make the price fall during every pullback towards 24600.

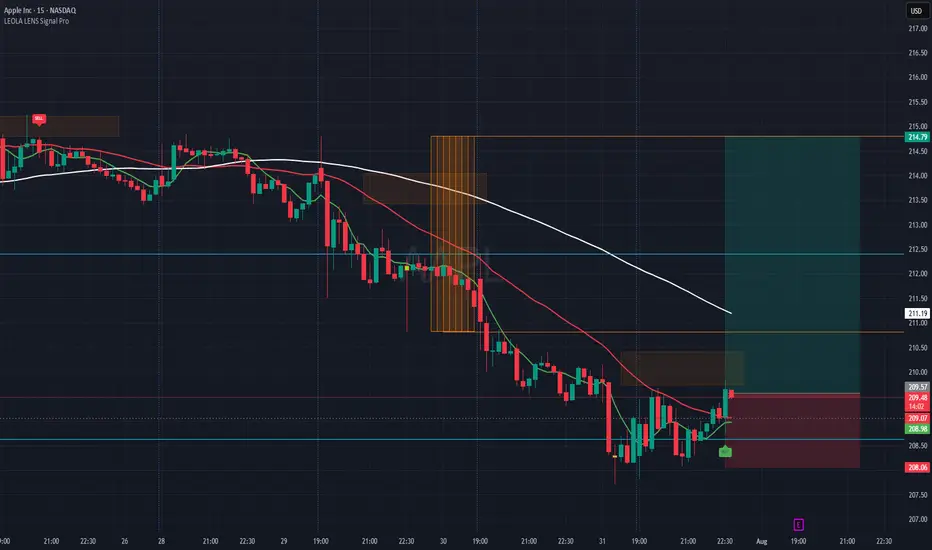
AAPL-Reaction Setup Lower Structure Zone-Eyes LongThis chart captures a structure-aware buy setup on Apple Inc. (AAPL), using Leola Lens SignalPro with momentum overlays and risk visualization.
What the Chart Shows:
🟢 A new BUY label appeared after price tapped a previously marked liquidity zone.
📉 Prior bearish momentum exhausted near 208.50–208.90 area — forming a potential base.
🟥 Overhead resistance is clearly defined, aligning with a recent rejection block and moving average confluence.
✅ A well-defined Risk:Reward setup is plotted — aiming for continuation toward 214.79, with risk below 208.06.
Key Levels to Monitor:
🔺 Break and hold above 210.50 could shift bias toward bullish continuation.
⚠️ Failure to hold above 209.00 could invalidate the current intraday structure.
This view is for educational purposes only — illustrating how price reacts around structure, liquidity, and confirmation signals.
Expecting a nice move on Nifty weekly expiry 07/08/2025.Nifty for the last three days is forming an inside candle, chances of it moving either side is high.
If the market starts trading below 24510, it may test the pervious support around 24230 and another levels below it.
On the higher side, trade can only be initiated only once 24650 levels are taken out.
In case of a gap down wait for the retest of the support zone that will act as the resistance now. Enter trade only once the setup triggers.
Major resistance levels :- 24660, 24733
Support levels :- 24500 (psycological level), 24228
Hourly Moving averages are above the closing price while the Daily 100 EMA is around the closing leves, which can act as the support else it can come to test the 200 EMA (24200).
Wait for the price action near the levels before entering the market.
ZUARI AGRO CHEMICALS LTD – Breakout Above Multi-Year Resistance ZUARI AGRO CHEMICALS LTD (NSE: ZUARI) has broken above a strong multi-year resistance level around ₹370 on the weekly chart, signaling a major bullish breakout. The price is currently trading at ₹363, with strong momentum and increased volume.
Key technical highlights:
• Fibonacci Retracement Levels: The chart references the key retracement levels from the previous high to low:
• 0.382 (₹293.70) – Surpassed, now acting as support.
• 0.5 (₹370.25) – Significant resistance zone, currently being tested.
• 0.618 (₹446.75)
• 0.786 (₹555.70)
• 0.886 (₹620.50)
• Volume Surge: A sharp increase in trading volume supports the bullish move.
• Channel Breakout: Price action has decisively broken above the rising channel, indicating strong bullish sentiment and the potential start of a new uptrend.
• Next Targets: On sustained move above ₹370, next Fibonacci resistance levels are ₹447 (0.618), ₹555 (0.786), and ₹621 (0.886).
Trade Bias:
Bullish momentum breakout above multi-year resistance, supported by volume and Fibonacci confluence. Next major upside targets: ₹447, ₹555, and ₹621. Keep an eye on ₹370 as make-or-break support.

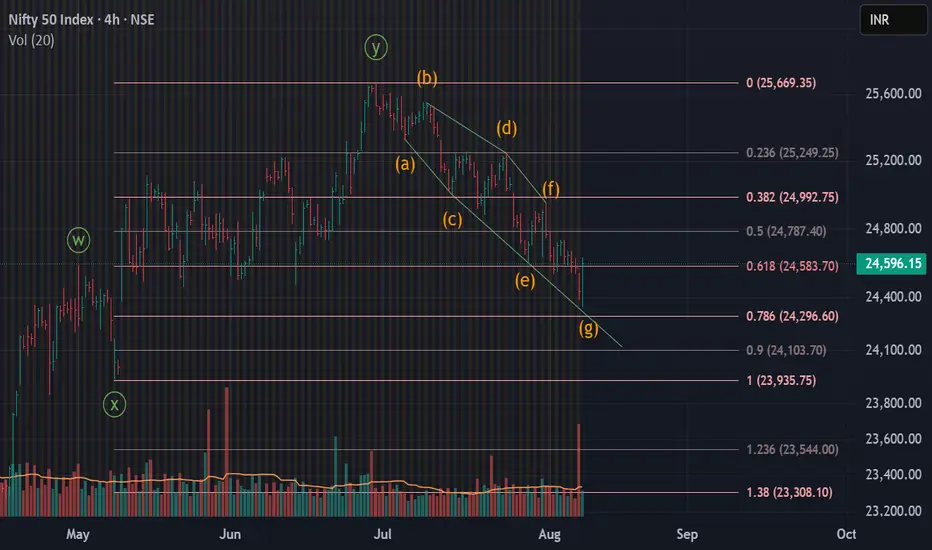
Nifty 50 – Future Trend Forecast with Key Zones (Aug–Nov 2025)This chart presents a forward-looking analysis of the Nifty 50 Index, highlighting expected movements and significant levels over the coming months.
• Current Market Position:
The Nifty 50 is trading at 24,574.20. Recent price action shows a pullback after touching the supply zone near 25,700 in late June 2025.
• Key Levels:
• Supply Zone: Marked between 25,700 and 26,000, where selling pressure is anticipated if price rallies.
• Support/Demand Zone: Strong support identified between 24,000 and 24,200. This zone has historically attracted buying interest, helping limit downside.
• Recent Correction:
The index corrected by roughly 1,530 points (or −5.95%) from its supply zone high, bottoming out around 24,197 by August .
• Future Outlook:
The yellow candles in the projection area represent a possible bullish recovery, returning toward the supply zone in subsequent weeks and months. If the index sustains above the demand/support zone, it is likely to test higher resistance zones, but may face selling upon re-approach.
• Trading Insight:
Watch for reversal signals near major support. A move above 25,000 could trigger further upside, while sustained trading below the green demand zone may invite deeper corrections.
Summary:
This analysis maps out high-probability reversal points and trend expectations, aiming to support traders’ strategic decision-making in the upcoming period. Always consider dynamic market conditions and use risk management protocols.

UltraTech Cement Rides Strong Bullish Channel, Eyes Breakout BeyTopic Statement:
UltraTech Cement continues its bullish run, driven by consistent growth and cement’s critical role in construction-led demand.
Key Points:
1. The stock moves strictly within a well-defined uptrending channel, making it highly suitable for channel-based trading
2. It rarely dips below the 200-day EMA, and prices near this level have historically presented strong investment opportunities
3. The price is currently facing resistance at the 12000 mark, but a weak breakout appears to be underway, signaling potential continuation

XAUUSD | Technical Analysis for 06/08/2025Hi,
A short upside move is expected till 3380. It is taking rejection from 0.75 level of last swing.
Disclaimer: This is only for educational purpose.
Thanks

Nifty Intraday Analysis for 06th August 2025NSE:NIFTY
Index has resistance near 24850 – 24900 range and if index crosses and sustains above this level then may reach near 25050 – 25100 range.
Nifty has immediate support near 24450 – 24400 range and if this support is broken then index may tank near 24250 – 24200 range.
