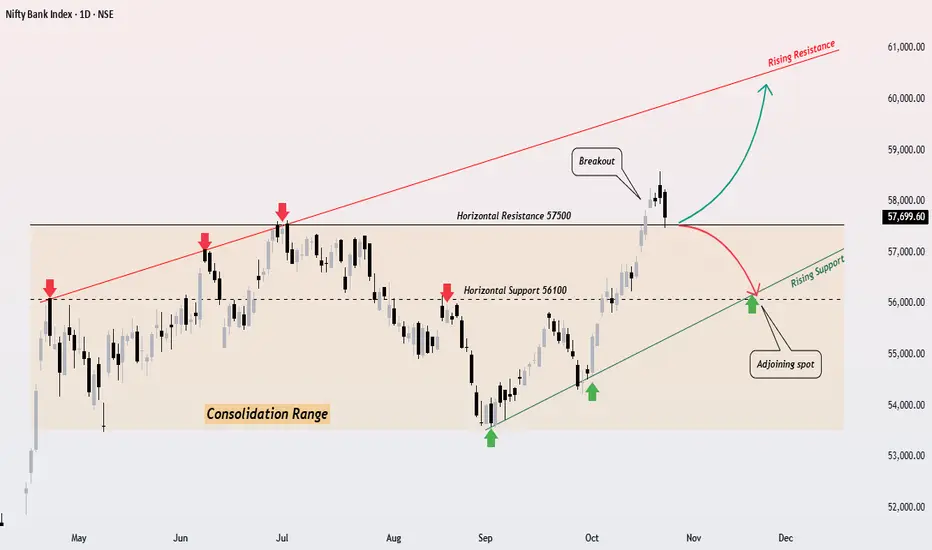
Nifty Bank Range to Rally What Next ?Hello traders! Hope you’re all doing great. It’s fascinating how price respects geometry the way horizontal structures merge with rising supports often reveals the market’s true rhythm, So let's explore it.
BANKNIFTY – The Range Breakout Story & What’s Next?
After spending months trapped between 53500–57500, Bank Nifty has finally broken above the consolidation range, hinting at a potential shift in momentum.
This zone acted like a strong horizontal cage every attempt to rise above 57500 had been rejected earlier. But this time, the breakout came with conviction. Now, the index seems to be retesting the breakout zone, a common and healthy behavior before a potential next leg up.
Technical Structure at a Glance--::
🧩Horizontal Resistance: 57500
🧩Horizontal Support: 56100
🧩Rising Support Trendline aligning perfectly near the retest zone
🧩Rising Resistance: pointing toward the 60000–60500 region
What the Chart Suggests ?
Bullish View:
If Bank Nifty respects the 57500-57000 zone (a confluence of old resistance + rising support), we might witness the next rally phase towards 60000+, aligning with the rising resistance trendline.
Bearish View:
A decisive close below 57500 will negate the bullish bias and can drag prices back toward the mid-range zone around 56100-55000.
Chart Reading Insight--::
A breakout followed by a controlled pullback is often the market’s way of “testing conviction.”
As long as structure and rising support hold the uptrend narrative remains intact.
Takeaway--::
The 57500–57000 band will decide the fate of this breakout
Hold above = continuation rally 🟢
Break below = structure reset 🔴
Have a nice week Ahead- Amit.
Support and Resistance
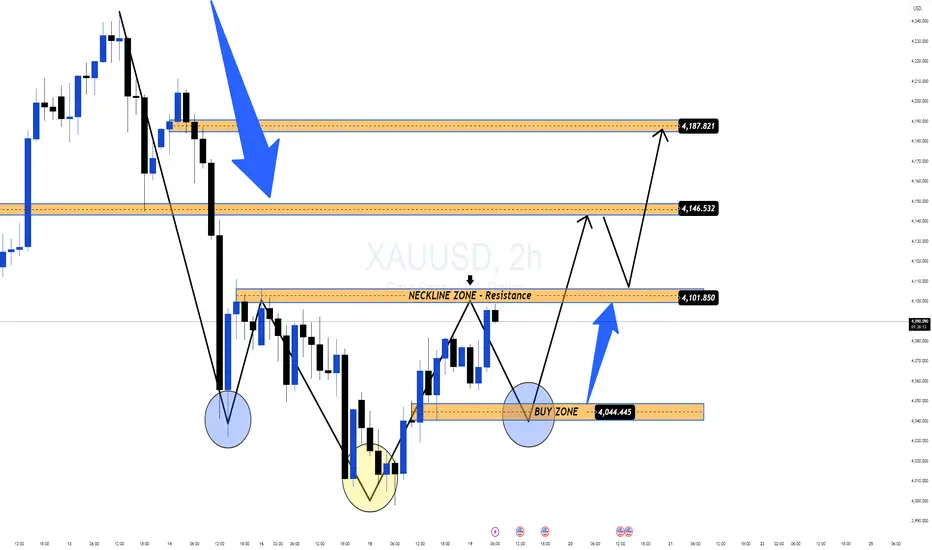
Gold Forms Inverted Head & Shoulders: Reversal Signal!After a short-term corrective decline, the $4,000 level has triggered strong BUY momentum, creating a clear price rebound at the end of yesterday's session. The increase in buying volume indicates that the BUY side is returning to the market after several sessions of being pushed down.
📊 Prominent Technical Structure
On the 2H chart, gold is completing the Inverted Head & Shoulders pattern – one of the strongest bullish reversal patterns.
• Head: liquidity bottom at 4,00x
• Two shoulders: forming symmetrically with good bounce
• Neckline: area 4,101–4,102, currently a key resistance
Price is likely to:
1️⃣ Slightly adjust to the neckline area or BUY ZONE 4,044–4,046
2️⃣ Retest – Accumulate – Confirm breakout
3️⃣ Break out towards 4,146 → 4,187 when the pattern is complete
🎯 Short-term Expectations
Volatility may increase ahead of upcoming economic data, so the reasonable strategy remains:
✅ Prioritize BUY according to the pattern
• Wait for retest of neckline or area 4,044–4,046
• Observe confirmation force (Volume – Momentum – Rejection)
• Target towards 4,146 → 4,187 if the pattern is activated
⚠️ Note
– The reversal trend is only truly confirmed when the price clearly breaks the 4,101–4,102 area.
– Market sentiment currently leans towards recovery, but clear signals are needed before entering large (long-term HOLD) positions.
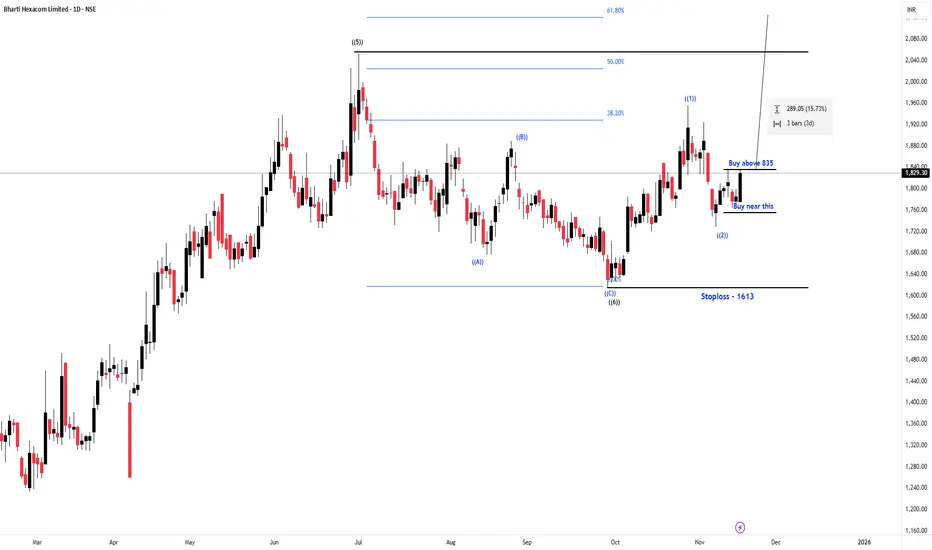
Bharti Hexacom Limited ( Neowave Trading Idea)Namaskaram
This is an swing trade, this is just to show you how our setup works,
will talk about setup in the tomorrow video.
About stock
Trend Cycle- 7th swing
Target just below the previous swing -2020
stoploss- 1614
stoploss will change to 1728 after friday if price goes above 835 and does not come back.
will update the trail sl.
This is an example how our furture setup will work, but still this is a tradable setup and counts is strong to take a swing trade.
It has no boundation of time limit.
if you have questions, you can ask me in the comments.
Thank You
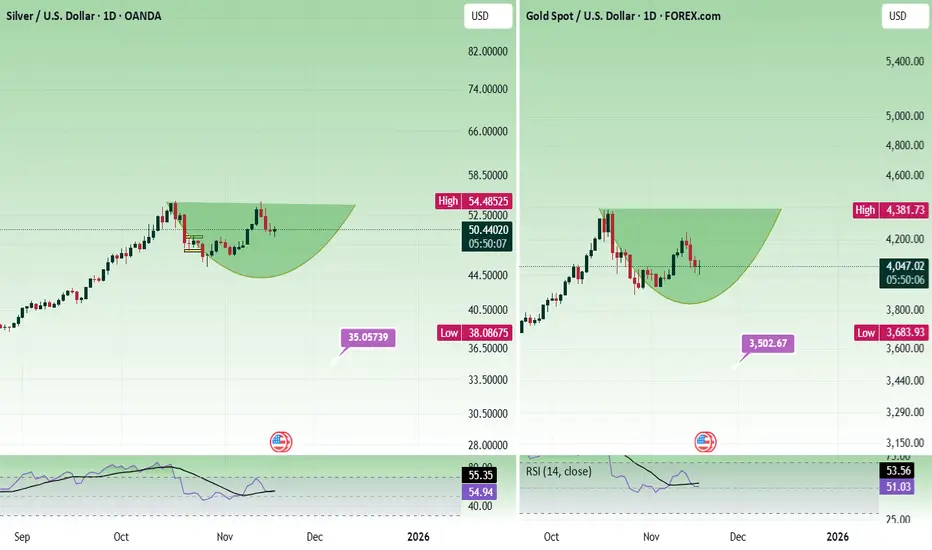
Trader's Queries - Gold & Silver - A reviewI rarely publish ideas about gold, and this is the first time I am writing about silver. This is not about where to buy or sell. Idea is about the structure of the price action.
Both gold and silver is forming a rounding bottom pattern. If it gives a breakout right away, then sustaining above these levels are crucial.
For gold, 4378 - 4382 and for silver, 55.45 - 55.55.
Rounding bottom low is at 3886 for gold, and even if there is a big fall, it should not go below 3876 - 3884 to be bullish.
For silver 44.50 - 45.50 should hold.
Since the price has given a strong trending movement already, give it some time to have a pullback, to find support, before taking any entry for investment.
We can expect silver to test 65 to 66 and gold to test 4700 - 4800 in 2 to 3 years.
Always do your analysis before taking any trade.
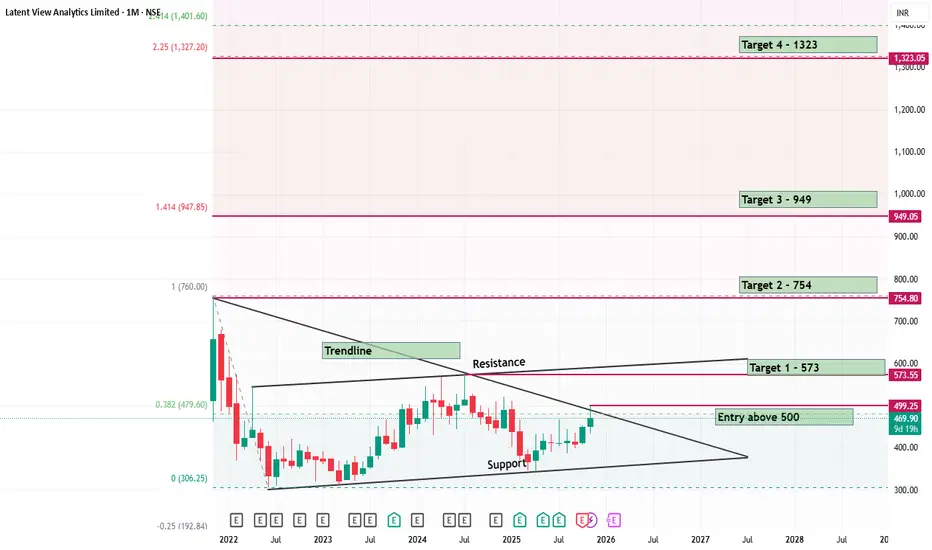
Latent View a Hidden Gem BUY with 2 Years Horizon
BUY LATENT VIEW
BUY ABOVE RS500 AND HOLD FOR 2 YEARS FOR A TARGET OF 1323.
Stock needs to break the upside resistance of Rs 573 with an entry on monthly close above 500.
It will rocket above 754 with is the the all time high.
Plotted the trendline for your understnading.
Below is the companies details. Great Share for Investors with a long time view.
The Company is a global digital analytics firm that inspires and transforms businesses to excel in the digital world by harnessing the power of data and analytics. The Company provides a 360-degree view of the digital consumer, enabling companies to predict new revenue streams, anticipate product trends and popularity, improve customer retention rates and optimize investment decisions. It is a trusted partner to enterprises worldwide, including over 30 Fortune 500 companies in the Retail, CPG, Financial, Technology and Healthcare sectors and has 860 employees in offices in Princeton, N.J., San Jose, California, London, Singapore, and Chennai, India.
The Company launched GenAI solution in FY23. It acquired Decision Point, by making a strategic move to enhance its capabilities in revenue growth management, in the Consumer-Packaged Goods Division (CPG) in 2024.
Nifty Intraday Analysis for 18th November 2025NSE:NIFTY
Index has resistance near 26150 – 26200 range and if index crosses and sustains above this level then may reach near 26350 – 26400 range.
Nifty has immediate support near 25850 – 25800 range and if this support is broken then index may tank near 25650 – 25600 range.

Banknifty Intraday Analysis for 18th November 2025NSE:BANKNIFTY
Index has resistance near 59400 – 59500 range and if index crosses and sustains above this level then may reach near 59900 – 60000 range.
Banknifty has immediate support near 58600 - 58500 range and if this support is broken then index may tank near 58100 - 58000 range.

Finnifty Intraday Analysis for 18th November 2025 NSE:CNXFINANCE
Index has resistance near 27800 - 27850 range and if index crosses and sustains above this level then may reach near 28000 - 28050 range.
Finnifty has immediate support near 27450 – 27400 range and if this support is broken then index may tank near 27250 – 27200 range.

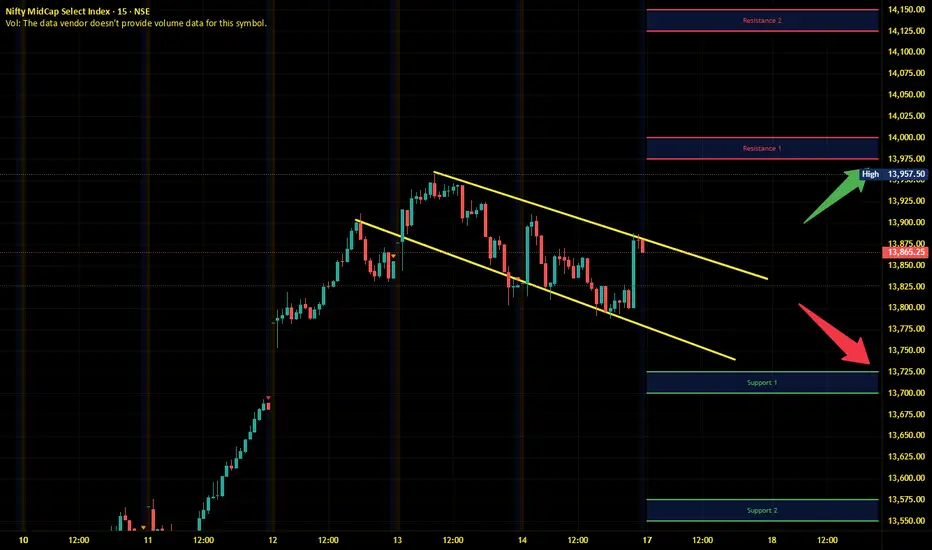
Midnifty Intraday Analysis for 18th November 2025NSE:NIFTY_MID_SELECT
Index has immediate resistance near 14125 – 14150 range and if index crosses and sustains above this level then may reach 14275 – 14300 range.
Midnifty has immediate support near 13875 – 13850 range and if this support is broken then index may tank near 13725 – 13700 range.

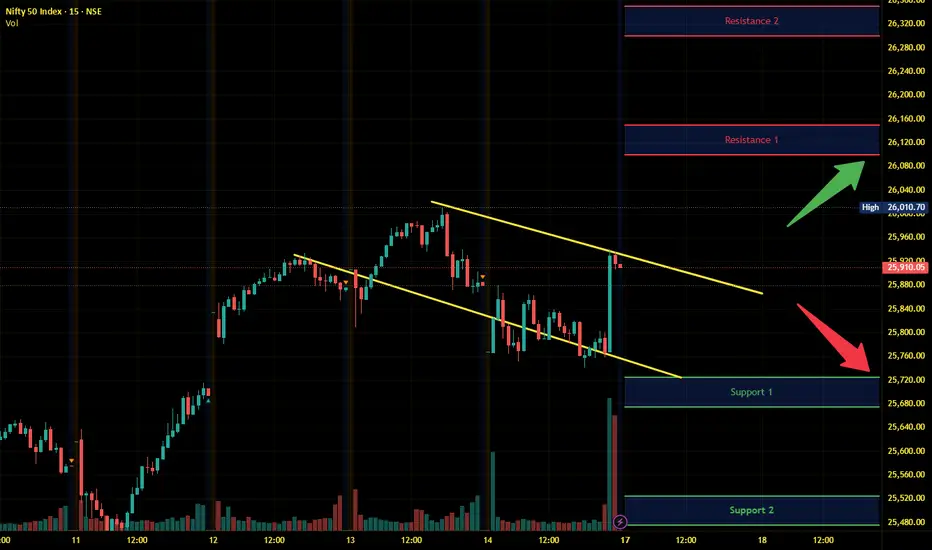
Nifty Breaks Key Support at 25920 — Bears Take the Wheel!Nifty has decisively broken below the crucial support zone at 25920, and price is currently holding under this level—an early sign that bearish momentum may continue. As long as 25975 remains unbroken on the upside, the short-term bias stays negative.
A potential short opportunity may emerge on retests or continued rejection below 25920, with price targets at:
TP1: 25850
TP2: 25800
This setup remains valid unless Nifty reclaims and sustains above 25975.
📌 Disclaimer:
This analysis is for educational purposes only and is not financial advice. Always manage risk and follow your trading plan.
Your feedback drives our content and keeps everyone trading smarter. Let’s make those pips together! 🚀
Happy Trading,
– The InvestPro Team

Bank Nifty Weekly Outlook (17th Nov – 21st Nov 2025)The Nifty Bank Index last week ended at 58,517.55, posting a healthy +1.11% gain. The index continued its upward momentum and is now trading near a crucial supply zone, indicating that the market is at an important decision point for the coming week.
🔹 Key Levels for the Upcoming Week
📌 Price Action Pivot Zone (58,398 to 58,639)
This blue-shaded zone marks the key decision area. Sustaining above 58,639 may invite strong buying interest, while rejection from this zone could lead to mild profit booking.
🔻 Support Levels:
S1: 58,036
S2: 56,919
S3: 57,037
🔺 Resistance Levels:
R1: 59,004
R2: 59,490
R3: 59,893
📈 Market Outlook
✅ Bullish Scenario:
If Bank Nifty sustains above the Pivot Zone (58,639), the index may move toward R1 (59,004). A strong breakout above this level could extend the rally toward R2 (59,490) and eventually R3 (59,893).
❌ Bearish Scenario:
If the index falls below 58,398, short-term weakness may drag it toward S1 (58,036), followed by S2 (56,919) and S3 (57,037). A weekly close below 56,900 could indicate the beginning of a deeper corrective phase.
Disclaimer: aliceblueonline.com

Leela Palaces Hotels & Resorts Ltd – Inverted Head & ShouldersLeela Palaces has formed a clean Inverted Head & Shoulders pattern on the 75-minute timeframe, signalling a potential trend reversal after weeks of sideways movement.
Price has now broken above the neckline zone (~₹443–₹445) with a strong bullish candle, supported by improving volume — indicating buyers stepping back in.
A sustained move above the neckline could push the stock toward the measured target near ₹473–₹475, which aligns with previous swing supply.
🎯 Key Levels
CMP: ₹445.60 (+1.76%)
Neckline Zone: ₹443 – ₹445
Pattern Target: ₹472 – ₹475
Support Zone: ₹430 – ₹433
Stop-Loss: Below ₹430 (75-min close basis)
📈 Technical View
Clear Inverted H&S structure with shoulders at ₹428 & ₹435, and head at ~₹420.
EMA alignment turning positive (bullish slope developing).
Breakout candle above neckline confirms strength.
Volume improving during the breakout → added confirmation.
Immediate resistance now becomes support; a retest of ₹443–₹445 may offer opportunities.
🧠 View
Leela Palaces is breaking out of a well-formed Inverted Head & Shoulders pattern. If the price holds above the neckline, the stock may move towards the ₹473–₹475 zone. Watch for retest entries and volume continuation.

BTCEarlier I shared potential buy but it hit sl no worries I went against the trend so it's always a risk. Anyways found this beautiful breakout and entered sniper entry

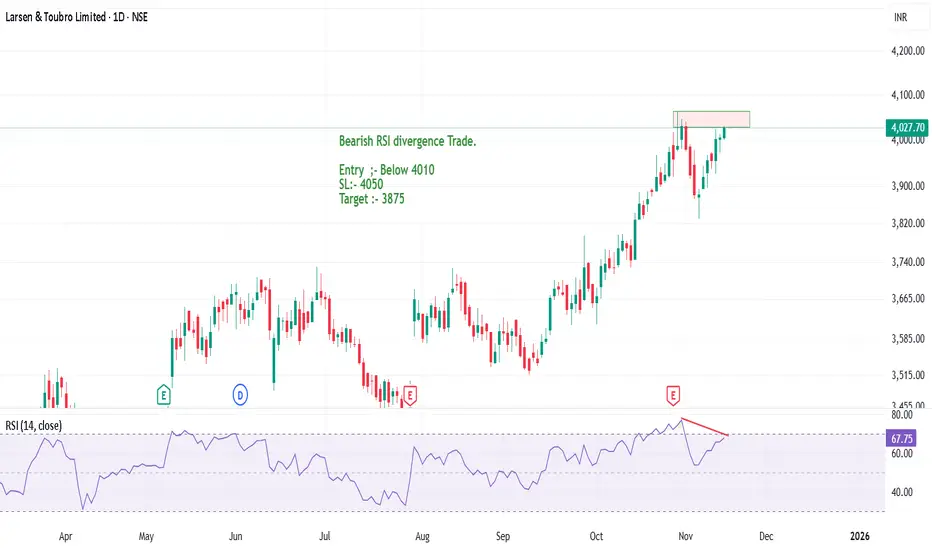
L&T forming a new high or Double Top pattern?Larsen & Toubro is showing a strong bearish RSI divergence on the daily charts. There can be an opportunity to sell the stock in coming trading sessions.
The stock has performed fabulously and good returns has been yeilded by the stock.
If there is a bearish price action, a double top pattern confirmation, good R:R trade can be capture in the stock.
Entry :- Below today's low (4000)
Stop Loss :- 4055
Target :- 3875
A swing trade can be initated in the stock with Target 1 as 3875 and trailing SL for next target upto 3780.
Target 2 can also be made with the help of the 50 EMA.
In case price tries to form a new high is can be shorted only when there is some negative sentiment and price action in the stock.
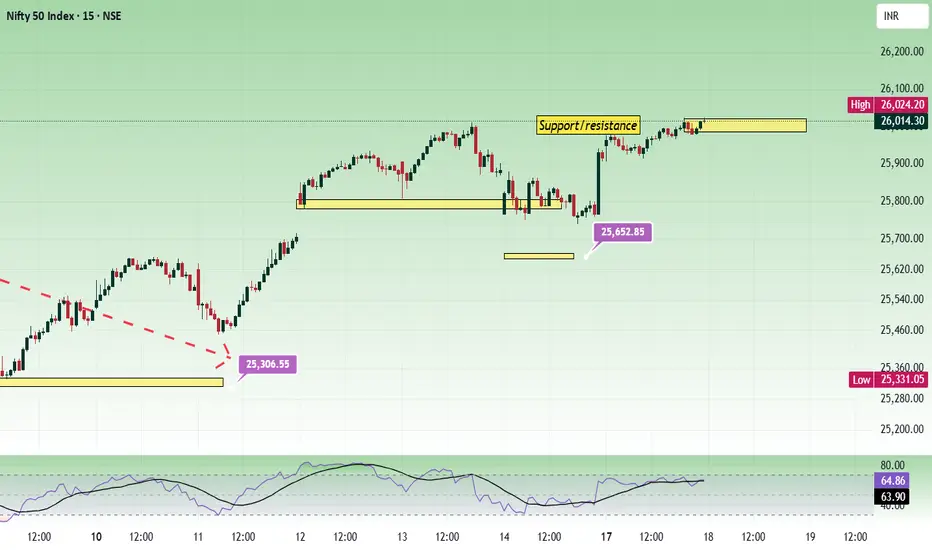
Nifty - Expiry day analysis Nov 18The price was bullish, but the movement was slow today as it was nearing the psychological zone of 26k. And we can see a small consolidation around this area, double top resistance. Sustaining above 26020 is important for further moves.
Buy above 26020 with the stop loss of 25960 for the targets 26060, 26100, 26160 and 26200.
Sell below 25860 with the stop loss of 25910 for the targets 25820, 25780, 25720, 25680 and 25640.
The expected expiry day range is 25800 to 26200.
Always do your analysis before taking any trade.
Nifty Intraday Analysis for 17th November 2025NSE:NIFTY
Index has resistance near 26100 – 26150 range and if index crosses and sustains above this level then may reach near 26300 – 26350 range.
Nifty has immediate support near 25725 – 25675 range and if this support is broken then index may tank near 25525 – 25475 range.
Banknifty Intraday Analysis for 17th November 2025NSE:BANKNIFTY
Index has resistance near 58900 – 59000 range and if index crosses and sustains above this level then may reach near 59400 – 59500 range.
Banknifty has immediate support near 58100 - 58000 range and if this support is broken then index may tank near 57600 - 57500 range.

Finnifty Intraday Analysis for 17th November 2025 NSE:CNXFINANCE
Index has resistance near 27700 - 27750 range and if index crosses and sustains above this level then may reach near 27950 - 28000 range.
Finnifty has immediate support near 27300 – 27250 range and if this support is broken then index may tank near 27050 – 27000 range.

Midnifty Intraday Analysis for 17th November 2025NSE:NIFTY_MID_SELECT
Index has immediate resistance near 13975 – 14000 range and if index crosses and sustains above this level then may reach 14125 – 14150 range.
Midnifty has immediate support near 13725 – 13700 range and if this support is broken then index may tank near 13575 – 13550 range.
PAYTM (NEOWAVE Analysis)Namaskaram Everyone
I have made a video on paytm, kindly watch that to understand my view.
If you want to know about your stock than feel free to ask me in comment.
Thanks.
PAYTM Video Analysis

Nifty 50 Weekly Outlook ( 17th Nov – 21st Nov 2025)The Nifty 50 Index last week ended at 25,910.05, posting a +1.64% gain. The index bounced strongly from lower levels and is now trading near a key supply zone, indicating that the market may see either continuation or consolidation depending on how price reacts to this region.
🔹 Key Levels for the Upcoming Week
📌 Price Action Pivot Zone (25830 to 25991)
This blue-shaded zone represents the crucial decision area. Sustaining above 25,991 may attract strong buying interest, while rejection from this zone could lead to short-term profit booking.
🔻 Support Levels:
S1: 25,590
S2: 25,270
S3: 24,895
🔺 Resistance Levels:
R1: 26,234
R2: 26,558
R3: 27,027
📈 Market Outlook
✅ Bullish Scenario:
If Nifty holds above the Pivot Zone (25830–25991), bullish momentum could push the index toward R1 (26,234). A strong breakout above this may extend the rally toward R2 (26,558) and eventually R3 (27,027).
❌ Bearish Scenario:
If the index fails to sustain above 25,830, short-term weakness may emerge, dragging Nifty toward S1 (25,590). Further breakdowns could open doors to S2 (25,270) and S3 (24,895). A weekly close below 24,900 may signal a deeper correction.
Disclaimer: aliceblueonline.com

PAYTM | Neowave AnalysisHi everyone
This is an neowave analysis as you asked about paytm in comment so here it is.
If you have more query or anyone else wants to know my view on particular stock, than simply leave a comment, i will be happy to help.
Thank You

XAU/USD – Rebalancing Structure, Support Zone Holding Steady⏰ Timeframe: 30m
📅 Update: 17/11/2025
🔍 Market Context
After the extended decline late last week, gold is gradually stabilizing around the 4,050–4,080 USD zone, showing a positive reaction at the structural support zone.
The recent Break of Structure (BOS) sequence indicates that the selling momentum is gradually weakening, while the newly formed Order Block is acting as a temporary balance for the market.
The current structure slightly leans towards a technical recovery, as buying flows are returning around the main support zone.
📊 Technical Structure
Support Zone (4,049–4,080 USD): a critical support zone, confluencing with the previous liquidity bottom.
Order Block (4,096–4,115 USD): a short-term supply-demand area, potentially a retest point before the price expands higher.
Resistance Zone (4,145 USD): the first intermediate level to overcome to confirm upward momentum.
Target Zone (4,210 USD): the upper liquidity zone, corresponding to the potential expansion mark of the recovery wave.
🎯 Market Outlook
Priority scenario for the day:
1️⃣ Gold may retest the Order Block zone 4,096–4,115 USD before forming the first push up to 4,145 USD.
2️⃣ If buying pressure is maintained and this resistance zone is broken, the expansion momentum may head towards 4,210 USD, corresponding to a higher liquidity zone.
3️⃣ Losing the 4,049 USD mark will invalidate the recovery structure and bring the market back to a lower balance zone.
🧠 Analyst’s View
The market is currently in a reaccumulation phase after a strong correction.
Buyers still maintain a technical advantage as long as the price remains above the 4,049 USD support zone.
Observing price behavior around the Order Block and the 4,145 USD zone will be key signals to confirm the strength of this recovery wave.
🛡️ Risk Note
The current phase is a “pullback phase” within the larger structure.
Traders should wait for clear price behavior confirmation at technical zones rather than predicting movements in advance.
