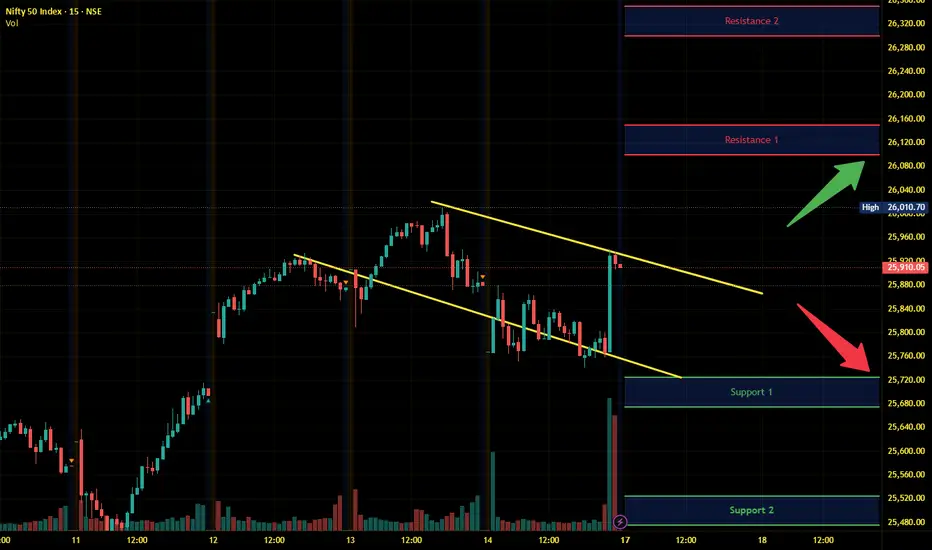
Nifty Intraday Analysis for 17th November 2025NSE:NIFTY
Index has resistance near 26100 – 26150 range and if index crosses and sustains above this level then may reach near 26300 – 26350 range.
Nifty has immediate support near 25725 – 25675 range and if this support is broken then index may tank near 25525 – 25475 range.
Support and Resistance
Banknifty Intraday Analysis for 17th November 2025NSE:BANKNIFTY
Index has resistance near 58900 – 59000 range and if index crosses and sustains above this level then may reach near 59400 – 59500 range.
Banknifty has immediate support near 58100 - 58000 range and if this support is broken then index may tank near 57600 - 57500 range.

Finnifty Intraday Analysis for 17th November 2025 NSE:CNXFINANCE
Index has resistance near 27700 - 27750 range and if index crosses and sustains above this level then may reach near 27950 - 28000 range.
Finnifty has immediate support near 27300 – 27250 range and if this support is broken then index may tank near 27050 – 27000 range.

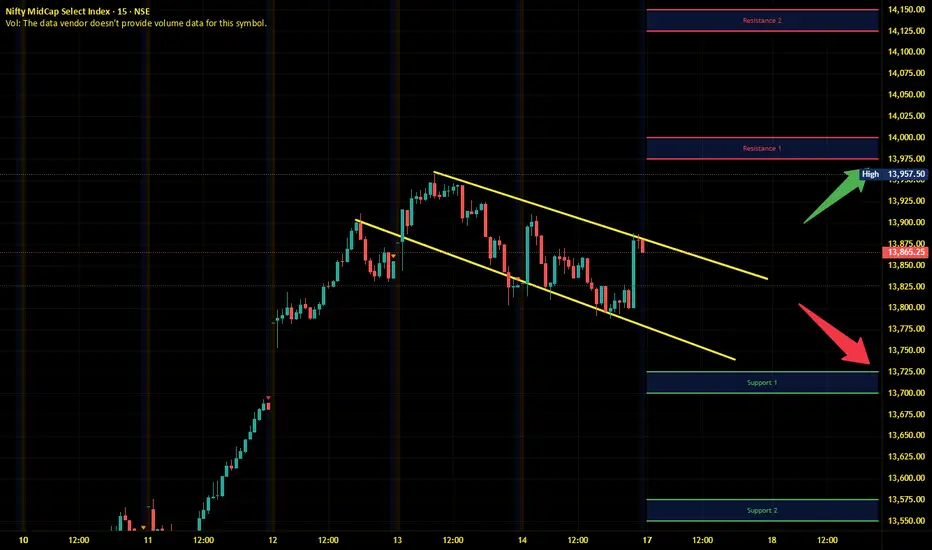
Midnifty Intraday Analysis for 17th November 2025NSE:NIFTY_MID_SELECT
Index has immediate resistance near 13975 – 14000 range and if index crosses and sustains above this level then may reach 14125 – 14150 range.
Midnifty has immediate support near 13725 – 13700 range and if this support is broken then index may tank near 13575 – 13550 range.
PAYTM (NEOWAVE Analysis)Namaskaram Everyone
I have made a video on paytm, kindly watch that to understand my view.
If you want to know about your stock than feel free to ask me in comment.
Thanks.
PAYTM Video Analysis

Nifty 50 Weekly Outlook ( 17th Nov – 21st Nov 2025)The Nifty 50 Index last week ended at 25,910.05, posting a +1.64% gain. The index bounced strongly from lower levels and is now trading near a key supply zone, indicating that the market may see either continuation or consolidation depending on how price reacts to this region.
🔹 Key Levels for the Upcoming Week
📌 Price Action Pivot Zone (25830 to 25991)
This blue-shaded zone represents the crucial decision area. Sustaining above 25,991 may attract strong buying interest, while rejection from this zone could lead to short-term profit booking.
🔻 Support Levels:
S1: 25,590
S2: 25,270
S3: 24,895
🔺 Resistance Levels:
R1: 26,234
R2: 26,558
R3: 27,027
📈 Market Outlook
✅ Bullish Scenario:
If Nifty holds above the Pivot Zone (25830–25991), bullish momentum could push the index toward R1 (26,234). A strong breakout above this may extend the rally toward R2 (26,558) and eventually R3 (27,027).
❌ Bearish Scenario:
If the index fails to sustain above 25,830, short-term weakness may emerge, dragging Nifty toward S1 (25,590). Further breakdowns could open doors to S2 (25,270) and S3 (24,895). A weekly close below 24,900 may signal a deeper correction.
Disclaimer: aliceblueonline.com

PAYTM | Neowave AnalysisHi everyone
This is an neowave analysis as you asked about paytm in comment so here it is.
If you have more query or anyone else wants to know my view on particular stock, than simply leave a comment, i will be happy to help.
Thank You

XAU/USD – Rebalancing Structure, Support Zone Holding Steady⏰ Timeframe: 30m
📅 Update: 17/11/2025
🔍 Market Context
After the extended decline late last week, gold is gradually stabilizing around the 4,050–4,080 USD zone, showing a positive reaction at the structural support zone.
The recent Break of Structure (BOS) sequence indicates that the selling momentum is gradually weakening, while the newly formed Order Block is acting as a temporary balance for the market.
The current structure slightly leans towards a technical recovery, as buying flows are returning around the main support zone.
📊 Technical Structure
Support Zone (4,049–4,080 USD): a critical support zone, confluencing with the previous liquidity bottom.
Order Block (4,096–4,115 USD): a short-term supply-demand area, potentially a retest point before the price expands higher.
Resistance Zone (4,145 USD): the first intermediate level to overcome to confirm upward momentum.
Target Zone (4,210 USD): the upper liquidity zone, corresponding to the potential expansion mark of the recovery wave.
🎯 Market Outlook
Priority scenario for the day:
1️⃣ Gold may retest the Order Block zone 4,096–4,115 USD before forming the first push up to 4,145 USD.
2️⃣ If buying pressure is maintained and this resistance zone is broken, the expansion momentum may head towards 4,210 USD, corresponding to a higher liquidity zone.
3️⃣ Losing the 4,049 USD mark will invalidate the recovery structure and bring the market back to a lower balance zone.
🧠 Analyst’s View
The market is currently in a reaccumulation phase after a strong correction.
Buyers still maintain a technical advantage as long as the price remains above the 4,049 USD support zone.
Observing price behavior around the Order Block and the 4,145 USD zone will be key signals to confirm the strength of this recovery wave.
🛡️ Risk Note
The current phase is a “pullback phase” within the larger structure.
Traders should wait for clear price behavior confirmation at technical zones rather than predicting movements in advance.

BTCI found this good consolidation and chart pattern for a buy side opportunity please checkout and see if this worls for you guys
Gold Technical Rebound to FVG, Prioritise WATCHING FOR SELL at 4📊 Market Structure
Gold has completed a strong decline from the peak of 4.21x, leaving consecutive Break of Structure (BoS), confirming a short-term bearish structure.
The drop through the Breakout zone of 4.10x indicates a dominant selling force.
Currently, the price is bouncing from the Premium Zone 4.05x, aligning with the technical rebound behaviour after a strong sell-off.
The BUY side is merely pulling the price back to the abandoned liquidity zones (FVG 4.12x – 4.15x) before the SELL side can regain control.
The upper FVG zone is where the price often returns to fill after a steep fall. This is also the confluence zone between:
FVG (Fair Value Gap)
Old candle body Breaker
Fibonacci Premium
→ The risk of selling at these zones is very high.
💎 Key Technical Zones
Rebound zone for Sell
FVG 1: 4.101 – 4.126
FVG 2 (Strong Confluence): 4.126 – 4.150
Support zone – target to hit
Premium Zone $$$: 4.050 – 4.052
Lower FVG: 4.030 – 4.035
High probability price scenario: Rebound to FVG → reaction → continue to decline to 4.03x.
🎯 Trading Plan – Prioritise SELL
1️⃣ SELL Setup – High Probability
Wait for price to rebound to the above FVG zones:
Entry SELL:
4.118 – 4.126
Can add orders at higher: 4.140 – 4.150
Stop-loss: above 4.158
TP1: 4.101
TP2: 4.050
TP3: 4.030
✔️ This is a trend-following setup, selling at premium, adhering to SMC principles.
✔️ The current price is just beginning the rebound, not yet meeting BUY conditions.
2️⃣ BUY Setup – Only activate on deep Discount
Entry BUY: 4.030 – 4.035 (Lower FVG)
SL: below 4.020
TP: 4.070 – 4.100
→ BUY is only for counter-trend traders and must wait for a clear discount.
🧠 Vincent’s View
The market is in a distribution – decline phase, every rebound aims to pull liquidity.
As long as the price does not close above 4.150, SELL remains the optimal strategy for the day.
Observe closely when the price hits 4.12x – 4.15x, this is a “high-risk” zone for the BUY side and a “great opportunity” for the SELL side.
“Sell where the liquidity lives — that’s where institutions strike.” ⚜️
⏰ Timeframe: 1H
📅 Update: 17/11/2025
✍️ Analysis by: Captain Vincent

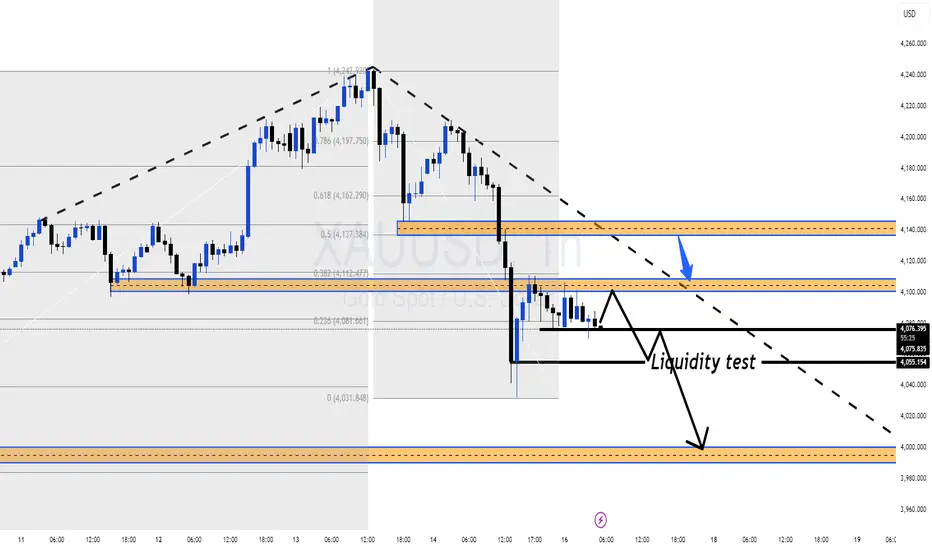
Gold Still in Distribution, FOCUS ON SELL Setups at 4,10x–4,14x 🔍 Market Context
Risk sentiment remains fragile as investors reassess the global rate and stimulus story.
Goldman Sachs notes that rising worries about the size of Japan’s fiscal stimulus are bringing financial risk premia back, putting pressure on long-term JGBs and the JPY. Capital tends to rotate into USD and yield-bearing assets in this environment, which limits the upside for gold in the short term.
📊 XAU/USD Technical Structure (H1)
After topping around 4,242 USD, gold broke its short-term uptrend and is now moving in a descending structure.
Price is currently capped below the 0.5–0.382 Fibonacci area around 4,11x, which overlaps with a strong supply / Sell Liquidity zone on the chart.
Below price, we have a series of liquidity / support pockets:
4,098 – 4,077 – 4,048 USD: short-term downside liquidity levels.
OBS BUY ZONE around 4,00x: major demand zone where price previously launched a strong rally.
Current price action shows sellers still in control – every bounce into 4,10x–4,14x is being rejected quickly, which fits a “sell the rally” approach.
🎯 Trend-Following Trade Ideas (for reference)
Zones below are technical areas to watch, not signals or financial advice.
Scenario 1 – Shallow Pullback Sell
Sell Zone 1: 4,102 – 4,104
SL: 4,110
TP levels:
TP1: 4,098
TP2: 4,077
TP3: 4,048
Idea: Price makes a minor intraday pullback into local supply, then resumes selling pressure toward lower liquidity pockets.
Scenario 2 – Deeper Pullback into Fib/Trendline Confluence
Sell Zone 2: 4,142 – 4,144
(confluence of descending trendline + Fibonacci combo)
SL: 4,150
TP levels:
TP1: 4,133
TP2: 4,105
TP3: 4,088
TP4: 4,060
Idea: If the market grabs more upside liquidity first, the 4,14x zone offers a better R:R area to align with the H1 downtrend.
⚜️ MMFLOW TRADING View
As long as price stays below 4,14x and H1 structure keeps printing lower highs, gold remains in a distribution phase.
Pullbacks into the 4,10x–4,14x liquidity band are treated as opportunities to optimize SELL entries, while the 4,00x OBS BUY ZONE is the key area to reassess any potential larger bottoming process.
“In a downtrend, our job isn’t to call the bottom – it’s to use every weak bounce to sell from a better position.”
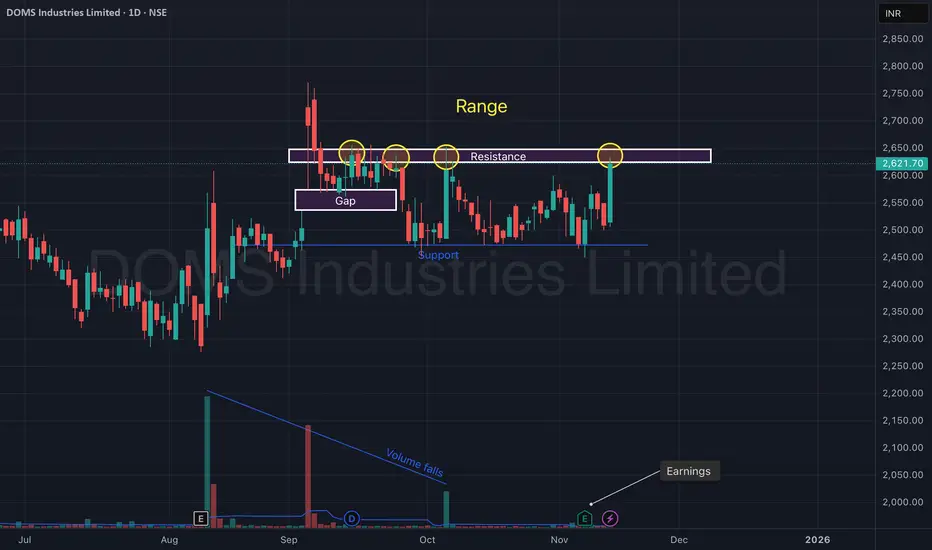
DOMS Industries Ltd – Range Breakout Attempt After Earnings.DOMS Industries continues to trade inside a well-defined range structure, with price repeatedly rejecting the ₹2,630–₹2,660 resistance zone. The recent strong bullish candle toward the upper boundary, combined with improving sentiment after earnings, signals a potential breakout attempt.
A clear gap zone retest around ₹2,520–₹2,550 provided a solid base. Support at ₹2,450 has held cleanly multiple times, validating the lower boundary of the range.
With volume slowly recovering from its multi-week decline and price pressing into resistance again, DOMS is approaching a decisive move.
🎯 Key Technical Levels
CMP: ₹2,621.70 (+4.49%)
Resistance Zone: ₹2,630 – ₹2,660 (Range high)
Gap Support: ₹2,520 – ₹2,550
Major Support: ₹2,450
Breakout Levels to Watch: Close above ₹2,660 with strong volume
📈 Technical View
Price is respecting a horizontal range for several weeks.
Repeated rejections highlighted by circles show strong supply near ₹2,650.
Gap zone acted as demand, helping price bounce back toward resistance.
Volume trend has been falling, suggesting participation has been subdued — a pickup in volume during any breakout would be critical.
Structure stays bullish above ₹2,520; bearish only if price closes below ₹2,450.
📊 Latest Earnings Snapshot
DOMS continues to deliver strong quarterly performance, supporting the technical setup:
Q2 FY26 (Sep 2025):
Net Profit: ~₹55.8 Cr
YoY Profit Growth: ~16%
Q1 FY26:
Revenue: ₹508.7 Cr (↑ ~26% YoY)
PAT: ~₹59.1 Cr (↑ ~8.8% YoY)
Consistent earnings growth strengthens the medium-term outlook and boosts confidence in a potential range breakout.
🧠 View
DOMS is back at its major resistance zone after a clean bounce from the gap support. A strong-volume breakout above ₹2,660 can trigger a momentum extension toward fresh highs, while ₹2,520 and ₹2,450 remain key demand zones to watch.
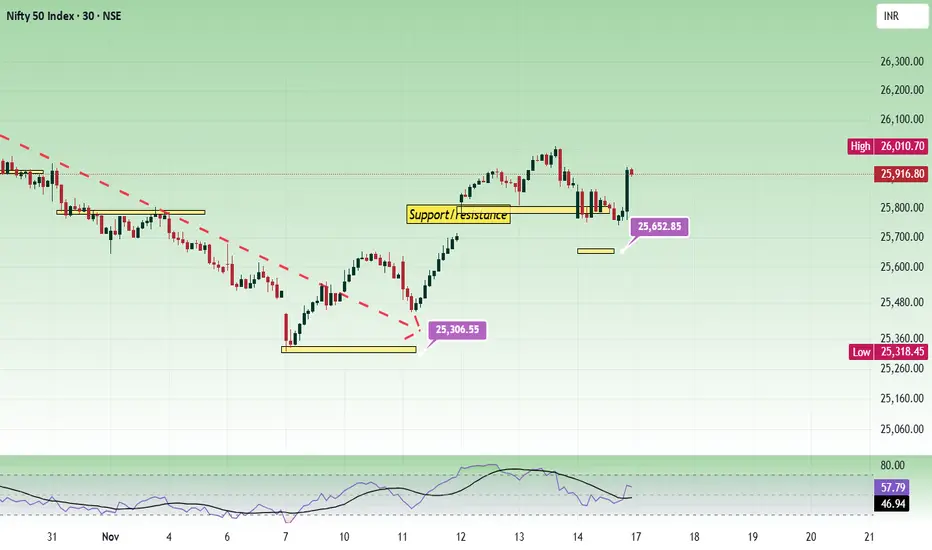
Nifty - Weekly review Nov 17 to Nov 21Price has formed a range between 25750 to 25950. The price is bullish as long as it sustains above 25700. No other pattern is seen in the chart.
Buy above 25920 with the stop loss of 25850 for the targets 25960, 26000, 26060, 26120, 26160, 26200 and 26240.
Sell below 25650 with the stop loss of 25720 for the targets 25610, 25560, 25520, 25460, 25420 and 25380.
If the price faces strong resistance at 26000 - 26100, then it may pull back towards 25700.
How the price reacts at important support/resistance will decide the trend direction.
So far Bank Nifty is supporting Nifty's move.
Always do your analysis before taking any trade.
Gold (Neowave Trading Idea)Hello everyone
# Gold is started walking again in daily charts and its going or atleast try for the time being to break its all time again.
## Stoploss will be 3964 if breaks dont sell just exit.
Thanks

Money moves the market - Bank NiftyTraders say price moves the market. Bulls or bears move the market etc... But the fact is, money moves the market. You cannot ignore Bank Nifty when analyzing Nifty. When bank sector is supporting, Nifty gives a trending move.
Public sector bank stocks are on the move, while private sector bank stocks are not.
We can see that Bank Nifty was facing resistance around the 57500 zone for a long time, and now it is sustaining above it.
The rounding bottom pattern looks promising in Bank Nifty. Let us check other stocks.
Canara Bank is already on the move.
Axis bank has also formed a rounding bottom pattern like bank nifty. It is one of the private sector bank stocks that can support bank nifty.
Sbin is moving steadily, and now it is getting ready to give a breakout out of the consolidation zone.
ICICI, Kotak are still within range. RBL Bank is looking better. We have gone through few important stocks. Please share the charts with your analysis, if I have missed any.
Did I miss? Yes, I do. It is for you to analyze. 😇

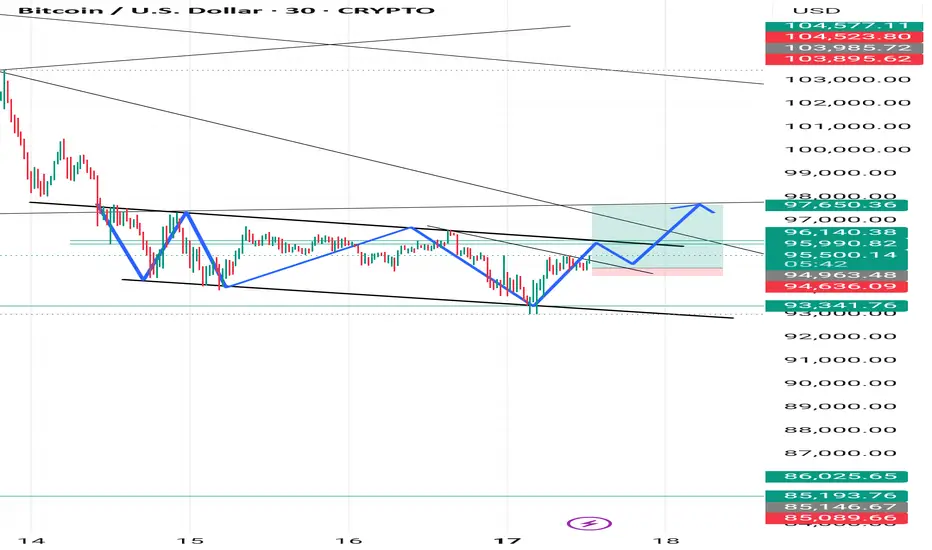
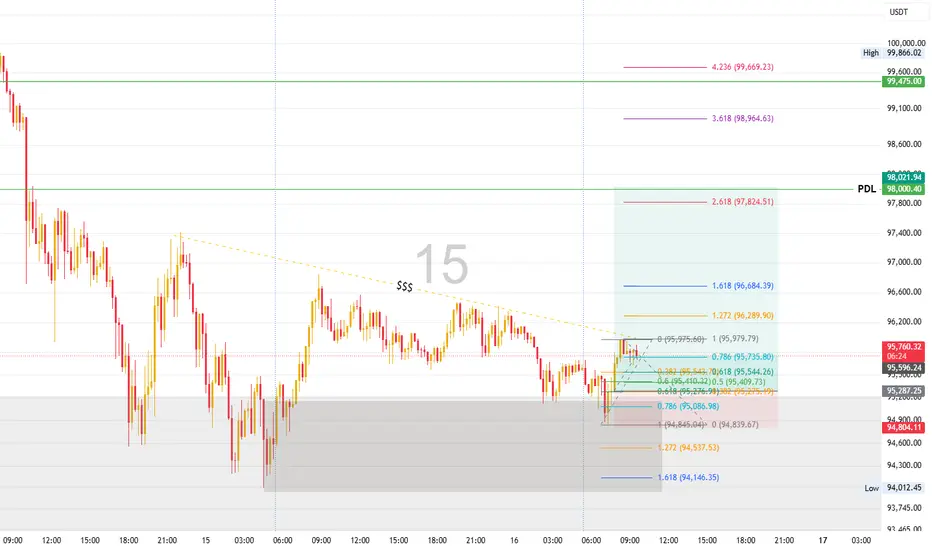
BTCUSD Retest Play: Buying the Dip Toward PDLYesterday BTC failed to tap the Previous Day’s Low (PDL), leaving an untouched liquidity pool below.
Today, price has already formed a liquidity buy zone at 95,665.95, which sits in a premium area.
I’m expecting BTC to potentially test the PDL, so I’m planning to buy on the dip.
📌 Entry: 95,279.63
🛡 Stop Loss: 94,814.54
🎯 Target: PDL 98,000
#BTCUSD
#Bitcoin
#BTC
#Crypto
#CryptoTrading
#LongSetup
#LiquidityGrab
#PDL
#SmartMoney
#PriceAction
#DayTrading
#SwingTrading
#LiquiditySweep
#MarketStructure
#BuyTheDip
#ForexCrypto
#PremiumZone
#OrderFlow
#TechnicalAnalysis
Kotak Mahindra Bank (Neowave Trading Idea)Namaskaram
Cycle - consolidated 5th up swing on Long Term Chart (Black Labelling).
Medium Cycle (Blue Labelling) giving an correction, which most likely completed.
Currently retraced 61 percent.
LTP = 2079.7
stoploss = 1,986
About Target- Well target should be above 2302.
But this price should reach before January. So if you see price is rising but not giving enough speed than exit where you get a good price.
I will also make a video on this one today and upload it here.
Thank You.

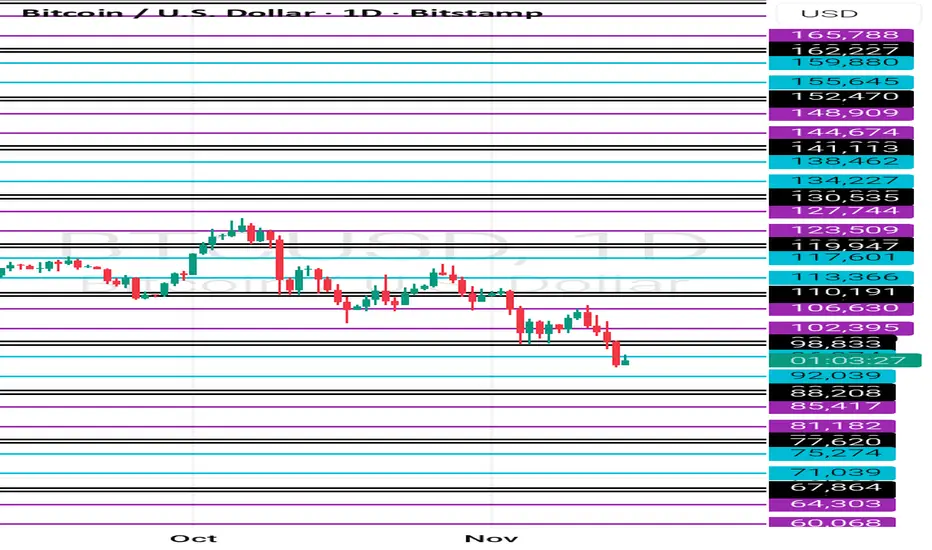
Btc weekly cycle study How to study this range find starting point range pink line to pinnk line starting point blue line to beetwin range

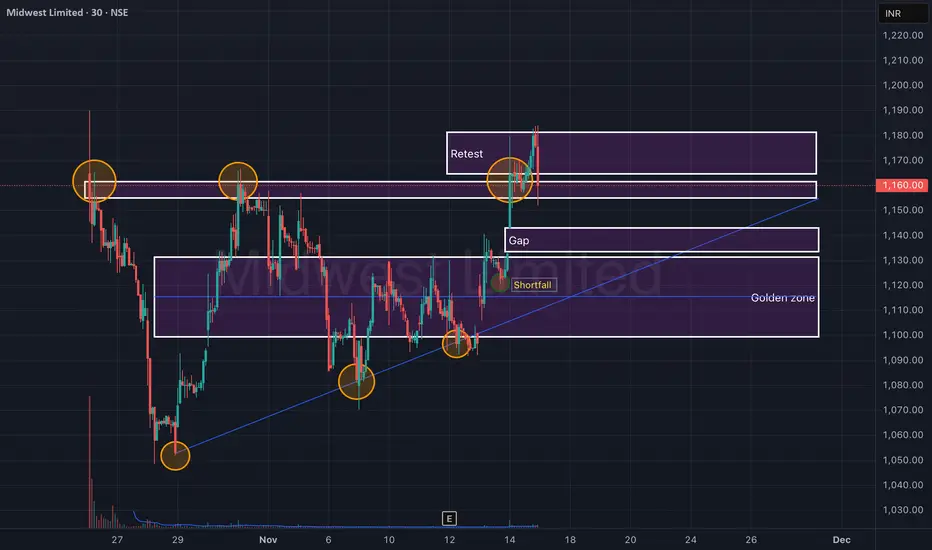
Midwest Ltd – Retest Confirmation After Breakout (30-Min)Midwest Ltd has shown a clean breakout–retest structure on the 30-minute timeframe, respecting both the trendline support and supply zones. The price successfully reclaimed the ₹1,140–₹1,150 range after a short pullback, confirming a bullish retest setup.
The chart highlights how historical rejections (orange circles) have turned into support retests, strengthening the validity of the breakout. If momentum sustains above ₹1,165, a continuation move toward ₹1,180+ could unfold.
🎯 Key Levels:
CMP: ₹1,160 (+3.95%)
Immediate Resistance (Retest Zone): ₹1,165 – ₹1,180
Support / Gap Zone: ₹1,130 – ₹1,145
Golden Zone (Major Support): ₹1,090 – ₹1,115
Stop-Loss: Below ₹1,120 (on 30-min closing basis)
📊 Technical View:
Ascending structure forming higher lows along trendline support.
Gap zone retested successfully, showing demand absorption.
Shortfall recovery followed by a sharp volume rise on breakout.
Sustaining above ₹1,165 may lead to a new swing leg toward ₹1,200.
🧠 View:
Midwest Ltd is showing a textbook breakout–retest structure. Sustaining above ₹1,165 with volume confirmation could trigger a quick 3–4% upside, while ₹1,115 remains the key demand zone.
XAUUSDAs we see gold has been giving short opportunities timing is the key , I prefer for best sniper entry rather. Entering in fomo please checkout my idea.
KEEP IT SIMPLE.
DROP BASE DROP BOYS...

GOLD SHORTI was bearish on gold today was looking for a good opportunity although I didn't got chance to get entry up but got another chance and made short entry you can checkin the idea

NQ1! 14/11/2025 outlookBias → Bearish
Large sell-off yesterday on both S&P 500 and Nasdaq.
Both filled week opening gaps and are holding below.
Another “b-shaped” daily profile yesterday indicating value is lower
Nasdaq closed inside 7th november's value area
Looking for value retest to 24,810 OR low of 24,708.25
