Finnifty Intraday Analysis for 13th November 2025 NSE:CNXFINANCE
Index has resistance near 27550 - 27600 range and if index crosses and sustains above this level then may reach near 27800 - 27850 range.
Finnifty has immediate support near 27150 – 27100 range and if this support is broken then index may tank near 26950 – 26900 range.
Support and Resistance

Midnifty Intraday Analysis for 13th November 2025NSE:NIFTY_MID_SELECT
Index has immediate resistance near 13975 – 14000 range and if index crosses and sustains above this level then may reach 14125 – 14150 range.
Midnifty has immediate support near 13725 – 13700 range and if this support is broken then index may tank near 13575 – 13550 range.
RELIANCE 15MININTRADAY TRADE
- EARN WITH ME DAILY 10K-20K –
RELIANCE Looking good for upside..
When it break level 1520 and sustain.. it will go upside...
BUY@ 1520
Target
1st 1536
2nd 1552
FNO
RELIANCE NOV FUT – LOT 7 (Qty-3500)
RELIANCE NOV 1490 CE – LOT 7 (Qty-3500)
Enjoy trading traders.. Keep add this STOCK in your watch list..
Big Investor are welcome to join the ride ..
Like this Post??? Hit like button..!!!
Follow me for FREE Educational Post and Alert..

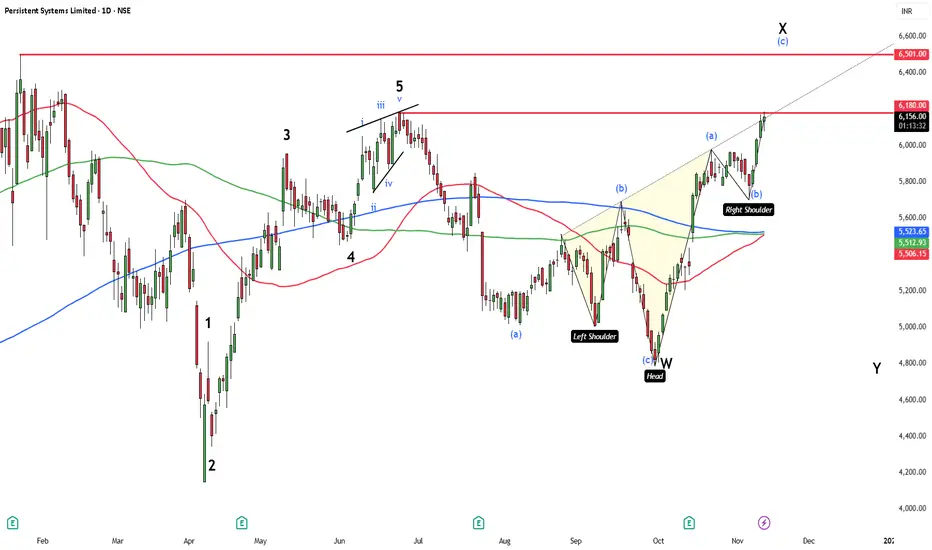
Persistent Systems – Testing the Neckline at ₹6,180The daily chart shows a potential inverted Head & Shoulders forming at the tail end of a larger corrective structure. Price is currently testing the neckline near ₹6,180 , which also aligns with the previous Wave 5 top and acts as immediate resistance. While the setup hints at a bullish reversal , the breakout isn’t confirmed yet — a decisive close above ₹6,180 is needed to validate the pattern and open room toward ₹6,500–₹6,600. Until that happens, the move remains a Wave X corrective rally within a broader W–X–Y decline. Momentum is improving as the 50-DMA approaches a crossover with the 100 and 200 DMAs, but bulls still need to prove strength at the neckline.
Disclaimer: This analysis is for educational purposes only and does not constitute investment advice. Please do your own research (DYOR) before making any trading decisions.
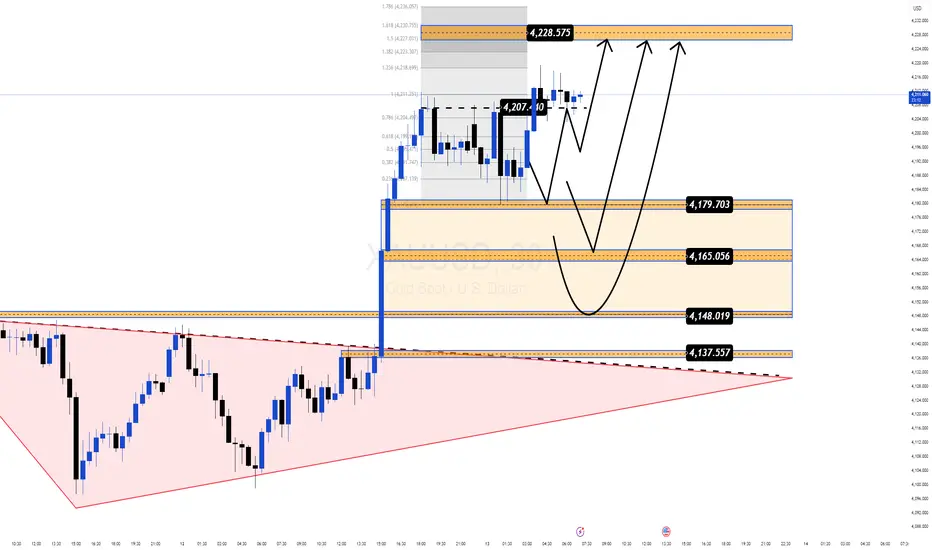
Gold Hits a 3 Week High but the Real Move Might Still Be LoadingGold just tapped $4,213 — the highest level in three weeks, powered by growing expectations of a dovish Fed and optimism around the potential reopening of the US government.
But the real story isn’t the headline spike — it’s the structure forming right beneath it.
📌 Why this zone matters right now
Price is pulling back into $4,179–$4,165, a clean Demand zone aligning with Fibo + breakout structure.
Buyers remain firmly in control despite a mild USD recovery.
The market swept liquidity around $4,207, hinting at accumulation before the next expansion.
The broader pattern resembles a falling-wedge breakout, often appearing before strong upside continuation phases.
🎯 Most Probable Scenario (Mind Insight)
Gold is in a “compression before expansion” phase.
Once this squeeze resolves, momentum is likely to continue in the direction that’s already dominant — and right now, that’s the bulls.
🔶 MMF BUY Zone
$4,179 → $4,165
Looking for a shallow pullback before the next leg.
🔼 Bullish Targets
• $4,207 (liquidity tap)
• $4,228 (Fibo 1.618)
• $4,236 (Fibo 1.786 — major reaction zone)
🧠 Key Takeaway
As long as Gold holds above $4,165, the bullish structure remains intact and the upside expansion toward the upper Fibo cluster stays in play.
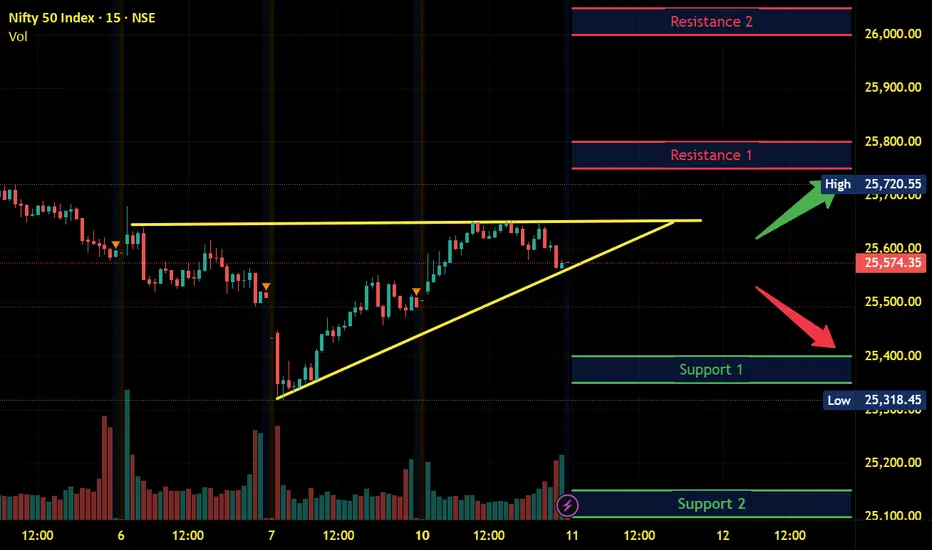
Nifty Intraday Analysis for 12th November 2025NSE:NIFTY
Index has resistance near 25850 – 25900 range and if index crosses and sustains above this level then may reach near 26100 – 26150 range.
Nifty has immediate support near 25500 – 25450 range and if this support is broken then index may tank near 25300 – 25250 range.

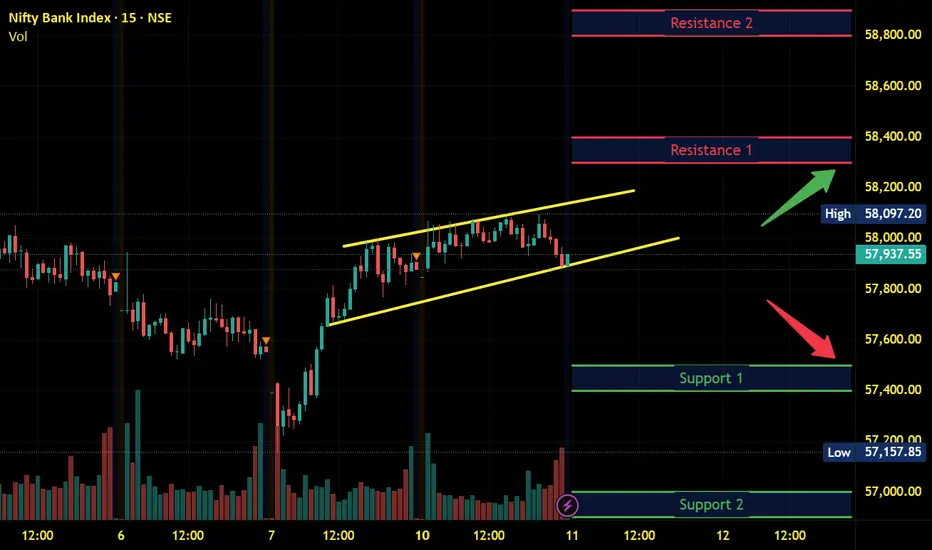
Banknifty Intraday Analysis for 12th November 2025NSE:BANKNIFTY
Index has resistance near 58500 – 58600 range and if index crosses and sustains above this level then may reach near 59000 – 59100 range.
Banknifty has immediate support near 57700 - 57600 range and if this support is broken then index may tank near 57200 - 57100 range.

Finnifty Intraday Analysis for 12th November 2025 NSE:CNXFINANCE
Index has resistance near 27500 - 27550 range and if index crosses and sustains above this level then may reach near 27750 - 27800 range.
Finnifty has immediate support near 27100 – 27050 range and if this support is broken then index may tank near 26900 – 26850 range.

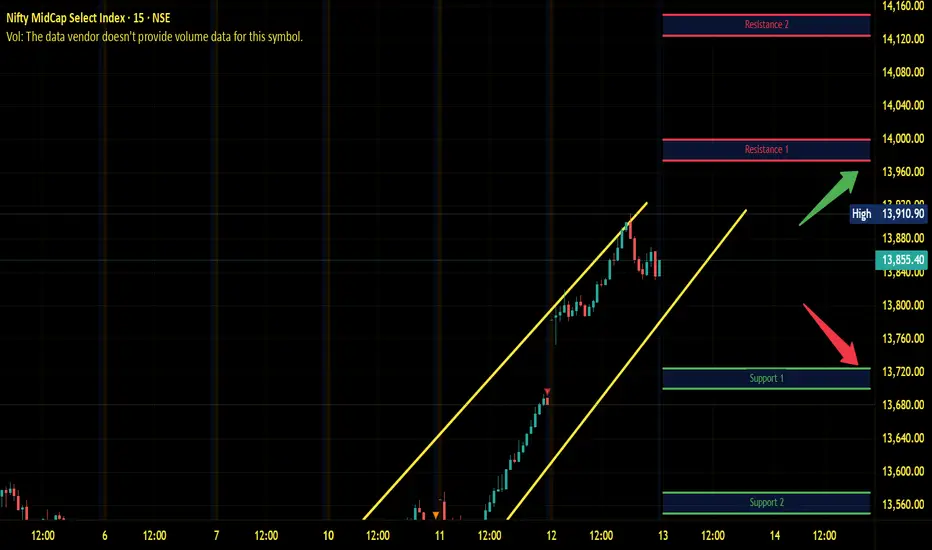
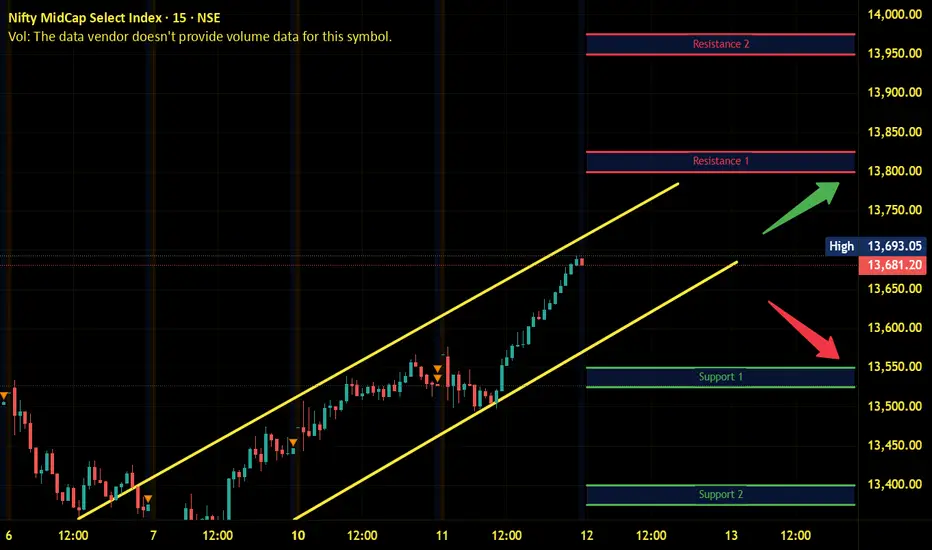
Midnifty Intraday Analysis for 12th November 2025NSE:NIFTY_MID_SELECT
Index has immediate resistance near 13800 – 13825 range and if index crosses and sustains above this level then may reach 13950 – 13575 range.
Midnifty has immediate support near 13550 – 13525 range and if this support is broken then index may tank near 13400 – 13375 range.
Tesla’s Technical Outlook and Future Possibilities Tesla’s Technical Outlook and Future Possibilities
Tesla’s current price action reflects a phase of consolidation after a strong rally, where traders are carefully observing how the stock reacts near crucial levels.
The stock’s position around $439 indicates indecision between buyers and sellers, as it trades between an important support trendline and a well-defined resistance zone.
This structure typically represents a buildup phase before a major directional move.
The inclined support line has shown consistent strength over the past few months, highlighting steady institutional interest even during market pullbacks.
As long as the price respects this trendline, the overall technical bias remains positive. A bounce from this level could reignite bullish momentum, targeting the higher range of $480 to $490.
A breakout above this ceiling could confirm a continuation of the long-term uptrend, possibly leading to new record highs.
On the contrary, a failure to sustain above the inclined support may shift market sentiment toward short-term weakness.
If selling pressure intensifies, the stock could revisit lower supports around $400 or even the $350 area, which served as the base of the previous breakout.
Such a pullback, however, would not necessarily signal the end of Tesla’s larger bullish cycle — it could instead offer a healthier retracement for long-term investors.
Overall, Tesla’s chart reflects a stock at a turning point. The next move will depend on how it behaves around its support structure and whether it can overcome the heavy resistance overhead.
Traders should stay alert to both technical triggers and fundamental news especially updates from the Chinese market, production data, and macroeconomic factors.
Tesla remains one of the most watched stocks globally, and its upcoming moves are likely to set the tone for broader sentiment in the electric vehicle sector.

BUY TODAY SELL TOMORROW for 5%DON’T HAVE TIME TO MANAGE YOUR TRADES?
- Take BTST trades at 3:25 pm every day
- Try to exit by taking 4-7% profit of each trade
- SL can also be maintained as closing below the low of the breakout candle
Now, why do I prefer BTST over swing trades? The primary reason is that I have observed that 90% of the stocks give most of the movement in just 1-2 days and the rest of the time they either consolidate or fall
Resistance Breakout in BSE
BUY TODAY SELL TOMORROW for 5%

Nifty - What next?The price took support from the 25780 zone and moved up. 25780 is the strong support zone as of now. If the price opens with a gap down and shows bullish strength at 25780 zone, then it can move towards 26k. Or if the price opens flat, then buy above 25920 with the stop loss of 25870 for the targets, 25960, 26000, 26050 and 26090.
If the price opens between 25800 to 25900, that is within today's range with less trend strength, then it will try to test the previous support at 25500.
Short-term range is 25500 to 26100. Watch how the price behaves after it opens, then confirm the trend and trade.
Always do your analysis before taking any trade.

Possible Nifty Resistance to supportMultiple bullish confluences in Nifty at current level is seen.
1. There is good resistance to support possible in Nifty nr ATH.
2. Good cup and handle pattern.
3. There is support nr weelky 20sma.
If nifty closes above Friday's high than it will trigger buy which can take nifty to 29000+ levels.
We need to wait for next week close. Target and SL marked on chart.

XAU/USD – Price Accumulating in a Narrow Range, Ready to Expand⏰ Timeframe: 30m
📅 Update: 11/12/2025
🔍 Market Context
Gold maintains a neutral structure after forming a Change of Character (CHoCH) around the 4,144 USD area.
Yesterday's session witnessed a narrow fluctuation between the Demand Zone – Support Zone, indicating the market is absorbing liquidity before determining the next direction.
The medium-term upward momentum remains unbroken, but the price needs a clear balancing phase before continuation.
📊 Technical Structure
Demand Zone (4,144 USD): a short-term supply – demand area where the market previously reacted strongly, now becoming a potential testing zone.
Support Zone (4,099 USD): confluence structure – an area where buying flows may return when the price retests.
Order Block (4,081 USD): a deep defensive zone, corresponding to the main Discount area in the current cycle.
Equal Lows (EQL) & CHoCH: indicate a short-term transition between two sides, but the overall bias slightly leans towards an increase.
🎯 Market Outlook
High probability scenario for the day:
1️⃣ Price may fluctuate within the 4,099–4,144 USD balance zone to attract liquidity.
2️⃣ If a strong reaction occurs from the Support Zone or Order Block, gold may establish a new upward move towards 4,165–4,180 USD.
3️⃣ Conversely, if the price closes below 4,081 USD, the short-term structure will temporarily shift to neutral, prioritizing a re-accumulation phase.
🧠 Analyst’s View
Current price behavior reflects a “pause phase” in the larger upward structure.
When the market balances at lower levels, the key observation is not the bounce, but the reaction when liquidity is swept — where the true momentum of the trend is reignited.
As long as the price does not break the 4,081 USD mark, the medium-term upward trend remains intact.
🛡️ Risk Note
This is a technical analysis, not investment advice.
The market can change rapidly during US sessions – wait for clear confirmation from price action before participating.

XAU/USD – Gold Maintains Bullish Structure, Monitor FVG 4,060📊 Market Structure
After completing the structure break (ChoCH + BoS) at the 4,080 USD zone, gold has sustained a strong upward momentum and created Equal High 4,140 – 4,145 USD , corresponding with the short-term resistance Order Block .
Currently, the price is technically reacting in this area, indicating short-term profit-taking pressure from buyers after a prolonged rally.
The H1 structure remains bullish as the main support zones have not been broken.
A potential scenario is that the price will adjust to FVG zones or support to absorb liquidity before bouncing towards the Liquidity Zone 4,197 USD — the upper liquidity peak.
💎 Key Technical Zones
• OB & Resistance: 4,127 – 4,140 USD
• Support Zone: 4,104 – 4,107 USD
• FVG Zone #1: 4,060 – 4,067 USD
• FVG Zone #2: 4,031 – 4,037 USD
• Liquidity Target: 4,197 USD
🎯 Trading Plan
1️⃣ SELL Setup – Pullback Scalping
If the price reacts sharply downward at the OB zone 4,127 – 4,140 USD:
• Entry: 4,132 – 4,137
• SL: 4,150
• TP1: 4,104
• TP2: 4,067
→ Short-term trade, leveraging the pullback to the support zone to prepare for the next BUY setup.
2️⃣ BUY Setup – Continuation
When the price completes its adjustment to the FVG or Support Zone and a bullish signal appears (rejection / engulfing):
• Entry: 4,067 or 4,037
• SL: 4,020
• TP1: 4,140
• TP2: 4,197
• TP3: 4,210
→ Main setup in the current trend. Prioritize buying at the discount zone after sufficient liquidity is absorbed at the lower zone.
🧠 Vincent’s View
The H1 structure remains buyer-favored. Current adjustments are technical, not reversals.
The FVG zone around 4,060 USD is a key point to observe price behavior — if a clear reaction occurs, this could be the starting point for the next upward wave to 4,197 USD .
“Liquidity fuels the next move — let the market breathe before the impulse.” ⚜️
⏰ Timeframe: 1H
📅 Updated: 11/12/2025
✍️ Analysis by: Captain Vincent

ETH/USD - Fair Value Gap Retracement with Historical Reactions📈 ETH/USD – Fair Value Gap Retracement and Support Line Interaction
Ethereum’s daily chart showcases a clear bearish market structure, marked by a consistent series of lower highs and lower lows.
Throughout this decline, multiple Fair Value Gaps (FVGs) have emerged, each reflecting price inefficiencies created by strong institutional sell-side displacement.
These historical FVGs — now visible above the current price — reveal how ETH has repeatedly retraced to fill prior imbalances before resuming its downward trajectory.
The latest setup forms yet another bearish FVG, potentially acting as a retracement zone before continuation.
⸻⸻⸻⸻⸻⸻⸻⸻⸻⸻
📊 Key Observations
1️⃣ Historic FVG Reaction – The previous FVG (around the mid-October region) acted as a powerful supply zone. Price retraced deeply into that imbalance, filled it almost completely, and then reversed sharply — validating the concept of FVG-based rebalancing before continuation.
2️⃣ Current FVG Setup – A new bearish Fair Value Gap has now formed following another strong sell-side impulse. This zone represents a fresh inefficiency that may attract retracement before the next move down.
3️⃣ Optimal Confirmation Depth – The best confirmation typically occurs when price retraces toward the high of the FVG.
Reaching the upper boundary indicates that buy-side liquidity has been tapped and unfilled institutional sell orders have likely been triggered, often preceding a sharp rejection.
4️⃣ Descending Support Line – The trendline below price continues to act as a liquidity attractor. Stops often accumulate beneath it, making it a potential sweep zone before reversal.
5️⃣ Structural Context – The broader structure remains bearish. As long as price trades below the most recent FVG, sellers maintain full control.
⸻⸻⸻⸻⸻⸻⸻⸻⸻⸻
📊 Chart Explanation
Symbol → BINANCE:ETHUSD
Timeframe → 1D
This chart highlights the continuity of Fair Value Gap behavior throughout Ethereum’s bearish cycle.
The earlier FVGs (visible above current price) acted as magnets for retracement and then rejection — clear evidence of institutional rebalancing in action.
Each time ETH filled a previous FVG, the market found equilibrium before continuing downward.
Now, a fresh bearish FVG has formed, marking the next potential reaction area.
If price retraces deeper — ideally up to the high of this new FVG — it would offer the most reliable confirmation of a likely rejection. A shallower retracement, on the other hand, could signal weaker corrective intent.
Below current price, the descending support line identifies a possible liquidity pool. Price may sweep below this line to collect liquidity before any larger reversal attempt.
This confluence of historic and active FVGs, combined with the trendline structure, perfectly captures Smart Money’s rebalancing logic — inefficiency, retracement, rejection, and continuation.
The chart structure clearly displays a sequence of Lower Highs (LH) and Lower Lows (LL), confirming the ongoing bearish trend. This repeating HH–HL–LH–LL rhythm reflects controlled market structure and institutional rebalancing behavior.
⸻⸻⸻⸻⸻⸻⸻⸻⸻⸻
✅ Summary
• Ethereum continues to form lower highs and lower lows, maintaining its bearish structure.
• Historic FVGs show how price repeatedly retraced, filled inefficiencies, and reversed lower.
• A deeper retracement toward the high of the current FVG provides stronger confirmation for a rejection setup.
• The descending support line may act as a liquidity sweep zone before reversal.
• The overall sentiment remains bearish unless price closes above the FVG zone.
⸻⸻⸻⸻⸻⸻⸻⸻⸻⸻
⚠️ Disclaimer
📘 For educational purposes only.
🙅 Not SEBI registered.
❌ Not a buy/sell recommendation.
🧠 Purely a learning resource.
📊 Not Financial Advice.

XAU/USD – Gold Technical Adjustment Before Continuing Uptrend⏰ Timeframe: 30m
📅 Updated: 11/11/2025
🔍 Market Context
After a strong rally from the start of the Asian session, gold paused around 4,130–4,140 USD, indicating a temporary cooling off after a series of consecutive Break of Structure (BOS).
The current price is situated between a short-term resistance zone and a technical support (Order Block) – clearly reflecting a rebalancing behavior after a rapid expansion.
📊 Technical Structure
Resistance Zone (4,145 USD): a short-term reaction area, coinciding with a Weak High. If the price surpasses this, the uptrend structure will continue towards the Liquidity Zone around 4,198 USD.
Order Block (4,111 USD): a confluence area between 0.382–0.5 Fibonacci, likely to attract buying interest when the price adjusts.
OB Deep (4,081 USD): a deep support area, coinciding with the 0.618 Fibonacci level — where buyers might defend the main trend.
Liquidity Zone (4,198 USD): a potential expansion target if the uptrend structure is reconfirmed.
🎯 Market Outlook
High probability scenario:
1️⃣ Price technically adjusts to OB 4,111 or OB Deep 4,081, creating a reaction at the Discount area.
2️⃣ As buying momentum returns, the price may retest the Resistance Zone 4,145, then expand towards the Liquidity Zone 4,198 USD.
3️⃣ Breaking below 4,081 USD will weaken the short-term structure, shifting to a deeper rebalancing state.
🧠 Analyst’s View
This is a natural “cooldown” phase after a strong rally — the market is seeking liquidity before establishing the next upward move.
As long as the price holds above the 4,081 USD area, the main trend remains bullish.
Observing reactions at the OB will help determine if the upward momentum will continue to dominate in the US session.
🛡️ Risk Note
The market is adjusting within a larger trend — avoid emotional actions when the price has not completed the retracement phase.

Gold Reaches Supply Zone: Prepare for a Pullback to FVG📊 Market Structure
Gold continues to maintain its bullish structure after breaking the structure high (BoS) at the 4,000 USD zone and forming a steep bullish channel over the past 3 sessions.
Currently, the price is precisely hitting the Order Block 4,140 – 4,150 USD — a critical supply zone formed from the previous distribution.
The H1 candle is showing slight technical reaction signs , implying the potential for a short pullback to re-accumulate liquidity.
If a pullback occurs, the Premium Zone 4,080 – 4,085 USD and FVG 4,025 – 4,035 USD will be ideal areas to look for buy signals.
The bullish structure is only invalidated if the H1 candle closes below the Support 4,006 USD zone.
💎 Key Technical Zones
• Order Block: 4,140 – 4,150 USD → main supply zone, where profit-taking pressure appears
• Premium Zone: 4,080 – 4,085 USD → medium-term rebalancing zone
• FVG Zone: 4,025 – 4,035 USD → potential discounted price zone for BUY orders
• Support Zone: 4,000 – 4,006 USD → critical defense zone
🎯 Trading Plan
1️⃣ SELL Scalp – Reaction at OB 4,145 USD
If the price continues to react downwards at the 4,140 – 4,150 USD supply zone:
• Entry: 4,143 – 4,147
• SL: 4,155
• TP1: 4,085
• TP2: 4,035
→ Short-term setup, targeting the rebalancing zone before buying back in line with the trend.
2️⃣ BUY Setup – Continuation from FVG Zone
When the price pulls back to the FVG / Premium Zone and creates a confirmed bullish signal:
• Entry: 4,030 – 4,035
• SL: 4,006
• TP1: 4,090
• TP2: 4,145
• TP3: 4,170
→ Trend-following setup, preferred when the price re-accumulates and a clear rejection appears.
🧠 Vincent’s View
Buyers still control the market, but the current OB touch may trigger a short pullback before the bullish wave continues.
The ideal scenario is “tap OB → pullback FVG → continuation,” maintaining a stable bullish structure towards the 4,170 USD target.
“Buy the dip where fear replaces greed — that’s where the next impulse begins.” ⚜️
⏰ Timeframe: 1H
📅 Updated: 11/11/2025
✍️ Analysis by: Captain Vincent

Bajaj Finserv rides a long-term bullish waveTopic Statement:
Bajaj Financial Services continues its evergreen bull run, supported by strong technical structure and improved affordability following its June 2025 stock split and bonus.
Key Points:
1. The stock is trading within a bullish up-trending channel, making it ideal for structured channel trading
2. Price rarely dips below the 200-day EMA, and such moments have historically been excellent long-term accumulation opportunities
3. Dips below the 50-day EMA offer favorable entry points for short-term swing trades or quantity accumulation
4. The stock faces stiff resistance at the 2000 level, which has historically acted as a ceiling
5. The June 2025 stock split and bonus have made the stock more affordable, resulting in increased volumes and improved liquidity

Nifty Intraday Analysis for 11th November 2025NSE:NIFTY
Index has resistance near 25750 – 25800 range and if index crosses and sustains above this level then may reach near 26000 – 26050 range.
Nifty has immediate support near 25400 – 25350 range and if this support is broken then index may tank near 25150 – 25100 range.
Banknifty Intraday Analysis for 11th November 2025NSE:BANKNIFTY
Index has resistance near 58300 – 58400 range and if index crosses and sustains above this level then may reach near 58800 – 58900 range.
Banknifty has immediate support near 57500 - 57400 range and if this support is broken then index may tank near 57000 - 56900 range.
Finnifty Intraday Analysis for 11th November 2025 NSE:CNXFINANCE
Index has resistance near 27500 - 27550 range and if index crosses and sustains above this level then may reach near 27750 - 27800 range.
Finnifty has immediate support near 27100 – 27050 range and if this support is broken then index may tank near 26900 – 26850 range.

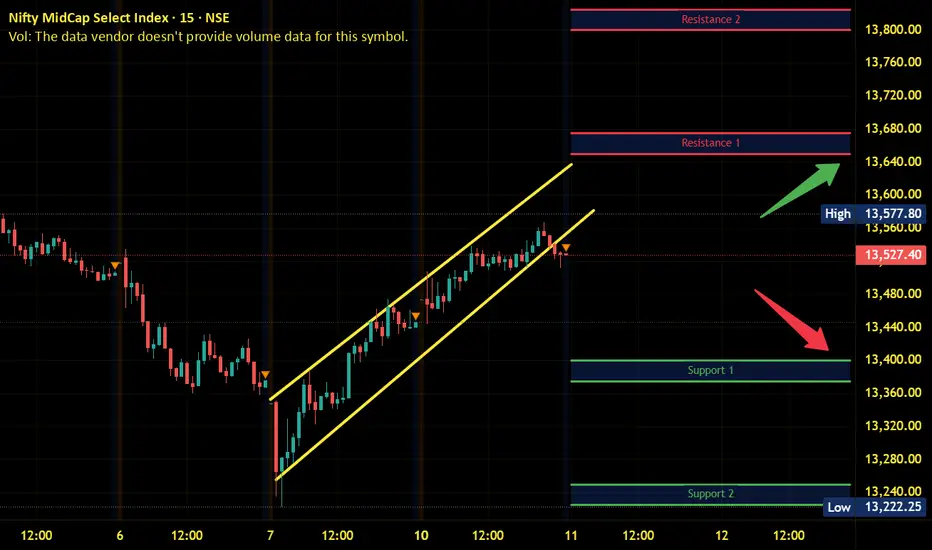
Midnifty Intraday Analysis for 11th November 2025NSE:NIFTY_MID_SELECT
Index has immediate resistance near 13625 – 13650 range and if index crosses and sustains above this level then may reach 13800 – 13825 range.
Midnifty has immediate support near 13400 – 13375 range and if this support is broken then index may tank near 13250 – 13225 range.