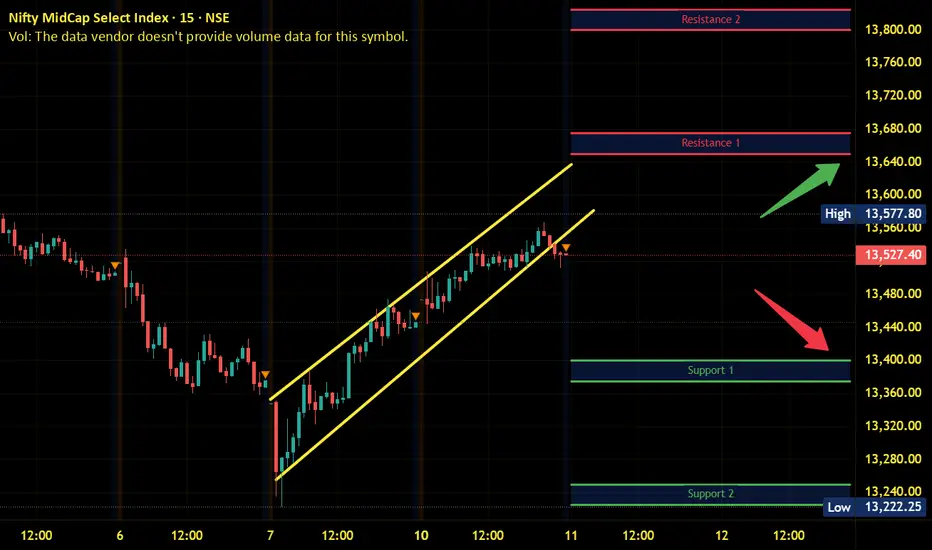
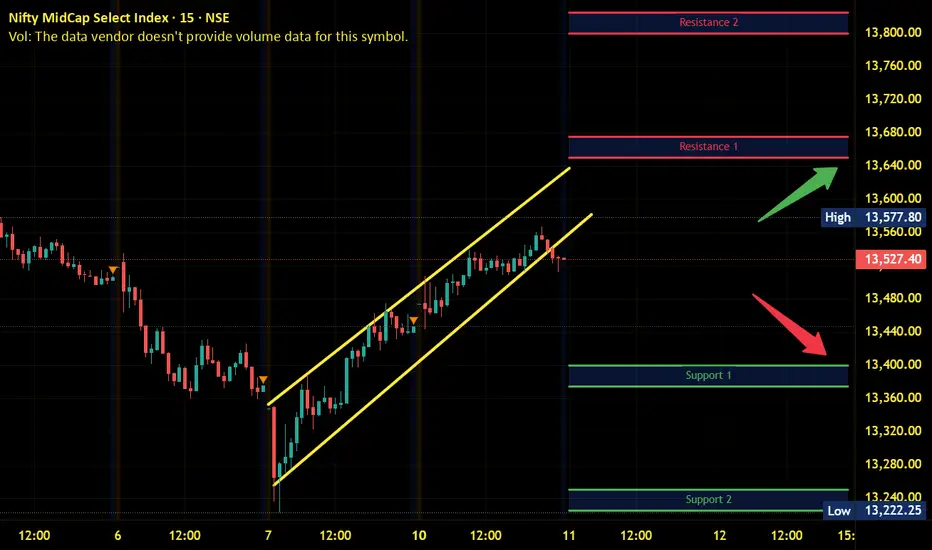
Midnifty Intraday Analysis for 11th November 2025NSE:NIFTY_MID_SELECT
Index has immediate resistance near 13625 – 13650 range and if index crosses and sustains above this level then may reach 13800 – 13825 range.
Midnifty has immediate support near 13400 – 13375 range and if this support is broken then index may tank near 13250 – 13225 range.
Support and Resistance
Gold Holds Firm Above $4,140, Aiming for a $4,200 Breakout🔍 Market Context
Gold continues its strong upward momentum, trading around a 3-week high at $4,146 as buyers maintain full control of the trend.
Despite a slight recovery in the USD due to cautious sentiment in the Asian market, gold's upward drive remains intact — supported by expectations that the Fed might cut interest rates in December.
Weak U.S. economic data and a sharp drop in consumer sentiment have further reinforced this expectation, reducing real yields and increasing safe-haven demand for gold.
📊 Technical Analysis (H1–H4 timeframe)
The market structure remains clearly bullish, with the ascending channel pattern being maintained.
The price has broken through the previous resistance area at $4,086 and is currently consolidating around $4,140, indicating potential preparation for the next upward move.
Important Levels:
• Support: $4,086 – $4,039 → potential retest area for buyers
• Short-term Resistance: $4,146
• Breakout Target: $4,203
• Extended Target: $4,382 (all-time high – ATH)
As long as the price holds above $4,080, the bullish trend is favored.
Only a clear close below this area might trigger a short-term correction before continuing higher.
⚜️ MMFLOW Insight:
“Momentum always follows liquidity. When the price reclaims the main structure, Smart Money stops observing – they start building the next upward wave.”

DJI 1HRSWING TRADE
- EARN WITH ME DAILY 10K-20K –
DJI Looking good for upside..
When it break level 47451 and sustain.. it will go upside...
BUY@ 47451
Target
1st 47700
2nd 48036
Enjoy trading traders.. Keep add this STOCK in your watch list..
Big Investor are welcome to join the ride ..
Like this Post??? Hit like button..!!!
Follow me for FREE Educational Post and Alert..

Nifty Intraday Analysis for 11th November 2025NSE:NIFTY_MID_SELECT
Index has resistance near 25750 – 25800 range and if index crosses and sustains above this level then may reach near 26000 – 26050 range.
Nifty has immediate support near 25400 – 25350 range and if this support is broken then index may tank near 25150 – 25100 range.
Gold Retests FVG Preparing for a New Uptrend, Target 4,120 USD📊 Market Structure
Gold has officially broken the bearish structure (BoS + ChoCH) by surpassing the 4,025 USD zone, confirming a significant shift in market momentum.
Following a series of consecutive BoS and a break of the downtrend line, the price is entering a balanced retest phase (FVG 4,030 – 4,040 USD) .
As long as the price maintains above the 4,020 USD support zone, the bullish structure remains intact, and it is expected to target the Liquidity Zone 4,070 – 4,090 USD , further extending to the Order Block 4,118 – 4,125 USD .
💎 Key Technical Zones
• FVG Retest Zone: 4,030 – 4,040 USD
• Trendline Support: around 4,000 USD
• Liquidity Zone: 4,070 – 4,090 USD
• Final Target (OB): 4,118 – 4,125 USD
🎯 Trading Plan
1️⃣ BUY Setup #1 – Main FVG Retest
If the price retraces to the FVG zone of 4,030 – 4,040 USD and forms a bullish confirmation signal (bullish candle / rejection wick):
• Entry: 4,033 – 4,038
• SL: 4,020
• TP1: 4,070
• TP2: 4,090
• TP3: 4,120
→ Enter at the “discount” zone after the market absorbs liquidity.
2️⃣ BUY Setup #2 – Defensive (deep trendline retest)
If the price slightly sweeps the small OB zone around the trendline:
• Entry: 3,998 – 4,004
• SL: 3,985
• TP1: 4,070
• TP2: 4,120
→ The structure remains intact, this entry has a high RR, suitable for mid-term swing.
⚠️ Invalidation:
• If the price closes an H1 candle below 3,985 USD → the short-term uptrend is invalidated.
🧠 Vincent’s View
The buyers are fully controlling the H1 structure after breaking the downtrend line that lasted nearly 2 weeks.
The price is likely to complete the FVG – trendline – breakout retest before continuing to expand towards the liquidity peak of 4,120 USD.
This is the “buy-the-dip” strategic phase for this week.
“Smart money buys the discount while everyone waits for confirmation.” ⚜️🟡
⏰ Timeframe: 1H
📅 Updated: 11/10/2025
✍️ Analysis by: Captain Vincent

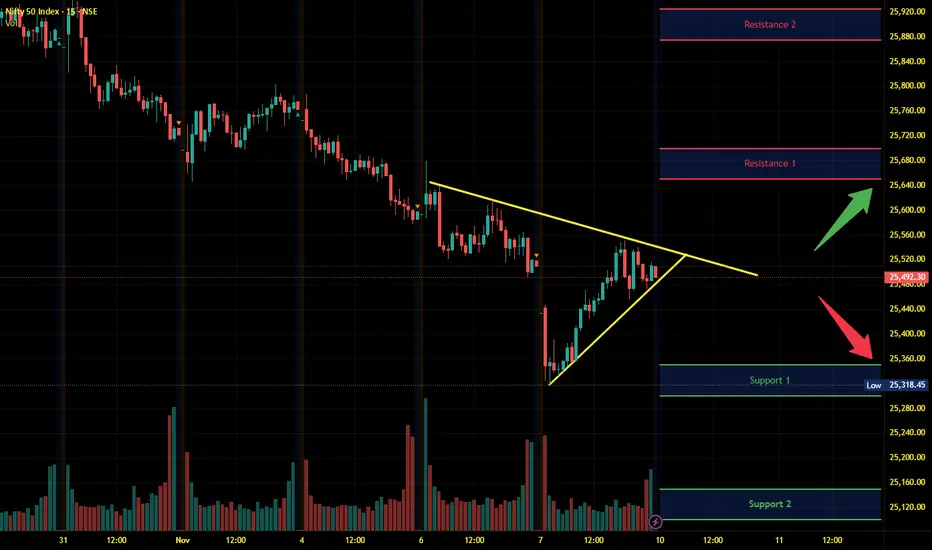
Nifty Intraday Analysis for 10th November 2025NSE:NIFTY
Index has resistance near 25650 – 25700 range and if index crosses and sustains above this level then may reach near 25875 – 25925 range.
Nifty has immediate support near 25350 – 25300 range and if this support is broken then index may tank near 25150 – 25100 range.
The market is expected to be range-bound for the next couple of days, with a decisive move on either side anticipated after the Bihar Election result outcome which is scheduled on Friday.
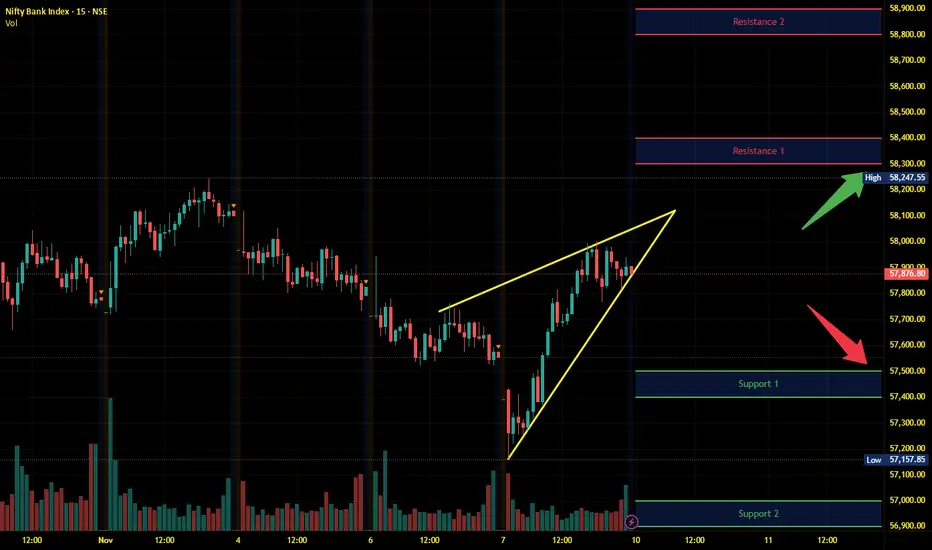
Banknifty Intraday Analysis for 10th November 2025NSE:BANKNIFTY
Index has resistance near 58300 – 58400 range and if index crosses and sustains above this level then may reach near 58800 – 58900 range.
Banknifty has immediate support near 57500 - 57400 range and if this support is broken then index may tank near 57000 - 56900 range.
The market is expected to be range-bound for the next couple of days, with a decisive move on either side anticipated after the Bihar Election result outcome which is scheduled on Friday.
Finnifty Intraday Analysis for 10th November 2025 NSE:CNXFINANCE
Index has resistance near 27450 - 27500 range and if index crosses and sustains above this level then may reach near 27700 - 27750 range.
Finnifty has immediate support near 27050 – 27000 range and if this support is broken then index may tank near 26800 – 26750 range.
The market is expected to be range-bound for the next couple of days, with a decisive move on either side anticipated after the Bihar Election result outcome which is scheduled on Friday.

Midnifty Intraday Analysis for 10th November 2025NSE:NIFTY_MID_SELECT
Index has immediate resistance near 13575 – 13600 range and if index crosses and sustains above this level then may reach 13725 – 13750 range.
Midnifty has immediate support near 13325 – 13300 range and if this support is broken then index may tank near 13175 – 13150 range.
The market is expected to be range-bound for the next couple of days, with a decisive move on either side anticipated after the Bihar Election result outcome which is scheduled on Friday.

Fair Value Gap Retracements in a Downtrend📈 BTC/USD – Understanding Fair Value Gap Retracements in a Downtrend
The current market structure on the daily timeframe highlights a clear bearish trend, where price continues to form lower highs and lower lows.
After a strong downward impulse, a Fair Value Gap (FVG) has formed — representing an area of imbalance that price may eventually retrace to before deciding its next move.
This setup reflects a potential rebalancing phase within the ongoing downtrend.
⸻⸻⸻⸻⸻⸻⸻⸻⸻⸻
📊 Key Observations
1️⃣ FVG Formation — A bearish Fair Value Gap has emerged following a strong sell-side move, signaling a region of inefficiency left behind by aggressive sellers.
2️⃣ Retracement Possibility — Price may attempt to retrace into the FVG zone to rebalance this inefficiency before continuing its primary downtrend.
3️⃣ Potential Rejection Zone — If price reacts negatively from the FVG, it could confirm continued bearish sentiment and lead to another lower low.
4️⃣ Trend Context — The overall market remains under a descending structure, with sellers maintaining control as long as price stays below the FVG zone.
⸻⸻⸻⸻⸻⸻⸻⸻⸻⸻
📊 Chart Explanation
Symbol → BINANCE:BTCUSD
Timeframe → 1D
This chart illustrates how a Fair Value Gap (FVG) functions as a key retracement zone within a broader bearish structure. The price action shows a sequence of lower highs and lower lows, confirming a prevailing downtrend.
After a strong downward impulse, price created a bearish FVG — highlighted in red — representing an imbalance area where institutional orders may remain unfilled. Price is now retracing upward, likely to fill this inefficiency.
If the market faces rejection from this FVG zone, it could signal the continuation of the ongoing bearish momentum. However, a clean break and close above it might hint at a short-term structural shift.
Below the current price, a liquidity pool zone is marked — an area where stop-losses likely reside. Price often sweeps such zones to collect liquidity before reversing, aligning with Smart Money behavior.
Overall, this setup showcases how identifying FVGs within market structure helps traders anticipate rebalancing phases, retracements, and potential reaction points in trending markets.
⸻⸻⸻⸻⸻⸻⸻⸻⸻⸻
✅ Summary
• The Fair Value Gap acts as a magnet zone where price may retrace to fill inefficiency.
• A rejection from the FVG could resume bearish continuation.
• A confirmed close above the FVG might hint at short-term strength or structural shift.
• Traders should observe price behavior within this zone for potential rebalancing reactions.
⸻⸻⸻⸻⸻⸻⸻⸻⸻⸻
⚠️ Disclaimer:
📘 For educational purposes only.
🙅 Not SEBI registered.
❌ Not a buy/sell recommendation.
🧠 Purely a learning resource.
📊 Not Financial Advice.

XAUUSDGold is almost at the Supply. There might be possibility of reversal from here. Buy side liquidity is done. Now it can start targeting sell side Liquidity.

GOLD SHOWING A GOOD UP MOVE WITH 1:10 RISK REWARD GOLD SHOWING A GOOD UP MOVE WITH 1:10 RISK REWARD
DUE TO THESE REASON
A. its following a rectangle pattern that stocked the market
which preventing the market to move any one direction now it trying to break the strong resistant lable
B. after the break of this rectangle it will boost the market potential for break
C. also its resisting from a strong neckline the neckline also got weeker ald the price is ready to break in the outer region
all of these reason are indicating the same thing its ready for breakout BREAKOUT trading are follws good risk reward
please dont use more than one percentage of your capitalfollow risk reward and tradeing rules
that will help you to to become a bettertrader
thank you

Gold Breaks Out from Accumulation, Eyes Wave 3 Expansion🔍 Market Context
Gold kicked off the new week with strong upside momentum, perfectly aligning with MMFLOW’s previous outlook — calling for a Wave 3 impulse from the accumulation base around 3,940$ – 3,970$.
The market’s reaction in early Asia confirmed a bullish structural shift, as gold continues to gain traction amid stable yields and cautious sentiment around the US Dollar.
Macro catalysts remain balanced, but liquidity behavior suggests smart money is loading into the breakout phase, positioning early for a potential run toward the 4,100$ handle this week.
If momentum sustains, this move could mark the official mid-term reversal that MMFLOW anticipated — setting up a broader recovery phase into year-end.
📊 Technical Outlook (H4 Structure)
Gold continues to follow its Elliott Wave recovery path, now developing Wave (3) within the medium-term bullish cycle.
Key Technical Zones:
• 💎 Support: 3,942$ – 3,982$ (accumulation base & breakout retest)
• 🎯 Target 1: 4,072$ – 4,133$ (Wave 3 completion zone)
• ⚙️ Target 2 / Extended: 4,189$ – 4,201$ (Fibo 1.618 extension)
• ⚠️ Invalidation: Below 3,940$ → loss of short-term momentum, return to neutral structure.
The breakout above 4,000$ reinforces bullish sentiment, while higher highs and sustained volume through 4,072$ would confirm a new impulsive phase with room to expand further.
🎯 MMFLOW TRADING View
This breakout isn’t random — it’s a smart-money-led accumulation exit after weeks of liquidity sweeps.
The narrative remains consistent: “Buy the dips inside strength.”
As long as gold stays above 3,970$, the probability of retesting 4,100$+ remains high, and a move toward 4,200$ before year-end cannot be ruled out.
⚜️ MMFLOW Insight:
“When the crowd hesitates, liquidity has already chosen direction.”

ETHUSD SHOWING A GOOD UP MOVE WITH 1:10 RISK REWARDETHUSD SHOWING A GOOD
UP MOVE WITH 1:10 RISK REWARD
DUE TO THESE REASON
A. its following a rectangle pattern that stocked the market
which preventing the market to move any one direction now it trying to break the strong resistant lable
B. after the break of this rectangle it will boost the market potential for break
C. also its resisting from a strong neckline the neckline also got weeker ald the price is ready to break in the outer region
all of these reason are indicating the same thing its ready for breakout BREAKOUT trading are follws good risk reward
please dont use more than one percentage of your capitalfollow risk reward and tradeing rules
that will help you to to become a bettertrader
thank you

Gold Neowave Forecast (10-11-2025)Hello everyone
Sorry for absence as I go in research mode with Neowave and found something interestin, anyway lets talk about gold.
# Gold is started walking again in daily charts and its going or atleast try for the time being to break its all time again.
# I also added a blue box on the chart which is an time box, mean price must cross high within this time limits.
## Stoploss will be 3964 if breaks dont sell just exit.
Rest we will talk in the video along with BTC and Tesla.
Thank You.

Sobha- A breakout of consolidation is on cardsRealty sector has been performing well post Q2 results announcements.
Sobha has posted stellar Q2 numbers but it might be one off quarter as well.
Technically, stock is looking ripe for a good flag breakout of consolidation.
We might soon see a breakout coming but sustainment of breakout is crucial for further upmove.
Levels are mentioned on chart. We can see upside of more than 50% if breakout sustains.
You can also check other realty sector stocks and see if any similar pattern is visible.
Please note that I am just NISM certified RA and not SEBI registered.
This analysis is not a recommendation but has been shared for educational purposes only.

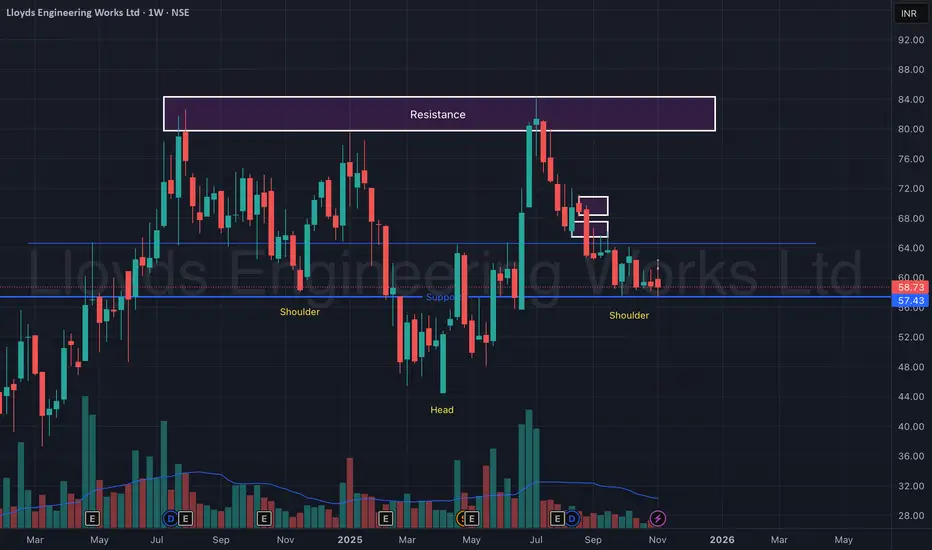
Lloyds Engineering Works Ltd – Ready to Blast from Support Zone!Lloyds Engineering is showing a textbook Inverted Head & Shoulders pattern on the weekly timeframe — a strong reversal formation that often precedes a major uptrend.
The support zone near ₹57–₹58 has held firmly for months, acting as a base for accumulation.
A bullish structure is clearly visible, with both shoulders aligning near the same horizontal support and increasing volumes hinting at smart money participation.
Once the stock decisively breaks above the ₹64 neckline zone, a powerful breakout toward ₹80+ could unfold in the coming weeks.
🎯 Key Levels:
CMP: ₹58.73 (+0.22%)
Pattern: Inverted Head & Shoulders
Support Zone: ₹57 – ₹58 (Strong base)
Neckline / Breakout Zone: ₹64 – ₹66
Target Zone: ₹80 – ₹85
Stop-Loss: ₹54 (Weekly close basis)
📊 Technical View:
Inverted Head & Shoulders forming over a year-long base.
Strong volume spikes near the right shoulder = early accumulation.
EMAs flattening and ready for crossover confirmation.
Sustaining above ₹64 could ignite momentum breakout toward ₹80+.
🧠 View:
Lloyds Engineering looks technically ready for a breakout. With the pattern structure completed and strong volume support, a close above ₹64 can trigger a new uptrend — this one’s “ready to blast.”
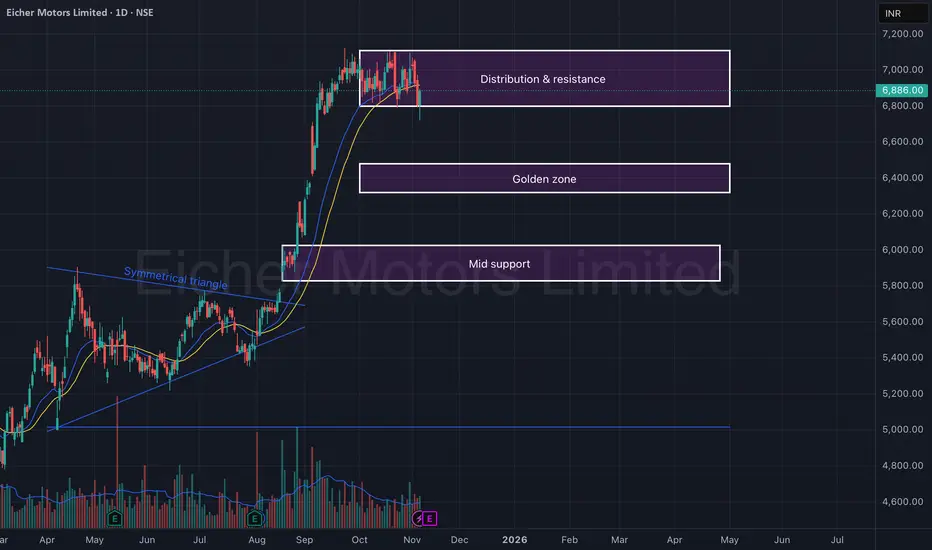
Eicher Motors Ltd – Distribution Zone & Golden Support Level (D)Eicher Motors is showing signs of short-term distribution after a strong uptrend. The price has been consolidating near the ₹6,850–₹7,050 resistance zone, which has acted as a supply area multiple times in recent sessions.
Following an extended rally from the breakout of the symmetrical triangle, the stock appears to be entering a cool-off phase — likely testing lower supports such as the golden zone (₹6,300–₹6,450) or mid support (₹5,900–₹6,000) before resuming its larger trend.
🎯 Key Levels:
CMP: ₹6,886 (+1.17%)
Resistance / Distribution Zone: ₹6,850 – ₹7,050
Golden Zone (Retracement Support): ₹6,300 – ₹6,450
Mid Support: ₹5,900 – ₹6,000
Stop-Loss (if long): Below ₹5,850
📊 Technical View:
Price facing resistance near prior highs, forming short-term distribution structure.
EMA alignment still bullish, but price is attempting a short-term retest.
Golden zone coincides with 38.2–50% retracement levels from the prior rally.
A reversal candle or bullish pattern in the golden zone could present a buying opportunity for swing traders.
🧠 View:
Eicher Motors remains structurally bullish in the medium term, but a short-term pullback is likely. The ₹6,300–₹6,450 golden zone will be key for a potential bounce, while ₹7,000 continues to act as the ceiling until a clear breakout occurs.
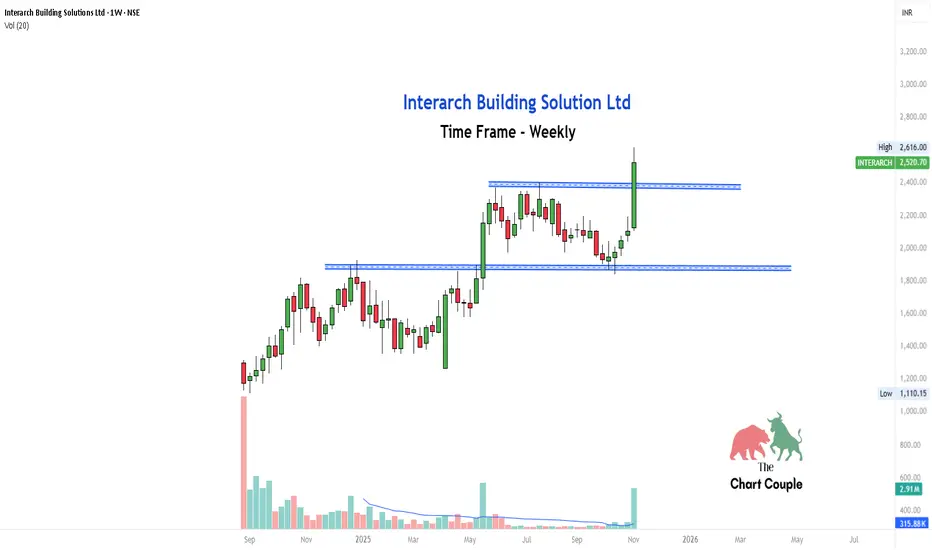
Interarch Building Solution Ltd — Weekly Chart AnalysisInterarch Building Solution Ltd recently broke above a well-defined resistance zone around ₹2,400 after consolidating for several weeks.
The breakout candle is supported by noticeable volume, which validates the move and makes it a strong case study for breakout learners.
What can we learn here:
Breakouts are more reliable on higher timeframes like weekly charts.
Volume expansion often precedes sustained momentum.
Patience during consolidation phases pays off when structure confirms breakout.
XAU/USD – Holds Its Range, Preparing for a Year-End Expansion🔍 Market Context
Friday’s New York session closed with a two-sided liquidity sweep, yet gold managed to hold its structural balance, maintaining the same rhythm seen over the past two weeks — sideways to mildly bearish, but firmly supported.
This behavior shows that buyers are still defending key zones, especially around 3,940$ – 3,980$, which MMFLOW highlighted multiple times last week as the decisive liquidity floor.
From a macro lens, the Fed’s cautious tone has slowed expectations for aggressive rate cuts — but the probability of another reduction before Q1 2026 remains alive.
As we move toward the final stretch of the year, thinner liquidity and seasonal safe-haven flows could help gold establish a mid-term bottom, setting the stage for the next impulsive leg.
📊 Technical Structure (H4)
The current chart presents a clear 5-wave recovery structure within a tightening range — a classic setup before expansion.
Key Technical Zones:
• 💎 Support Zone: 3,942$ – 3,982$ (liquidity base + strong absorption area)
• 🎯 Wave 3 Target: 4,072$ – 4,133$ (first reaction zone)
• ⚙️ Extended Target / Wave 5: 4,189$ – 4,201$ (Fibo 1.618 projection)
• ⚠️ Invalidation: Below 3,940$ → loss of short-term structure, possible re-accumulation lower.
The structure remains sideways but constructive, and a confirmed breakout of the descending trendline could act as the catalyst for a year-end bullish continuation.
🎯 MMFLOW TRADING View
Smart money continues to accumulate within equilibrium zones, with every liquidity sweep appearing more like preparation than rejection.
As long as gold stays above 3,970$, the bullish bias remains valid — with a 60%+ probability of a move toward 4,130$+ in the short to mid-term.
Historically, November–December often brings portfolio rebalancing and policy easing cycles, both of which may serve as fuel for a potential gold rally into Q1 2026.
⚜️ MMFLOW Insight:
“Accumulation isn’t waiting — it’s when big money quietly builds the next wave.”

Fair Value Gap (FVG) — Support and Resistance (S/R)🔎 Overview
The Fair Value Gap (FVG) is a unique price imbalance or inefficiency on a price chart where the market rapidly moves, leaving one or more candles without overlapping wicks between highs and lows.
This signifies aggressive buying or selling, resulting in a “gap” of untraded prices.
Once spotted, FVGs often act as magnets, drawing price back to fill the gap — and later serve as dynamic support or resistance zones, depending on the market direction.
⸻⸻⸻⸻⸻⸻⸻⸻⸻⸻
📔 Concept
A Fair Value Gap forms when:
1️⃣ Resistance FVG -- A strong impulsive move causes the low of the first candle and the high of the third candle (in a three-candle sequence) to fail to overlap, leaving a visible gap.
2️⃣ Support FVG -- A strong impulsive move causes the high of the first candle and the low of the third candle (in a three-candle sequence) to fail to overlap, leaving a visible gap.
3️⃣ Imbalance -- This gap highlights an area where orders were skipped, signaling an imbalance between buyers and sellers.
4️⃣ Rebalance -- When revisited, a Bullish FVG often acts as support, while a Bearish FVG acts as resistance, as price reacts to rebalance the inefficiency before the trend continues.
⸻⸻⸻⸻⸻⸻⸻⸻⸻⸻
📌 How to Use
✅ Validation → A valid FVG exists as long as the gap remains unfilled, and traders watch for price to revisit and react to it.
🟩 Bullish FVG → Support: When price retraces into the gap and finds buying interest, the zone holds as support.
🔴 Bearish FVG → Resistance: When price rallies into a bearish gap and faces rejection, the zone holds as resistance.
❌ Devalidation → If price decisively closes inside the FVG, the gap is considered “filled,” and the setup loses significance.
Typically, the lowest unfilled bullish FVG below price in an uptrend (and the highest bearish FVG above in a downtrend) carries more weight and is prioritized for confluence.
⸻⸻⸻⸻⸻⸻⸻⸻⸻⸻
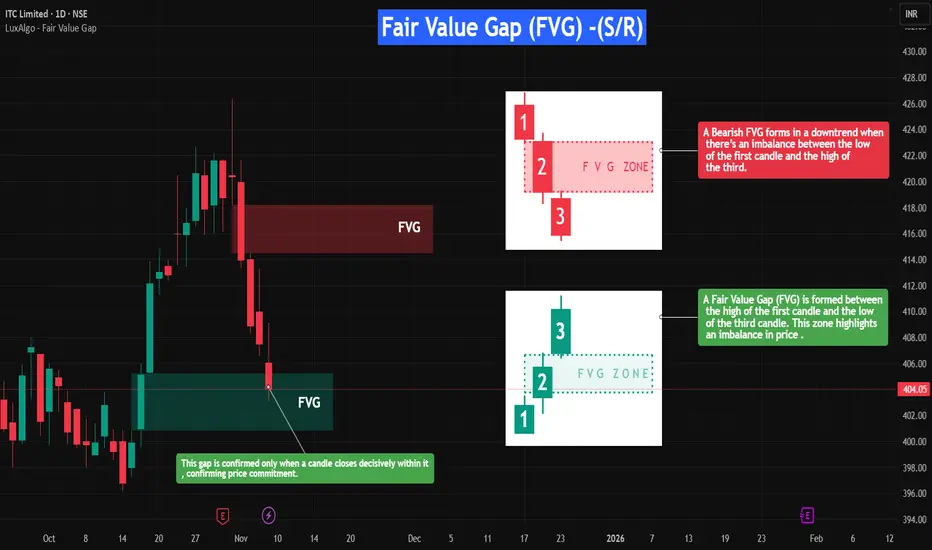
📊 Chart Explanation
Symbol → NSE:ITC
Timeframe → 1D
On the right-hand side, the Fair Value Gaps (FVGs) are illustrated in detail to give a closer look at how they form and function.
These visual examples explain how FVGs represent price inefficiencies — zones that later act as dynamic support or resistance once price revisits them.
On the left-hand side, you can see real-time examples of FVGs forming within live price action.
When a candle closes decisively inside a bullish FVG, it confirms price commitment, allowing the zone to act as support and potentially propel price upward.(These are plotted using open sourced indicator )
This setup beautifully demonstrates how understanding FVG structure helps identify high-probability reaction zones where the market seeks to rebalance itself.
⸻⸻⸻⸻⸻⸻⸻⸻⸻⸻
👀 Observation
Fair Value Gaps work best in volatile markets or during strong impulsive moves.
When price revisits an unfilled gap, the reaction helps define new support or resistance.
Combining FVGs with key structural levels, volume analysis, or momentum indicators (like RSI or Moving Averages) improves reliability.
Always prioritize clean, unfilled gaps aligned with the trend direction for higher conviction.
⸻⸻⸻⸻⸻⸻⸻⸻⸻⸻
💡 Conclusion
The Fair Value Gap not only signals where the market may “rebalance” itself after price inefficiencies but also identifies potential support and resistance zones.
Recognizing how bullish and bearish FVGs interact with price allows traders to anticipate reactions, manage risk, and refine entries and targets with greater accuracy.
⸻⸻⸻⸻⸻⸻⸻⸻⸻⸻
⚠️ Disclaimer
📘 For educational purposes only.
🙅 Not SEBI registered.
❌ Not a buy/sell recommendation.
🧠 Purely a learning resource.
📊 Not Financial Advice.
XAU/USD – Retest Before Takeoff📊 Market Structure
After several days of fluctuating within a narrow range, gold has finally broken through the main descending trendline extending from the peak of 4,108 USD.
Buyers are currently controlling the short-term structure by continuously creating BoS (Break of Structure) in the price range of 3,965 – 3,980 USD.
The Order Block 3,970 – 3,975 USD area has become an important dynamic support zone , converging with the newly formed trendline.
If the price continues to hold above this area, there is a high possibility of a light retest to absorb liquidity before breaking out to higher resistance zones.
Above, the Resistance 4,028 USD zone is the first barrier to overcome to confirm the medium-term uptrend, while the Liquidity Zone around 4,070 – 4,080 USD is the extended target of the breakout.
💎 Key Technical Zones
• Order Block (Support): 3,970 – 3,975 USD → potential retest area.
• Resistance Zone: 4,028 USD → first profit-taking point for buyers.
• Liquidity Zone: 4,070 – 4,080 USD → extended target if resistance is successfully broken.
🎯 Trading Scenarios
1️⃣ BUY Scenario – Retest OB:
If the price adjusts to the 3,970 – 3,975 USD area and a confirming candle signal appears (bullish rejection / engulfing):
• Entry: 3,972 – 3,975
• SL: 3,960
• TP1: 4,015
• TP2: 4,028
• TP3: 4,070
→ Prioritize trading with the trend after the uptrend structure is confirmed.
2️⃣ SELL Scenario – Reaction at Resistance:
If the price hits the 4,028 – 4,070 USD area and there is a strong reversal signal:
• Entry: 4,045
• SL: 4,065
• TP1: 4,015
• TP2: 3,985
→ Short-term scalp, only activate if a clear rejection signal appears.
🧠 Vincent’s View
Gold is showing signs of transitioning from accumulation to range expansion .
Breaking the descending trendline is the first signal for a new upward move, as long as the OB 3,970 area remains intact.
Buyers can take advantage of pullbacks to increase their position, targeting 4,070 USD – where significant liquidity converges above.
“Break the line, respect the retest — that’s where smart money joins the move.” ⚜️
⏰ Timeframe: 1H
📅 Updated: 07/11/2025
✍️ Analysis by: Captain Vincent

XAUUSD Eyes 4000$ Breakout as Accumulation Phase Near Completion🔍 Market Context
After a week of sideways consolidation within a broad range, gold (XAU/USD) is showing the first signs of structural recovery.
The market is gradually carving a potential short-term bottom, hinting that the corrective phase may be ending — and a breakout from the range could be imminent.
Despite the lack of new macro catalysts, sentiment remains underpinned by renewed safe-haven flows and expectations that the Fed will maintain its easing stance through early 2026.
Traders are now watching closely whether the 4,000$ handle will finally give way — a key inflection zone that could trigger aggressive momentum buying if reclaimed.
📊 Technical Structure (H1–H4)
Gold is currently trading above the intraday demand zone 3,969$–3,982$, maintaining a short-term bullish structure while compressing under resistance.
The descending trendline and Fibo confluence near 4,019$–4,048$ act as the next critical reaction area for breakout confirmation.
Key Technical Zones:
• 💎 Demand Zone: 3,969$ – 3,982$ (liquidity base + ascending trendline confluence)
• 🎯 Primary Resistance: 4,019$ – 4,048$ (trendline + Fibo 1.272/1.618)
• ⚙️ Bullish Target: 4,046$ → 4,052$ → 4,090$ (extended range liquidity)
• ⚠️ Invalidation: Below 3,960$ → risk of a deeper correction toward 3,940$.
🎯 MMFLOW Outlook
Smart money appears to be absorbing liquidity within the 3,970$ zone, suggesting accumulation before expansion.
If gold can break and sustain above 4,000$, the bias flips decisively bullish — opening the door for a range expansion toward 4,050$+.
This could mark the beginning of a new impulse phase following weeks of compression.
⚜️ MMFLOW Insight:
“When volatility sleeps, liquidity quietly builds the next trend.”
