XAUUSD Gold Trading Strategy September 12, 2025XAUUSD Gold Trading Strategy September 12, 2025: Gold rebounded strongly, fully supported by US economic data and trend technical conditions.
Fundamental news: On Thursday (September 11) in the New York trading session, gold prices fluctuated strongly due to the influence of the US CPI index and initial data on unemployment claims. Gold prices recovered strongly in today's Asian session and are currently trading at $3,650/oz.
Technical analysis: Gold prices increased sharply after the CPI news was released. Currently, gold prices have increased sharply but are still fluctuating in the 3,600 - 3,660 range and there are no signs of a breakout. We still prioritize trading according to the main trend and waiting for trading at the confluence of MA and FVG.
Important price zones today: 3635 - 3640, 3600 - 3605 and 3660 - 3665.
Today's trading trend: BUY.
Recommended orders:
Plan 1: BUY XAUUSD zone 3635 - 3637
SL 3632
TP 3640 - 3650 - 3660 - 3690.
Plan 2: BUY XAUUSD zone 3600 - 3602
SL 3597
TP 3605 - 3615 - 3635 - 3665 - OPEN.
Plan 3: SELL XAUUSD zone 3663 - 3665
SL 3668
TP 3660 - 3650 - 3640 - 3630. (small volume).
Wish you a successful, effective and profitable weekend trading day.🌟🌟🌟🌟🌟
Supportandresistancezones

Tata Elxsi | Volume Breakout with Key Supports & Resistances📌 Tata Elxsi Ltd. – Closing Price: ₹5,843.50
📊 Technical Indicators Explained
Tata Elxsi is showing strong technical signals. A 20-day volume breakout 🚀 suggests big participation from traders, while a Bullish Marubozu candle 🔥 confirms strong buying momentum. The stock is clearly building momentum 💹, with possible target zones 🎯 based on Fibonacci levels. A short-term setup 📈 is visible as momentum indicators turn positive. The RSI breakout ⚡ shows renewed strength, and both SuperTrend and VWAP 🟢 are aligned on the bullish side, further adding confidence to the current breakout.
________________________________________
📈 Bullish Case – Why the stock could go up
Strong Bullish Marubozu Candle indicates momentum revival.
Breakout supported by high volumes – sign of institutional interest.
RSI & VWAP trending positive, confirming strength.
Fibonacci levels indicate potential upside zones towards ₹6,300 – ₹7,250+.
📉 Bearish Case – Potential downside risks
Any failure to sustain above ₹5,770 could trigger profit booking.
Broader market weakness or sector sentiment may weigh.
A break below ₹5,500 would weaken the bullish structure.
⚡ Momentum Case – Short-term Trading Edge
20-Day Volume Breakout highlights strong trader participation.
RSI breakout + SuperTrend signal indicate momentum strength.
Sustaining above ₹5,900–₹6,000 may lead to further positive movement towards higher levels.
📊 Support & Resistance Levels
Resistance Zones: ₹5,939 | ₹6,034.5 | ₹6,209
Support Zones: ₹5,399 | ₹5,494.5 | ₹5,669
📅 Short-term vs. Long-term Perspective
Short-term: Key resistance zones to watch are around ₹6,200 – ₹6,735, while support lies near ₹5,500.
Long-term: The stock remains in a structural uptrend. Any dip towards ₹5,200–₹5,400 may act as accumulation zones for investors with a longer horizon.
✅ Conclusion: Tata Elxsi has shown a strong breakout backed by volume & momentum.
👉 The stock is at an important juncture — while short-term traders may track key momentum levels, long-term investors can view dips as opportunities within the broader uptrend.
⚠️ Disclaimer – Please Read Carefully
The information shared here is meant purely for learning and awareness. It is not a buy or sell recommendation and should not be taken as investment advice. I am not a SEBI-registered investment advisor, and all views expressed are based on personal study, chart patterns, and publicly available market data.
Trading — whether in stocks or options — carries risk. Markets can move unexpectedly, and losses can sometimes exceed the money you have invested. Past performance or past setups do not guarantee future results.
If you are a beginner, treat this as a guide to understand how the market works — practice on paper trades before risking real money. If you are experienced, always assess your own risk, position sizing, and strategy suitability before entering trades.
Consult a SEBI-registered financial advisor before making any real trading decision. By engaging with this content, you acknowledge full responsibility for your trades and investments.
💬 Found this useful?
🔼 Give this post a Boost to help more traders discover clean, structured learning.
✍️ Drop your thoughts, questions, or setups in the comments — let’s grow together!
🔁 Share with fellow traders and beginners to spread awareness.
👉 “If you liked this breakdown, follow for more clean, structured setups with discipline at the core.”
🚀 Stay Calm. Stay Clean. Trade With Patience.
Trade Smart | Learn Zones | Be Self-Reliant 📊

XAUUSD Gold Trading Strategy September 10, 2025XAUUSD Gold Trading Strategy September 10, 2025: Gold stabilized after falling from yesterday's new high, the market will focus on US inflation data in the final period of the week from today.
Fundamental news: Investors will now turn their attention to US inflation data, scheduled for release on Wednesday and Thursday. Inflation data will be of particular interest following weak employment data ahead of the Federal Reserve's monetary policy announcement next week.
Technical analysis: After gold prices made a new all-time high at $3,675/ounce, prices corrected to the 362x area and increased again as we predicted earlier. The MA lines still maintain support for the price, however, yesterday's correction has reduced the previous strong increase. We continue to trade according to the main trend: waiting for a trading point at the support area combined between MA and FVG. In addition, the next profit-taking phase may occur unexpectedly, to avoid this risk we must ensure to maintain the trading principle.
Important price zones today: 3615 - 3620, 3595 - 3600 and 3660 - 3665.
Today's trading trend: BUY.
Recommended orders:
Plan 1: BUY XAUUSD zone 3615 - 3617
SL 3612
TP 3620 - 3630 - 3650 - 3660.
Plan 2: BUY XAUUSD zone 3595 - 3597
SL 3592
TP 3600 - 3610 - 3630 - 3660.
Plan 3: SELL XAUUSD zone 3663 - 3365
SL 3668
TP 3660 - 3650 - 3630 - 3600. (small volume).
Wish you a safe, effective and profitable trading day.💯💯💯💯💯

NZDUSD Forming a Great Sell side scenario....NZDJPY is approaching 4H resistance zone, which has already show rejection previously. There is also a steep bullish trend line creating a confluence. There is a valid 4H FVG at upside. All these things signalling a coming very good sell side opportunity. Below are points detailing the same.
1. Price is approaching 4H resistance zone. Which may act as a strong supply zone.
2. Very steep Bullish Trend line developing a confluence at resistance. Steep trend line is always prone for breakout/breakdown.
3. Most probably price will take liquidity of resistance zone and break trend line.
4. After breaking trend line it should pullback till resistance/trend line or any newly created OB/FVG.
5. There are two possible reversal point 1. At nearest resistance. 2. At 4H FVG and higher trendline.
All these combinations are signalling a high probability and high Risk and Reward (1:8) trade scenario.
Note – if you liked this analysis, please boost the idea so that other can also get benefit of it. Also follow me for notification for incoming ideas.
Also Feel free to comment if you have any input to share.
Disclaimer – This analysis is just for education purpose not any trading suggestion. Please take the trade at your own risk and with the discussion with your financial advisor.

XAUUSD Gold Trading Strategy September 3, 2025XAUUSD Gold Trading Strategy September 3, 2025: Gold prices are stable, heading towards the $3,550 mark with ETF capital flows boosting and the market is also waiting for employment data and developments from the FED.
Basic news: Spot gold prices remained stable in today's Asian trading session, after rising sharply in the previous session. The current international gold price is around $3,531/ounce, according to CMC Group's FedWatch Tool, the market is pricing in nearly 92% of the possibility that the Fed will cut 25 basis points at the meeting on September 17.
Technical analysis: Spot gold prices continue to increase strongly. The rising price channel remains. Currently, the MA lines and the Fib frame are still very good support areas for prices, however, the RSI is in the overbought area; we should be careful that prices will have a correction first and then increase again. We limit FOMO, continue to wait at support zones combined between MA, Fib and FVG zone.
Important price zones today: 3500 - 3505 and 3475 - 3480.
Today's trading trend: BUY.
Recommended orders:
Plan 1: BUY XAUUSD zone 3500 - 3502
SL 3497
TP 3505 - 3515 - 3530 - 3550.
Plan 2: BUY XAUUSD zone 3475 - 3477
SL 3472
TP 3480 - 3490 - 3500 - 3530.
Wish you a safe, effective and profitable trading day.💯💯💯💯💯

Simple Support & Resistance Strategy on XAUUSDThis chart illustrates a simple but effective support and resistance trading approach.
Support Levels:
Support 1: Acts as a key demand zone where buyers may step in if price revisits this area.
Support 2: A minor intraday support that can provide short-term bounce opportunities.
Resistance Levels:
Resistance 1: The broader supply zone where sellers previously pushed price lower.
Resistance 2: A closer level that may act as a barrier for short-term upward moves.
What’s Happening:
Currently, price has broken below Support 2 and is testing downward momentum. Two possible scenarios are highlighted:
Price retests Support 1, holds, and then bounces back toward Resistance 2.
Price fails to hold at Support 1, leading to further downside continuation.
Probability Outlook:
If buyers defend Support 1 strongly, probability favors a bounce toward Resistance 2.
If Support 1 breaks with volume, probability favors a bearish continuation move to lower levels.
This setup shows how simple zone-to-zone trading can provide clear potential paths without overcomplication.
👉 Always remember: This is not financial advice, but an educational demonstration of support/resistance principles.

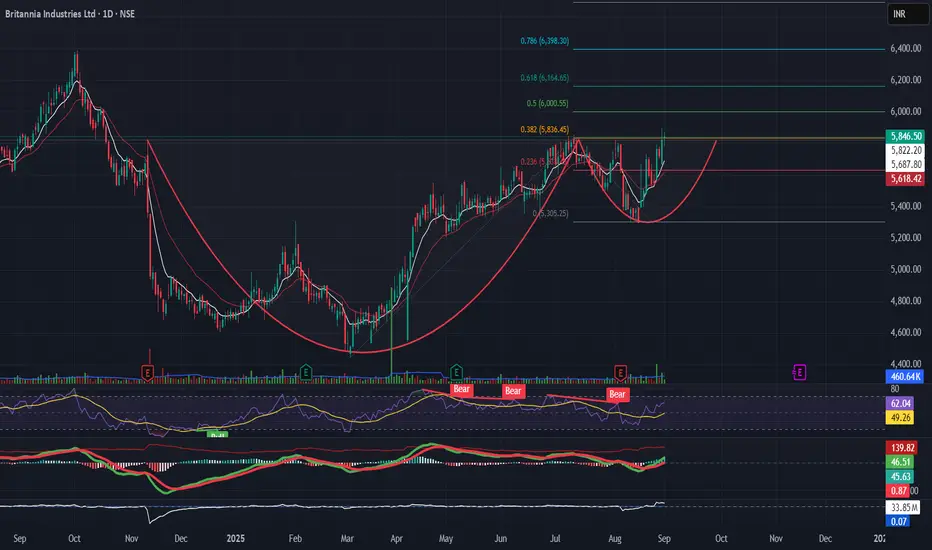
Cup and Handle pattern in Britannia Britannia is ready to breakout from cup and handle pattern
" Right now Britannia is at critical ₹5,836 resistance.
A breakout above this level can extend the rally toward ₹6,000–₹6,165.
Support at ₹5,680.
📊 Sector: FMCG (aligned with consumption strength)"
Britannia is retesting the ₹5,836 Fib resistance (0.382) after forming a cup-like base. Momentum indicators (RSI > 60, MACD improving) support potential breakout.
High risk and reward buying opportunity in BTCBTC selling has gone slow and showing indication or reversal at both HTF H4 and LTF 15m. The may generate a good high risk and reward scenario.
Below are variables support it.
1. Almost a day long consolidation is going on. And BTC is moving in very small range at 4H support level.
2. 4H candles have made few rejection candles.
3. 15m trend line created a green box (fake out) scenario.
4. Price may hit 15m FVG or swing low just below FVG and more upside.
5. RSI has already developed divergence in 15m.
6. We may have another opportunity once price breaks next resistance and pulls back to breakout levels.
P.S. – This is just analysis not any recommendation for trade. Feel to comment and raise your query.

Reversal trade in BTCBTC seems taking reversal on 4H chart after creating a W pattern, breaking it, pull back and move in the direction.
it may high RnR trade.
P.S. - this is just a technical analysis not a trade advice.

1H USDCHF reversal buy tradeHere is a good opportunity in USDCHF 1 hour time frame. Price has returned to the confluence of trendline and resistance of W.
there my be and opportunity if price show rejection at this confluence and supported with value.
this may be a good and high RnR opportunity if things move as per plan.

Part 2 Support ans ResistanceAdvantages of Options
High leverage (small money → big exposure).
Flexibility (profit in up, down, or sideways markets).
Risk defined for buyers (can lose only premium).
Useful for hedging portfolios.
Risks of Options
Time decay: Value decreases as expiry approaches.
High leverage can cause big losses (especially for sellers).
Complexity: Needs knowledge of Greeks, volatility, etc.
Emotions: Options move fast → fear & greed affect traders.
Options Greeks (Advanced but Important)
The “Greeks” help measure how option prices move with market factors:
Delta → Change in option price vs stock price.
Gamma → Rate of change of Delta.
Theta → Time decay (how much premium falls daily).
Vega → Impact of volatility on premium.
Rho → Impact of interest rates.
👉 Example: If an option has Theta = -10, it means the premium will lose ₹10 per day (if all else same).

BTCUSD Weekly – Supply Pressure vs Key Support (110K in Focus)On the weekly timeframe, BTC is trapped between major supply (117K–119K) and key support (110K–112K).
Supply Zone: Price has faced multiple rejections near 117K–119K, showing strong seller presence.
Order Block/Resistance: The yellow zone around 113K is acting as an active selling area, preventing BTC from reclaiming higher ground.
Support Zone: BTC is currently testing the 110K–112K support zone. If this level holds, we could see another attempt to reclaim 113K.
Scenarios:
1. Bullish Breakout (less likely unless strong volume appears):
Needs to reclaim 113K and break above 119K.
Target zone → 126K–134K.
Stop loss for longs → below 110K.
2. Bearish Breakdown (higher probability if 110K fails):
If 111K–110K zone breaks, BTC likely retests the 103K–106K demand zone.
If that fails → extended move possible toward 97K.
Stop loss for shorts → above 113.5K.
Bias: Neutral to Bearish unless BTC reclaims 113K with strong volume.

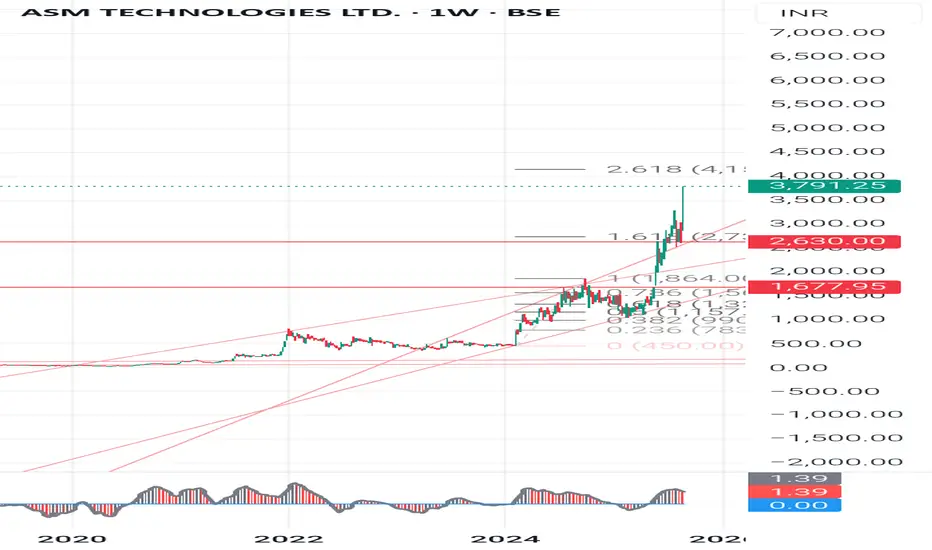
Stock Analysis: Asm technologies ASM Technologies Ltd.- technical chart and fundamentals for student learnings.
Technical & Chart Pattern Analysis (Weekly Chart)
Current Price (CMP): 1,520
Recent Move: Sharp rally from -500 in mid-2024 to a peak of -3,800 (multi-bagger move within months).
Chart Pattern Observations
1. Parabolic Rally: Price rose almost vertically - unsustainable in the short term - healthy correction likely.
2. Strong Resistance Zones:
-1,675 (immediate resistance & supply zone)
-2,630 (major resistance, recent support turned resistance)
-3,800 (swing top, all-time high)
3. Strong Support Zones:
-1,450-1,500 (immediate support, CMP zone)
- 1,250 (next support)
- 950 (major strong support, base of previous rally)
4. Candlestick Observations:
The last few weekly candles show long wicks at the top - profit booking and selling pressure.
Current trend shows bearish engulfing signals near top - short-term correction expected.
🎯Perfect Entry Points for Swing / Positional
Safe Accumulation Zone: 1,250-1,450 (near support, risk-reward favorable).
Aggressive Buy Zone: 1,650-1,700 (if stock reclaims and sustains above with volume).
Breakout Zone for Big Upside: 2,650+ weekly close - can attempt 3,200-3,800 again.
Swing Analysis:
Stock is in post-parabolic correction - Expect sideways consolidation between 1,250-2,000 for some weeks/months.
Good for gradual SIP-style accumulation instead of lump sum buy.
Fundamental Snapshot (ASM vs Competition)
Metric (FY24-25) ASM Technologies Tata Elxsi KPIT Tech L&T Tech
Market Cap -800 Cr -55,000 Cr -30,000 Cr -55,000 Cr
PE Ratio -60+ (very high) -75 -65 -55
Debt/Equity Low (Good) Low Low Low
Revenue Growth (3Y CAGR) High (-30-35%) -18% -20% -15%
Profit Margins 8-10% 20%+ 15-18% 15-20%
Dividend Yield Nil 0.8% 0.5% 0.7%
👉 Observation:
ASM is a small-cap, high-growth, high-risk IT engineering services company.
Valuation is stretched (like peers) but earnings base is tiny compared to Tata Elxsi or KPIT.
High volatility due to low liquidity in stock.
Key Learnings for Students
1. Parabolic moves always correct - don’t chase at top, wait for pullbacks.
2. Support & Resistance levels guide entry/exit - better risk-reward at support zones.
3. Volume + Candlestick confirmation is important before entering.
4. Fundamentals matter in long run - Always check PE ratio, debt levels, margins, and growth.
5. Small-cap IT can give multibaggers but carry high volatility - only invest money you can hold for 3-5 years.
👉Disclaimer:
This analysis is for educational purposes only. Not a SEBI-registered advisory. Please consult your financial advisor before making any investment/trading decision.
#ASMTechnologies #StockAnalysis #SwingTrading #ChartPatterns #SupportResistance #CandleStickAnalysis #TechnicalAnalysis #FundamentalAnalysis #InvestingForBeginners #StockMarketEducation #MultibaggerStocks #LongTermInvesting
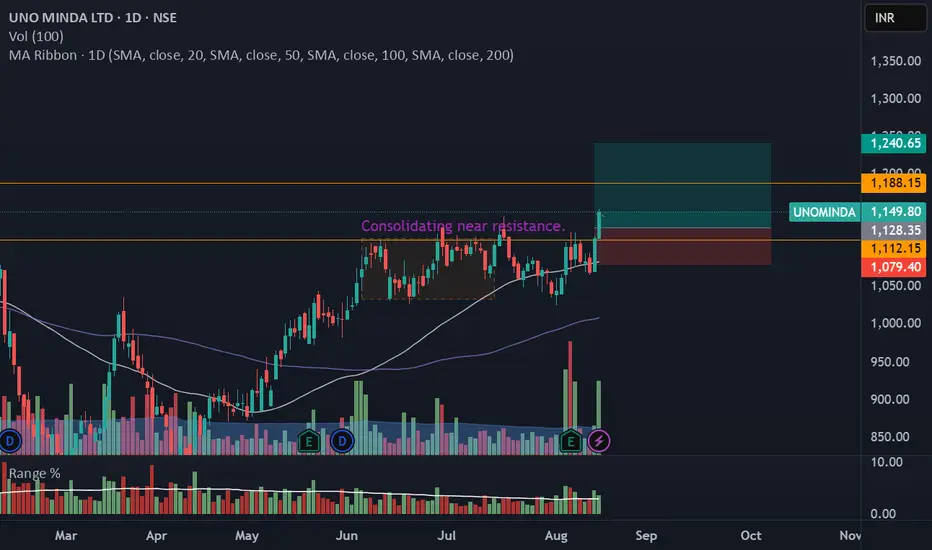
UNOMINDA – Daily Timeframe Breakout Idea (Resistance Zone Break)UNO MINDA LTD. has shown a breakout above a key horizontal resistance level on the daily chart, accompanied by a nearly 1.5 times volume surge near the breakout, as seen earlier, supported by strong momentum.
🔍 Breakout Context:
- Price broke above the ~₹1110 and 1120 horizontal resistance, which had held for over 6 months.
- Breakout supported by more than average volume and just above average range near the resistance zone.
- The price is also trading above both the 50- and 100-day SMAs, indicating strong trend continuation.
- This aligns with a bullish continuation setup.
📉 Trade Plan:
- CMP: ₹1149
- Entry: Near ₹1128
- Target: ₹1240 (~10% upside from CMP)
- Stop-Loss: ₹1079 (Closing Candle)
- Risk-Reward Ratio: ~1 : 2.2
"BTC Hits Premium Zone – Is $117K the Next Stop?""BTC Hits Premium Zone – Is $117K the Next Stop?"
Bitcoin has rallied into the $121,000–$123,000 resistance zone, aligning with a Fair Value Gap (FVG) and a Breaker Block, both of which are high-probability reversal points in Smart Money Concepts (SMC). This region represents a premium pricing area, where institutions often take profits and trigger retracements.
Key Observations:
Liquidity Sweep: Prior highs have been taken, potentially fulfilling buy-side liquidity objectives.
Breaker Block Resistance: Price is currently reacting to this zone, indicating sellers stepping in.
Fair Value Gap: The unfilled imbalance between $121,000–$123,000 is acting as a short-term supply area.
Projected Retracement: A move down toward $117,000 is anticipated, coinciding with prior structure support and a liquidity pocket.
Technical Levels:
Resistance Zone: $121,000–$123,000
Target Zone: $117,000 (first key support)
Major Support: $112,000–$113,000 range
Bias: Short-term bearish toward $117,000 before potential continuation, unless price closes strongly above $123,000, invalidating the reversal thesis.

"Gold at the Tipping Point: Will $3,350 Spark the Next Rally?""Gold at the Tipping Point: Will $3,350 Spark the Next Rally?"
Gold (XAUUSD) is currently consolidating after a series of higher lows, signaling sustained bullish momentum from the strong support region around $3,280–$3,300. Price has respected key structural points, forming a clean market structure with:
BOS (Break of Structure) confirming bullish intent after reclaiming prior resistance.
Bullish FVG (Fair Value Gap) acting as a liquidity zone for potential re-entries.
Multiple Higher Lows, highlighting strong buyer defense levels.
The chart indicates a possible short-term retracement into the $3,350–$3,357 entry zone, which aligns with demand structure. From this zone, buyers are expected to push toward the $3,400–$3,415 resistance target.
Key technical levels:
Entry Zone: $3,350–$3,357 (demand area)
Stop Loss: Below $3,340 to protect against deeper pullbacks
Take Profit: $3,400 psychological level and $3,414 structural resistance
Market Sentiment:
The combination of a strong support base, sustained higher lows, and bullish imbalance zones suggests a favorable risk–reward setup for long positions. A clean breakout above $3,415 could trigger a larger bullish leg toward the $3,440 resistance zone.
📈 Bias: Bullish above $3,350
💡 Watch for a reaction at the entry zone before committing to positions.

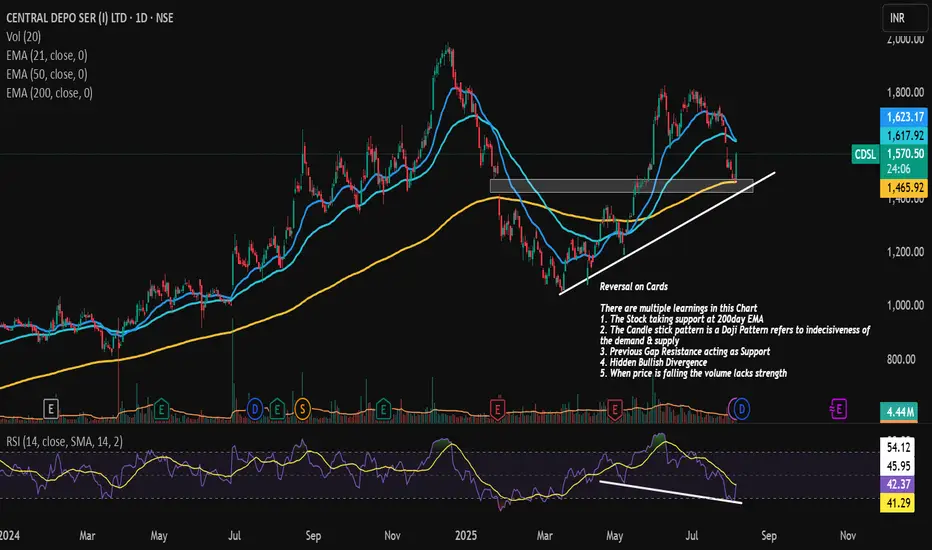
CDSL Reversal !!!CDSL is on the verge or Reversal or Temporary Pull back
There are multiple learnings in this Chart
1. The Stock taking support at 200day EMA
2. The Candle stick pattern is a Doji Pattern refers to indecisiveness of the demand & supply
3. Previous Gap Resistance acting as Support
4. Hidden Bullish Divergence
5. When price is falling the volume lacks strength
GBPCHF – Could This Be the Start of a Bullish Comeback?Looking at GBPCHF right now, it feels like the market is finally speaking my language.
After an extended downtrend, price has landed on a major support zone visible on the higher timeframes — a zone that’s been tested and respected multiple times before. We're now seeing early signs of rejection from that area, and I’m eyeing a potential move back up toward 1.1000.
What makes this setup stand out isn’t just the technicals — it’s the patience behind the play. I waited for the sell-off to complete, for price to return to a proven zone, and now I’m watching for signs of strength to kick in. This type of setup? I’ve seen it play out time and time again in my previous chart work.
Drop your thoughts in the comments — do you see the same potential, or are you taking a different side of the trade?

XAUUSD Gold Trading Strategy August 1, 2025:
Yesterday's trading session, gold prices recovered to the 3315 area and then continued to decrease to the 3281 area. Currently, gold prices are fluctuating quite unpredictably due to the impact of tariff news and investor confidence.
Basic news: The Federal Reserve FED continues to maintain the federal funds benchmark interest rate in the range of 4.25% - 4.50%, in line with policy since 2025. Chairman Powell did not give any signal about the next interest rate cut on September 16 - 17.
Technical analysis: After falling sharply to the 3269 area, gold prices are showing signs of recovery. In the current downtrend channel, there has been a higher bottom than the bottom at H1. We can see that if the bullish pattern at H1 is confirmed, combined with the reversal candlestick appearing at H4, the possibility of gold bouncing back to reach the resistance area of 3330, even 3350 is completely possible. In the weekend trading session, we will wait at the support zones to trade.
Important price zones today: 3280 - 3285 and 3269 - 3274.
Today's trading trend: BUY.
Recommended orders:
Plan 1: BUY XAUUSD zone 3283 - 3285
SL 3280
TP 3288 - 3300 - 3310 - 3330.
Plan 2: BUY XAUSD zone 3269 - 3271
SL 3266
TP 3274 - 3284 - 3300 - 3320.
Wish you a safe, favorable and profitable trading day.🥰🥰🥰🥰🥰

Gold Trading Strategy XAUUSD July 31, 2025Yesterday's trading session, after breaking the rising price channel in the 3318 - 3320 area, the gold price fell sharply to the 3269 area.
Basic news: US Treasury yields fell and the weak US labor market report could boost investor demand. Data released by the US Department of Labor on Tuesday showed that the number of new jobs fell in June after 2 consecutive months of increase. Today, the Federal Reserve will announce a new interest rate decision.
Technical analysis: The rising price channel in the H1 frame was broken, and the gold price immediately fell sharply. Currently, the downtrend of gold is still maintained. The MA lines are still resistance for gold prices.
Important price zones today: 3300 - 3305, 330 - 3325 and 3267 - 3272.
Today's trading trend: SELL.
Recommended orders:
Plan 1: SELL XAUUSD zone 3303 - 3305
SL 3308
TP 3300 - 3290 - 3280 - 3270.
Plan 2: SELL XAUUSD zone 3323 - 3325
SL 3328
TP 3320 - 3310 - 3290 - 3280.
Plan 3: BUY XAUUSD zone 3267 - 3269
SL 3264
TP 3272 - 3282 - 3292 - 3302 (small volume).
Wish you a safe, favorable and profitable trading day.🌟🌟🌟🌟🌟

BTC Took Support – Big Move from Demand Zone Expected!🚀 BTC Took Support – Big Move from Demand Zone Expected!
Bitcoin (BTC/USD) has touched the demand zone and now showing signs of upside reversal. After taking out sell-side liquidity, price is getting ready for a bullish push toward higher targets.
📊 Technical Analysis:
🟤 Demand Zone (115,000 – 116,000):
Market came down and respected this zone. This is a strong area where buyers entered again.
🧲 Sell-Side Liquidity Grab:
Price formed equal lows, then broke them to collect liquidity before reversing — typical smart money behavior.
🔁 Break of Structure (BOS):
Structure break confirmed that trend might reverse now from bearish to bullish.
🟪 Fair Value Gap (FVG):
A clean FVG is also visible near the top side, and price may move to fill this imbalance.
🎯 Target: 119,000 USD:
If bulls hold the demand zone, BTC can easily move towards this resistance area. This is the short-term upside target.
📚 Key Learning Points:
Liquidity was collected below equal lows
Buyers stepped in from the demand zone
Break of structure confirms bullish pressure
FVG + Resistance area aligns with target
✅ Conclusion:
As long as BTC holds above 116,000, bulls are in control. This is a good zone for long entries, with a target near 119,000. Traders should watch for confirmation with minor BOS or strong bullish candles.

"BTC’s Liquidity Grab: Is the Bull Ready to Charge?"🧠 Key Observations:
Break of Structure (BOS):
Multiple BOS levels confirm shifts in market structure from bullish to bearish and back.
The latest BOS near the support zone suggests a possible shift from bearish to bullish trend.
Support & Resistance Zones:
Resistance marked near the 120,241 level, which is also the target zone.
Support is clearly respected around the 114,898 level with price reacting strongly near the equal lows.
Liquidity Hunt:
Price swept the sell-side liquidity below the equal lows around 114,000 and bounced.
This indicates smart money might have collected liquidity before pushing the price higher.
Bearish FVG (Fair Value Gap):
A bearish imbalance around the 117,000 zone acted as a resistance during the previous rally.
Price might revisit this area for a mitigation before continuation to the upside.
Volume Profile (left side):
High volume nodes indicate significant trading interest in that region, confirming key price acceptance zones.
🎯 Expected Move:
If price sustains above the support zone and confirms bullish intent with higher highs, we may see a move towards the target at 119,637 – 120,241 zone.
📌 Conclusion:
Market has potentially formed a liquidity grab and BOS, signaling a bullish reversal. If this structure holds, BTCUSD could target the resistance area. However, if the price breaks below 114,000 again, it might invalidate this bullish setup.
