KSH International cmp 1072.30 Daily Chart since listedKSH International cmp 1072.30 Daily Chart since listed
Support Zone 930 to 1040 Price Band
- Resistance Zone 1080 to ATH 1198 Price Band
- Breakout from Resistance Trendline seems sustained
- Price traversing along the High High Higher Low channel
- Support Zone tested retested while facing Resistance rejection
- Volume in sync with avg traded qty indicating a balanced demand
- IF .... Price Breaks Out from Resistance Zone, expect a fresh uptrend
Supporttesting
V-Mart Retail cmp 809.40 Daily ChartV-Mart Retail cmp 809.40 Daily Chart
- Support Zone 715 to 785 Price Band
- Resistance Zone 825 to 900 Price Band
- Cup and Handle under Resistance neckline
- Volumes needed for a fresh price momentum
- Resistance Trendline Breakout seems sustained
- Price shouldering along Rising Support Trendline
- Support Zone seems tested retested before Breakout
Syrma SGS Tech cmp 1465.20 Daily ChartSyrma SGS Tech cmp 1465.20 Daily Chart
- ATH 1543 is the only Resistance
- Support Zone 1350 to 1450 Price Band
- Resistance Trendline breakout attempted
- 1st dashed Resistance Trendline acting as Support
- Rising Support Trendline shouldering trending price
- Steady Volumes are indicative of decent accumulation
Vedanta cmp 283 Daily ChartVedanta cmp 283 Daily Chart
- Support Zone 260 to 2755 Price Band
- Resistance Zone 285 to 300 Price Band
- Cup & Handle made around Support Zone
- Volumes in good good sync of avg traded qty
- Support Zone strength indicates uptrend probability
- Price is shouldering along the Rising Support Trendline
- 1st Breakout Resistance Trendline done, 2nd is attempted
- Price trending along High Higher High Lower High closure
Sanghvi Movers cmp 488.40 Weekly ChartSanghvi Movers cmp 488.40 Weekly Chart
- Support Zone 375 to 445 Price Band
- Resistance Zone 485 to 570 Price Band
- Repeat Cup & Handle around Support Zone
- Volumes spiked with good sync of avg traded qty
- Support Zone strength testing & retesting ongoing
- Price shouldering along the Rising Support Trendline
- 1st Breakout Resistance Trendline done, 2nd attempted
- Volumes spiking above avg trade qty over past few weeks
Ddev Plastiks cmp 289.90 Weekly ChartDdev Plastiks cmp 289.90 Weekly Chart
- Support Zone 195 to 280 Price Band
- Resistance Zone 310 to 400 Price Band
- Rounding Bottom by Resistance Zone neckline
- Volumes are seen in good sync of avg traded qty
- Falling Resistance Trendline Breakout is progressive
- Support Zone strength checked by testing & retesting
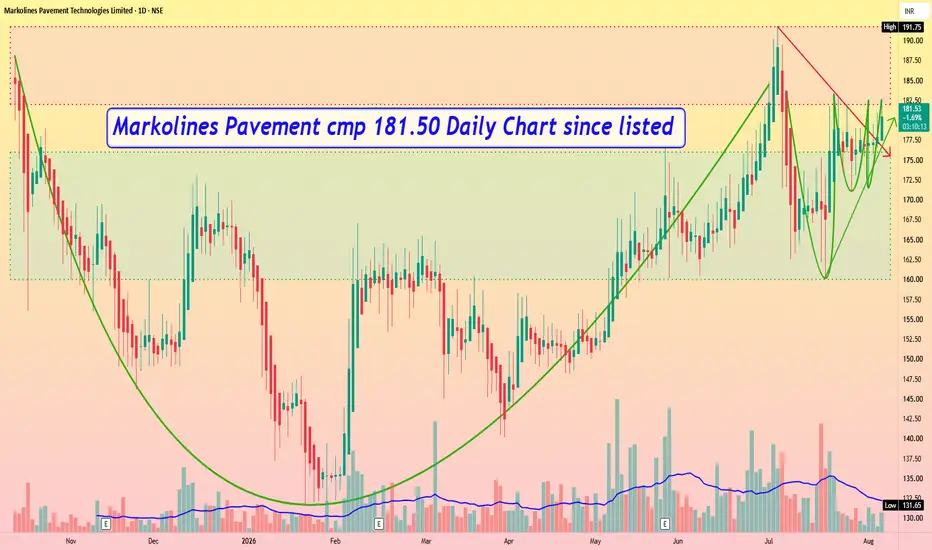
Markolines Pavement cmp 181.50 Daily Chart since listedMarkolines Pavement cmp 181.50 Daily Chart since listed
Support Zone 160 to 176 Price Band
- Resistance Zone 182 to ATH 191.75 Price Band
- Long Rounding Bottom + Small Rounding Bottoms
- Closely Considerate VCP pattern seems to be made
- Price breakout been attempted from Resistance Zone
- Falling Resistance Trendline Breakout seen well sustained
- Volumes needed for breakout through the Resistance Zone
Samhi Hotels cmp 174.30 Weekly Chart since listedSamhi Hotels cmp 174.30 Weekly Chart since listed
- Support Zone 152 to 172 Price Band
- Resistance Zone 178 to 200 Price Band
- Support Zone seems to be tested retested
- Breakout done from Falling Resistance Trendline
- Price attempting to Breakout from Resistance Zone
- Price crossing Resistance Zone may give fresh upside
IndusInd Bank cmp 975.65 Weekly ChartIndusInd Bank cmp 975.65 Weekly Chart
- Support Zone 790 to 890 Price Band
- Resistance Zone 985 to 1085 Price Band
- Regular Volumes spike above avg traded qty
- Bullish Rounding Bottoms + Cup & Handle formed
- Breakout from 1st Resistance Trendline seems stable
- Breakout form 2nd Resistance Trendline seen attempted
- Support Zone tested retested, retracing under Resistance Zone
Pix Transmissions cmp 1796.10 Daily ChartPix Transmissions cmp 1796.10 Daily Chart
- Support Zone 1600 to 1750 Price Band
- Resistance Zone 1850 to 2000 Price Band
- Volumes spiked heavily on Friday by demand
- Rounding Bottoms formed under Support Zone
- Tight VCP pattern formed around the Support Zone
- Support Zone testing retesting ongoing by momentum
- Breakout of 1st Falling Resistance Trendline, 2nd progressive
Piramal Pharma cmp 168 Weekly Chart since listedPiramal Pharma cmp 168 Weekly Chart since listed
- Support Zone 135 to 160 Price Band
- Resistance Zone 180 to 205 Price Band
- Volumes by both demand and supply side
- Support Zone tested retested before breakout
- Falling Resistance Trendline needs breach for uptrend
Triveni Engr cmp 395.55 by Weekly Chart viewTriveni Engr cmp 395.55 by Weekly Chart view
- Support Zone 345 to 375 Price Band
- Resistance Zone 415 to 445 Price Band
- Price attempting repeat reversal from Support Zone
- Falling Resistance Trendlines Breakout getting sustained
- Bullish Rounding Bottoms made around Support Zone area
Medplus Health Services cmp 814.85 by Weekly Chart view since liMedplus Health Services cmp 814.85 by Weekly Chart view since listed
- Support Zone 720 to 780 Price Band
- Resistance Zone 865 to 915 Price Band
- Next Resistance Zone 975 to 1045 Price Band
- Stock Price unable to Break 2nd Resistance Zone
- Support Zone well tested retested on Daily Chart view
- Volumes need improvement been below the avg traded qty
- Bullish Rounding Bottoms retraced at 2nd Resistance Zone neckline
NSDL cmp 1081.40 by Daily Chart viewNSDL cmp 1081.40 by Daily Chart view
- Support Zone 1040 to 1085 Price Band
- Resistance Zone 1135 to 1185 Price Band
- Bullish Triple Bottom at 1037 to 1049 Price Band
- Volumes flattish and under average traded quantity
- Price trending within Support Zone thru December 2025
- Falling Resistance Trendline Breakout seems taking process
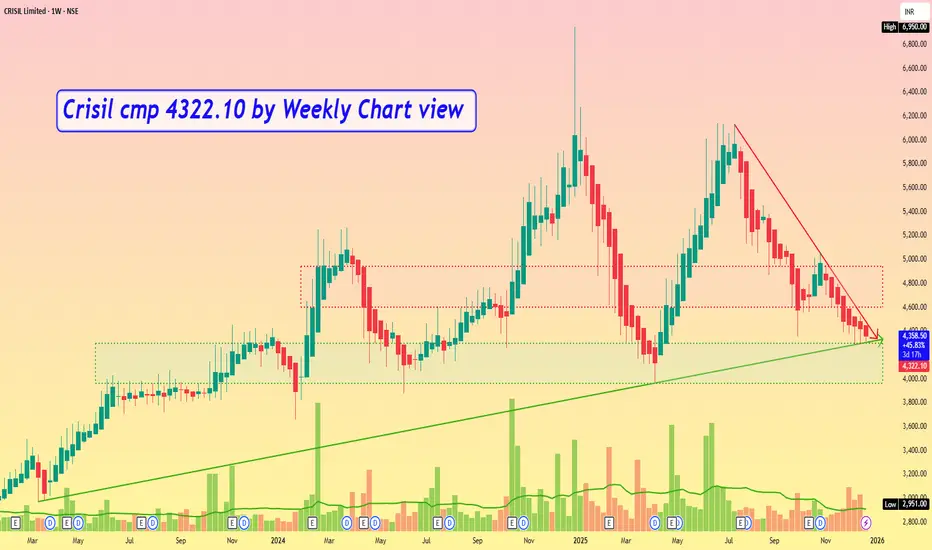
CRISIL cmp 4322.10 by Weekly Chart viewCRISIL cmp 4322.10 by Weekly Chart view
- Support Zone 3960 to 4300 Price Band
- Resistance Zone 4600 to 4940 Price Band
- Support Zone tested retested for 3rd week now
- Rising Support Trendline seems to be well respected
- Volumes are keeping well above average traded quantity
- Continued Selling but Buying keeps Price above Support Band
- Price reversal from Support Zone maybe in making by Chart Status
Kirloskar Brothers cmp 1647.20 by Daily Chart viewKirloskar Brothers cmp 1647.20 by Daily Chart view
- Support Zone 1510 to 1610 Price Band
- Resistance Zone 1760 to 1860 Price Band
- Support Zone tested retested over past 2 weeks
- Support Zone sustained thou price dipped below 3 times
- Volumes synced with avg traded qty with heavy spikes too
- Rising Support Trendline since May 2024 seems well respected
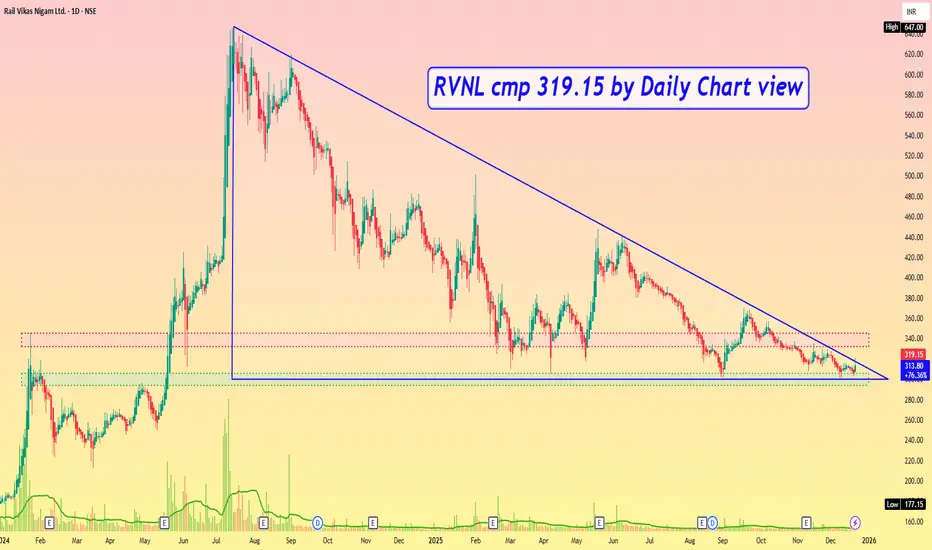
RVNL cmp 319.15 by Daily Chart viewRVNL cmp 319.15 by Daily Chart view
- Support Zone 294 to 306 Price Band
- Resistance Zone 332 to 345 Price Band
- Support Zone tested retested over past few days
- Support Zone since January 2025 seems been sustained
- Volumes below avg traded quantity, need to increase for fresh upside
- Breakout from Descending Triangle pattern might be in the making process
Bank Nifty spot 59389.95 by the Daily Chart viewBank Nifty spot 59389.95 by the Daily Chart view
- Support Zone intact at 58850 to 59375 for Bank Nifty
- Resistance Zone stands tall at 59825 to ATH 60114.30 for Bank Nifty
- Volumes keeping stable under avg traded quantity over past few days
- Falling Resistance Trendline Breakout attempts seem in the making process
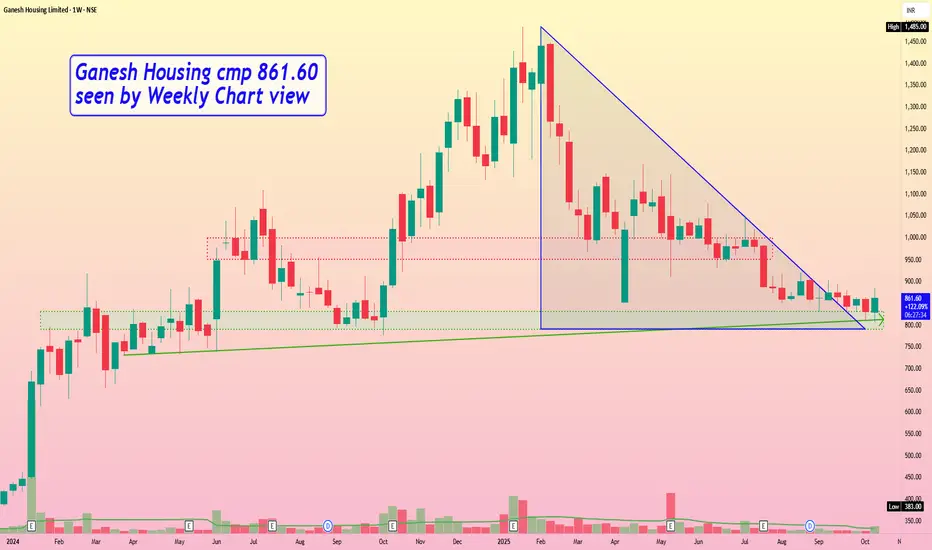
Ganesh Housing cmp 861.60 by Weekly Chart viewGanesh Housing cmp 861.60 by Weekly Chart view
- Support Zone 790 to 830 Price Band
- Resistance Zone 950 to 1000 Price Band
- Descending Triangle Breakout in the making process
- Support Zone seems tested retested over the past few weeks
- Volumes are flat, need to increase for fresh upside price movement
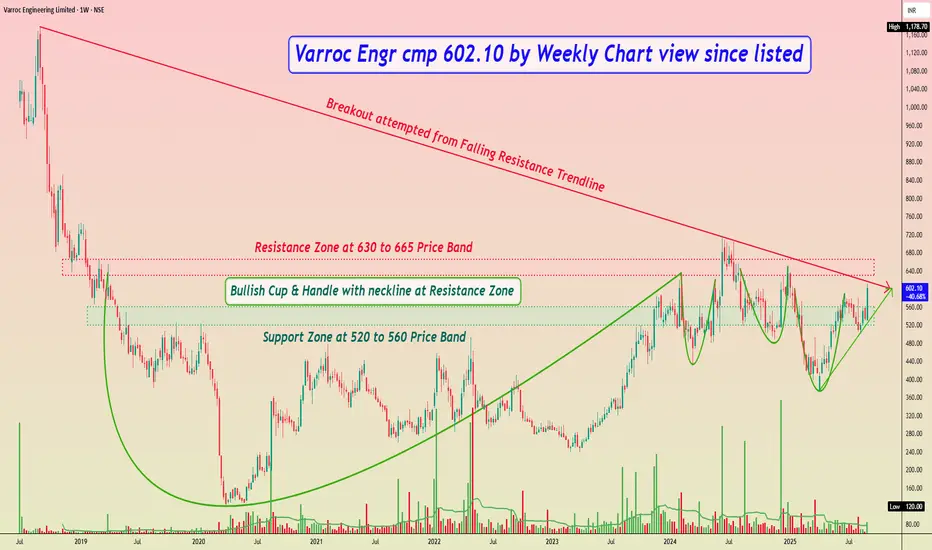
Varroc Engr cmp 602.10 by Weekly Chart view since listedVarroc Engr cmp 602.10 by Weekly Chart view since listed
- Support Zone at 520 to 560 Price Band
- Resistance Zone at 630 to 665 Price Band
- Breakout attempted from Falling Resistance Trendline
- Bullish Cup & Handle with neckline at Resistance Zone
- Bullish Rounding Bottoms also formed by Resistance Zone neckline
- Heavy Volumes based Breakout on Daily Chart after Support Zone testing retesting