Pn gadgil Technical -
Strong absorption after huge selling,
Break above where selling started.
Risk -7/8%
Target -16/20% after trailing with 20/30emas
Fundamentals -
Company Maharashtra based jewellery retailer growing at 25-30%.
Company is starting PAN India expansion this quarter by opening FOCO stores in UP and MP.
They are guiding for 20-23 stores for this year along with PAT margins from 3.5-4%.
This stock trending due to it quarterly results on social media
Swing-trading

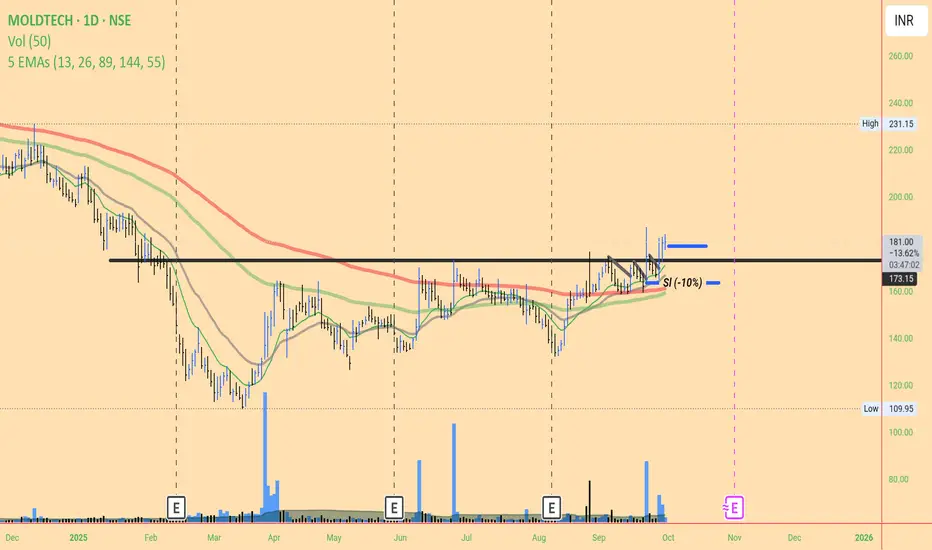
Mold-Tech #technicalanalysis
pattern look like vcp from left to right move price became narrow.
High volume after absorption ,
* Now price break 1st correction candle above trade. Entry point
* Sl -10% , from entry point 179 current price,
Reason below high volume after selling zone absorption area below that.
Muthoot finance uptrend stocks Muthoot finance id good In this Sector. That's good fundamentals company'. It's in uptrend in 45Min chart . It's taking support at every fall. It's going up with ema.
We can take Position with SL. U can easily book 3 -5% in this stock .keep SL of 3 -5%. Means 1 :1 R :R. THEN trial SL .

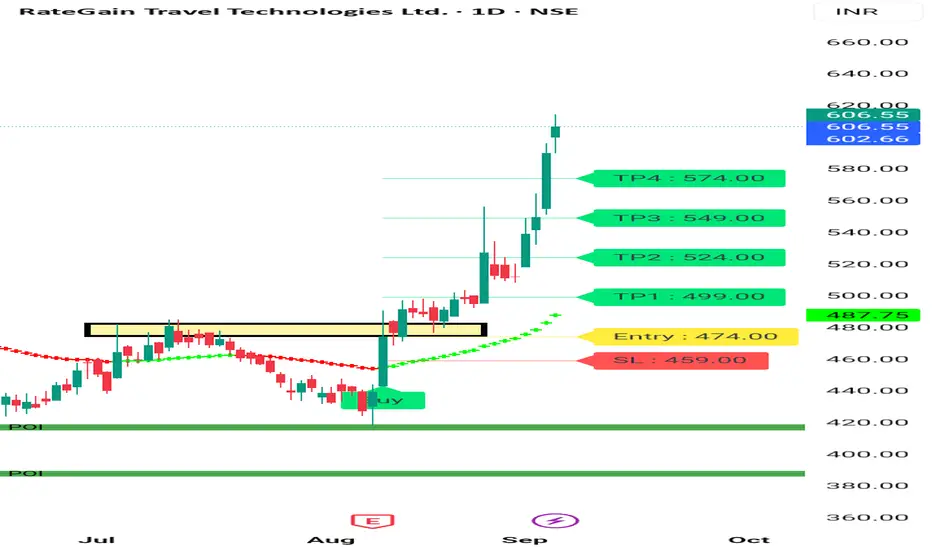
RATE Gain Bullish Structure Rate Gain is Given Good Breakout Above 485 From 485 it's moved to 600 . It's All Time High is 897 . It's given Weekly Breakout also . Ist Daily Rsi above 80 , it has to take Retracement Before Further Movement. It may move to 800 Levels in next 3 -6 months . Wait for Good Risk Reward. At Current price not good entry .who have already they can Trial SL .
For more information Watch my Profile . Always Trade with SL. No trade without Stoploss.
Consult your financial advisor before making any position in stock market.
HCLTECHBased on my analysis for long Only for education purpose only not for any buying or selling recommendations.

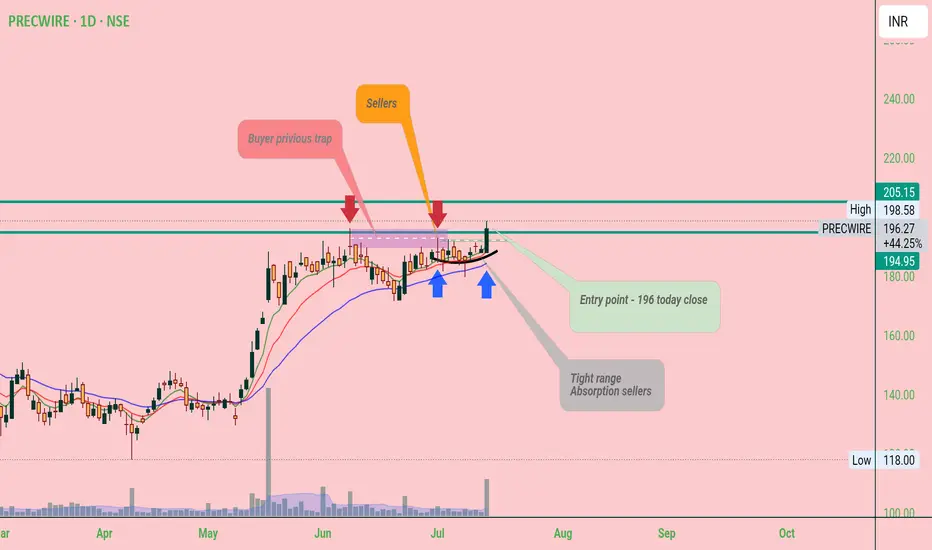
Precwire Price trading at near resistance area if close above 205₹
Good move up side posible
Pattern look like cup & handle
Put your sl below handle below risk max 10% around
HeranbaSwing Trade -
Look interesting at current level - still closing pending
If today close above break out level
Maybe we can see Good move upside.
Risk around 8-10% around
Target next resistance

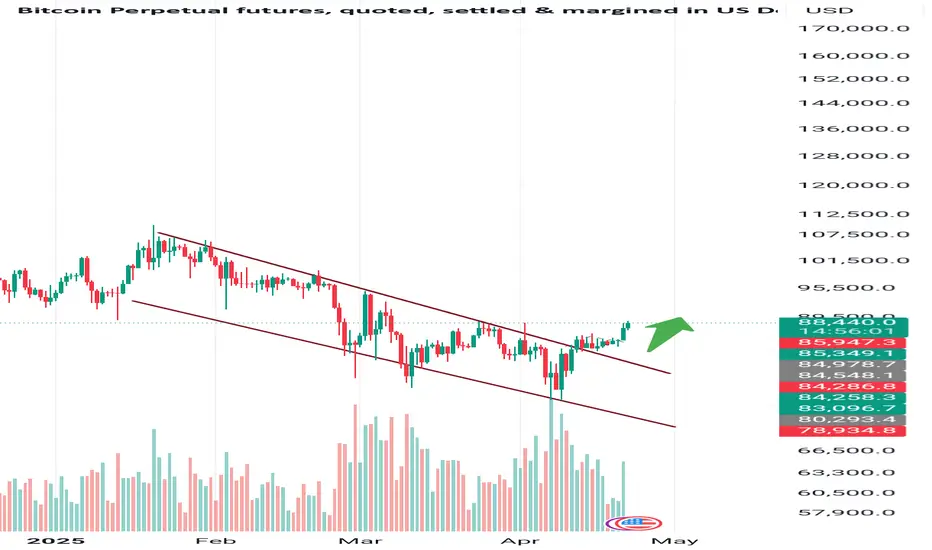
Bitcoin Daily Breakout – Trend Reversal in Play?BTCUSD | Breakout Alert!
Bitcoin has been trading within a downward channel on the daily chart, but today it has finally broken out to the upside with strong momentum. This breakout could signal the beginning of a bullish move. If the breakout sustains above key resistance levels, BTC has significant potential to move higher in the coming days. Keep an eye on the volume and price action for confirmation.
Targets & Key Levels:
Next Target: 110000++
Support: 80000
Stay cautious and manage your risk accordingly!
#BTCUSD #Bitcoin #CryptoBreakout #TechnicalAnalysis #CryptoTrading #BTC #CryptoCharts #BullishBreakout #PriceAction #TradingView
CNXIT BULLISH !
1. Resistance Breakout:
- The index has historically faced selling pressure at 38,653 - 38,405 Zone, causing it to reverse or pause its upward movement.
- When a stock breaks above a strong resistance level, it means that buying demand has overwhelmed the selling pressure at that price point. This breakout is a positive sign, indicating that the chart may move higher, especially if it is a clean break (i.e., it closes significantly above the resistance level).
- The **strength of the breakout** is often measured by the volume of trading activity. If the breakout occurs on **high volume*, it indicates that a large number of market participants are involved, adding credibility to the When a stock breaks through a strong resistance level and retests that level with good volume, it can signal a strong bullish move. Here's a detailed breakdown:
2. Retest of the Resistance Level:
- After the breakout, it’s common to see a retest of the previous resistance level, which now acts as a support level. This retest occurs as some traders may take profits, or there may be some temporary selling pressure as the market re-evaluates the new price.
- If the stock successfully holds above the previous resistance (now support) on the retest, it confirms that the breakout was valid. This gives bulls (buyers) more confidence that the level will hold and that the stock has further upside potential.
3. Volume Confirmation:
- A retest with good volume is essential. If the stock holds the new support on strong volume, it signals that buyers are stepping in to defend the level, further reinforcing the idea that the stock is in a bullish phase.
- Conversely, if the retest occurs on low volume, it may indicate a lack of conviction from buyers, and the breakout may be prone to failure.
4. Bullish Expectations:
- When a stock breaks out of resistance and successfully retests it with strong volume, the expectation is that the stock will enter a new bullish trend. The prior resistance has now been transformed into a solid base of support, and the stock may experience momentum buying, pushing prices higher.
- Traders often see this scenario as a low-risk, high-reward setup. Their stop-loss would typically be placed just below the new support level, while the upside target could be based on previous price patterns, such as Fibonacci extensions or previous highs.
5.Target :
- it is on its all-time high targets on fib zones,pivots 0r based on future price action basis.
# Summary:
- **Breakout of strong resistance Indicates potential for higher prices.
- **Retest of resistance as support Confirms strength of the move if support holds.
- **Good volume on retest: Adds confidence in the bullish move.
- **Bullish expectation Likely continuation of the upward trend.
This combination forms a high-probability bullish setup in technical analysis.
#cnxit #itsector #nifty

A BREAKOUT WITH VOLUME - ARIHANT CAPITAL.NSE:ARIHANTCAP
❇️ Strong breakout on weekly chart.
❇️ Flag and poll pattern in 30mint time frame.
❇️ Stock can achive 108-115 targets in upcoming days.
❇️ Short and log terms targets 140-160-190++.
❇️ Nearby support 88-90.
❇️ Above 95 we can see a real move🔥
👉🏻 @thetradeforecast 🇮🇳

A BREAKOUT WITH VOLUME - ADSLNSE:ADSL
❇️ Strong breakout on 4-2 hour chart
❇️ Stock can achive 250-280+ targets in upcoming days.
❇️ Nearby support 220-210.
❇️ Above 240 we can see a real move🔥
👉🏻 @thetradeforecast 🇮🇳

READY FOR BREAKOUT!! + HAVING GREAT VOLUME - ZEEL ENTERTAINMENT NSE:ZEEL BSE:ZEEL
❇️Clean breakout will happen on chart.
❇️ Great volume after long consolidation.
❇️ A good move can be caught above 151, as you can see on chart
❇️ achievable Target are 174-206. For shorts term view.. targets will be 230+
❇️ small Stoploss near 133. Below previous day low.(Logical)
👉🏻 @thetradeforecast 🇮🇳

WEEKLY BIG BREAKOUT LOW RISK, 21TH AUGUST NSE:CASTROLIND
❇️A good low risk setup in daily time frame above 270 makes a perfect entry.
❇️SL below recent swing low.
❇️A very good weekly break out at weekly time frame.
❇️Expecting stock price to reach 300-330 in up coming days.
❇️ Volume looks good.
❇️Every entry must have a stoploss partnered with it.
👉🏻 @thetradeforecast 🇮🇳

Network 18 Watch for a Upside Swing Trade...Network 18 Trade in an upside range. Which support is 70 and resistance is 140.
You should watch upto 140 🎯

Set Sail with Confidence - Onboard Mazagon Ship Short Term Trading Advice
Buy Mazagon Dock Shipbuilding
Buy Range- 5125 - 5300
Target- 6000 - 6150
StopLoss- below 4600
Potential Return- 15-18%
Approx trade duration 14 - 15 days

UPLI Observed these Levels based on price action and Demand & Supply which is My Own Concept Called "PENDAM CONCEPTS" ... Please Don't Take any trades based on this chart/Post...because this chart is for educational purpose only not for Buy or Sell Recommendation.. Thank Q

Approaching Key Resistance - Watch for Breakout Looking Strong
The stock is forming an ascending triangle pattern, characterized by a horizontal resistance around ₹700 and higher lows converging towards this resistance.
- The price is approaching the upper resistance level at ₹700.
- A breakout above this level with strong volume can signal further upside potential.
- Immediate resistance is around ₹700, which has been tested multiple times.
- Support is established along the ascending trendline, currently around ₹650.
- Volume has been consistent with no significant spikes yet, indicating a potential for volume increase upon breakout.
- The RSI is around 57.63, showing bullish momentum but not yet overbought, indicating room for further upward movement.
- Watch for a breakout above ₹700 with increased volume to confirm the next bullish move.
- In case of a breakout, the stock could target ₹750 and higher.
- Traders might consider entering on the breakout or on a retest of the ₹700 level, with stops below the ascending trendline.

looking very strong, Ready to break 2.5 year old resistance Suraj looking very strong, ready to break 2.5 year old resistance volume rising RSI already given breakout Trading Above, all crucial EMA and SMA if breaks the resistance And Sustain above it can give decent profit

Oil india1.Moving averages
- 21 Ema above 50
-50 Ema above 200
-Gap between Ema seems better
2.uptrend continues observed
3.Good pivot levels

Vedant Breakout | Swing TradeHead and sholder pattern Breakout
Buy above 250
Sl 238
Note - Only for education purpose

MOIL Analysis & Prediction in DTFThis is the analysis of MOIL in Daily Time Frame. Watch carefully. The chart explains itself.
There are some prediction levels. These Levels act as Support and Resistance according to position of price. You have to trade according to level breakout or breakdown.
Always maintain your risk management.
Book your profit according to your “STOMACH”.
Disclaimer:
This is not investment advice. I am not a SEBI Registered Analyst. Anything posted here is my own analysis and views. This is created for educational purposes only. Always consult your Financial Advisor before taking any decision or trade.
Happy trading.
About MOIL:
MOIL Ltd. engages in the production manganese ore. It operates through the following segments: Mining, Manufacturing, and Power Generation. The firm also manufactures ferro manganese, electrolytic manganese di-oxide; and generates wind power. The company was founded on June 22, 1962 and is headquartered in Nagpur, India.

CAREERP Analysis & Prediction in DTFThis is the analysis of CAREERP in Daily Time Frame. Watch carefully. The chart explains itself.
There are some prediction levels. These Levels act as Support and Resistance according to position of price. You have to trade according to level breakout or breakdown.
Always maintain your risk management.
Book your profit according to your “STOMACH”.
Disclaimer:
This is not investment advice. I am not a SEBI Registered Analyst. Anything posted here is my own analysis and views. This is created for educational purposes only. Always consult your Financial Advisor before taking any decision or trade.
Happy trading.
About CAREERP :
Career Point Ltd. engages in the provision of education services. The firm operates through the following segments: Education and Related Activities, Financing (NBFC), Infra Division, and Others. It offers education consultancy, management services, tutorial services, and residential hostel services. The company was founded by Pramod Kumar Maheshwari and Om Prakash Maheshwari in May 1993 and is headquartered in Kota, India.

GMR Power & Urban Infra Ltd Analysis and Prediction in DTFThis is the analysis of GMRP_UI (GMR Power & Urban Infra Ltd) in Daily Time Frame. Watch carefully. The chart explains itself.
There are some prediction levels. These Levels act as Support and Resistance according to position of price. You have to trade according to level breakout or breakdown.
Always maintain your risk management.
Book your profit according to your “STOMACH”.
Disclaimer:
This is not investment advice. I am not a SEBI Registered Analyst. Anything posted here is my own analysis and views. This is created for educational purposes only. Always consult your Financial Advisor before taking any decision or trade.
Happy trading.
About GMRP_UI:
GMR Power & Urban Infra Ltd. engages in the development and construction of properties in the sectors of energy, urban infrastructure, and transportation. Its project portfolio includes power plants, roads, railways, airstrips and runways, and multi product industrial properties. The company was founded on May 17, 2019 and is headquartered in New Delhi, India.
