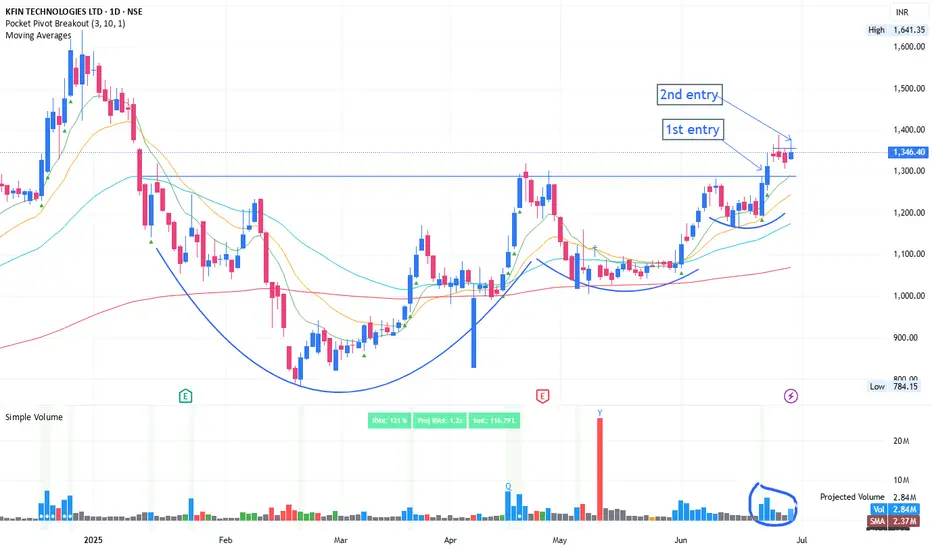
Volatility contraction, breakout and tightnessKFINTECH: Recent breakout which was marked as 1st entry. It is the safest entry, good thing is, post breakout it is forming tightness in price. This acts like spring. Once it bounce from this level, then there are high chance of blasted move.
2nd entry could be above the tightness breakout with 200-300x RVOL during early starting of trading session. This could give huge intraday returns and good topup over existing position
Stay connected for upcoming development and notes.
Disclaimer:
The information provided herein is for educational and informational purposes only and should not be construed as investment advice. The stock analysis and recommendations are based on publicly available information, data sources believed to be reliable, and our interpretation at the time of writing.
Investing in equities involves risks, including the risk of loss of capital. Past performance is not indicative of future results. Readers and investors are advised to conduct their own research or consult a qualified financial advisor before making any investment decisions.
The author(s), affiliates, or associated entities may hold positions in the stocks mentioned, and such positions are subject to change without notice.
We do not guarantee the accuracy, completeness, or timeliness of any information presented, and we disclaim any liability for financial losses or damages resulting from the use of this content.
Swing
Weekly Short Setup | Valid Until Weekly ClosePrice has pushed through a potential weekly Pivot supply zone (red box) where sellers may step in. This trade is based on the expectation of a rejection from this area.
Entry: Red box — a short entry zone aligned with overhead supply
Stop Loss: Above the red zone (invalidates the setup)
Target: Green box — area to consider partial/full exit based on momentum
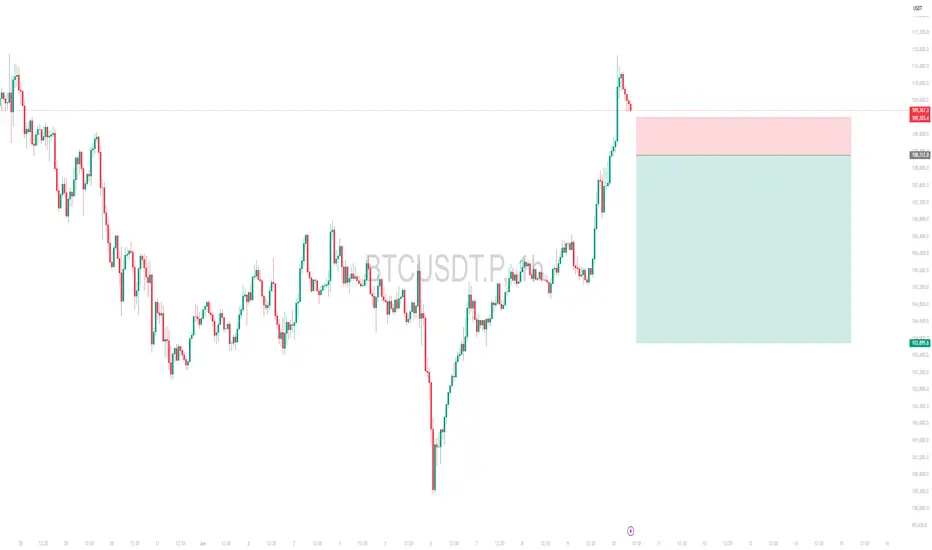
BTCUSDT has shown a strong bounce and has now approached a key pivotal resistance zone
Risk-reward is favorable with a tight invalidation and clean downside target
Price may stall or reverse near the red box, creating short opportunity
Note:
This is an weekly setup and idea that expires at Weekly Candle Close. Re-evaluate the setup if price remains indecisive near the entry zone close to that time.
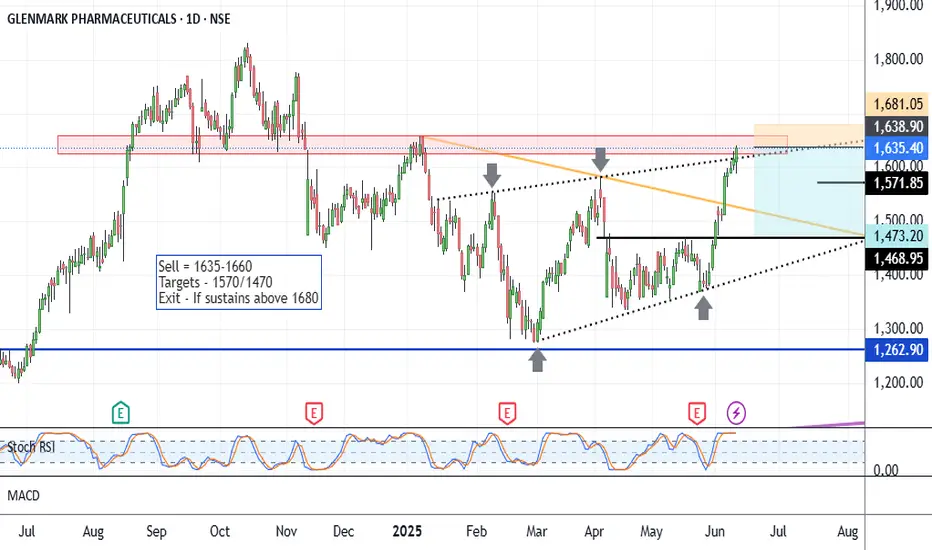
Glenmark - Short SetupCMP 1635 on 12.06.25
The chart is self-explanatory. The stock price has increased by approximately 20% over the past month. This time, reaching the confluence area around 1640-1650.
If the area around 1650 reacts as resistance again, a correction period will then ensue.
Targets may be 1570/1470.
The setup will lose significance if it sustains above 1680.
The above illustration and analysis are only for learning and sharing purposes; it is not buy or sell recommendations.
All the best.
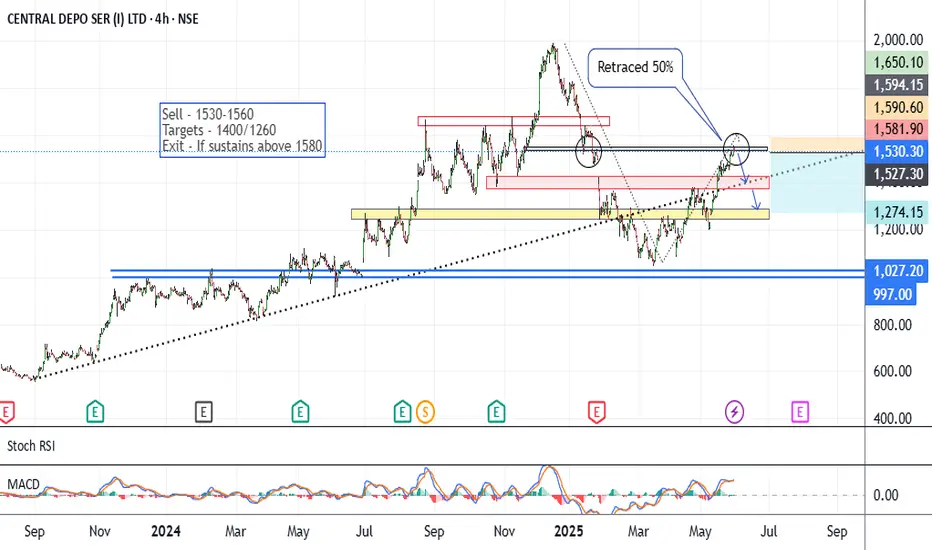
CDSL - Short SetupCMP around 1530 on 01.06.25
The chart is almost self-explanatory. Since March 25, the price has risen by around 50%. This time trading on a likely resistance area.
If price rejects these levels of 1530-1560, it may go into a correction ahead.
Lower targets may be 1400/1260.
The setup weakens if it sustains above 1580 levels.
One should keep the position size according to the risk management.
All these illustrations are provided for learning and sharing purposes only; they do not constitute buy or sell advice. Please do your research before taking any position.
All the best.
A NICE CONTRACTION before Breakout! - GODREJPROPThe following points need to be considered before entering a trade:
---------------------------------
1. A good accumulation near the level of 1950 is observed.
2. A good contraction pattern indicates a sharp breakout of the zone.
3. Price is repeatedly testing its 200 ema making Higher lows.
Considering these points, a trade can be entered as follows:
Entry - 2277, SL 2150, Tgt 2550, RR 1:2
DISCLAIMER : This is NOT a Trade recommendation, but only my observation. Please make your own analysis before entering any trade.

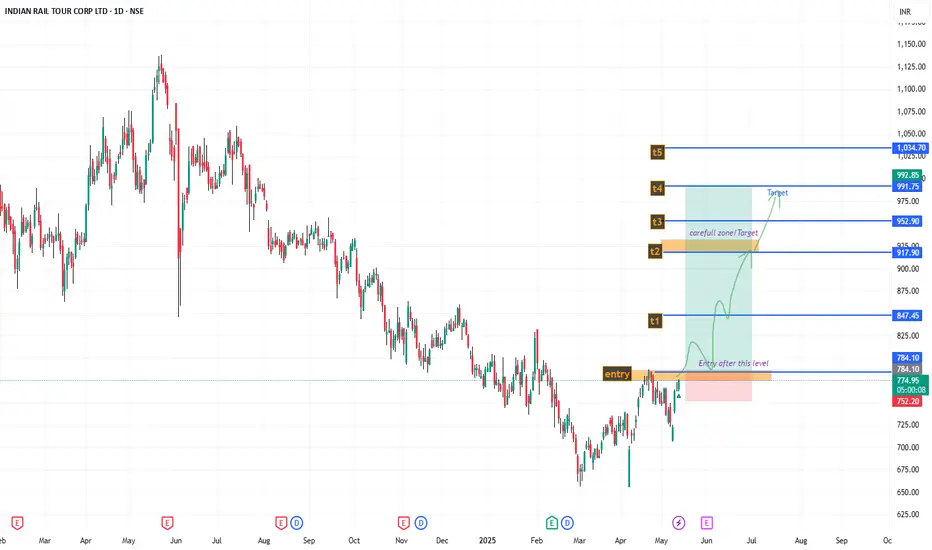
IRCTC , Looking good ; min 25% Roi ; swing For short term investment ;
Leave a " Like If you agree ".👍
.
Wait for small retracement & daily candle to close above - "785".
Trade carefully untill ENTRY level.
.
Entry: 785
Target: 850-917-991
sl: 745
major stoploss/ support: 700.
.
Enter only if market Breaks
"Yellow box" mentioned.
.
.
Don't make complicated trade set-up.📈📉
Keep it " simple, focus on consistency "💹
Refer our old ideas for accuracy rate🧑💻
Follow for daily updates👍
.
Refer old posted idea attached below.
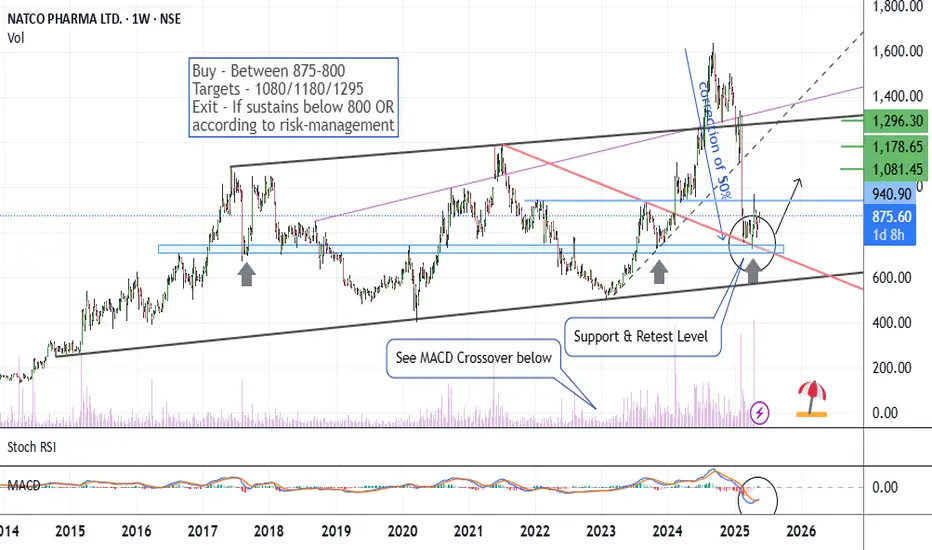
Natco Pharma - Enough CorrectionCMP 875 on 22.05.25
The stock price dropped 50% between September 2024 and March 2025. In recent days, it has been consolidating near the 800 levels, which is acting as a support zone, as shown on the chart.
MACD shows a likely crossover, too.
If it gives an upside move, further targets may be 1080/1180 or more.
One has to keep the position size according to the risk management.
The setup will go weak if it sustains below 800-775 levels.
All these illustrations are only for learning and sharing purposes, not a piece of trading advice in any way.
All the best.
GRSEHealthy stock , again show some sign of strength.
-11% risk,
Target at least 1:2
80% meet my criteria.
Let's see how it move.

Max Financial - Positional Short SetupCMP 1305 on 02.05.25
In the last 2 months, the stock price has increased by around 30%. This time forming a double top-like pattern. If the price is rejected from these levels, a bearish move may come ahead.
If the price remains below the 1300 levels, targets of 1245/1210 and 1165 may be seen.
One should wait for the confirmation for a short setup, while considering risk management.
The setup fails if the price sustains above 1330.
All these illustrations are only for learning and sharing purposes, not a trading recommendation. It is only for paper trading.
All the best.

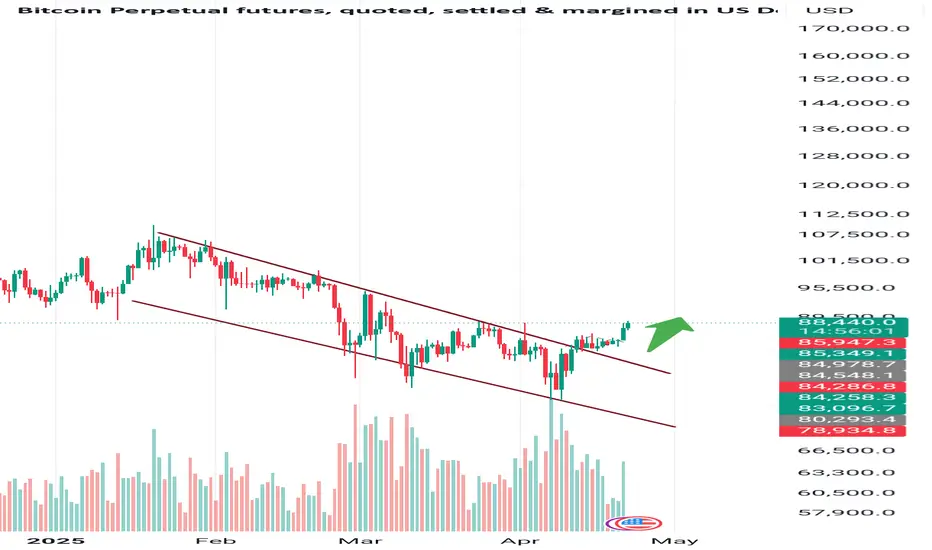
Bitcoin Daily Breakout – Trend Reversal in Play?BTCUSD | Breakout Alert!
Bitcoin has been trading within a downward channel on the daily chart, but today it has finally broken out to the upside with strong momentum. This breakout could signal the beginning of a bullish move. If the breakout sustains above key resistance levels, BTC has significant potential to move higher in the coming days. Keep an eye on the volume and price action for confirmation.
Targets & Key Levels:
Next Target: 110000++
Support: 80000
Stay cautious and manage your risk accordingly!
#BTCUSD #Bitcoin #CryptoBreakout #TechnicalAnalysis #CryptoTrading #BTC #CryptoCharts #BullishBreakout #PriceAction #TradingView
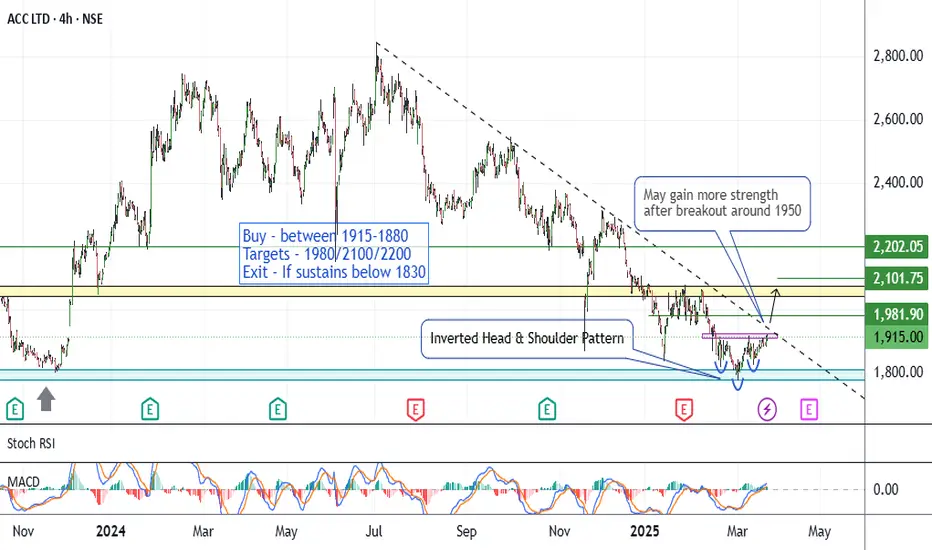
ACC - Long SetupCMP 1915 On 24.03.25
Since July 24, the stock price has dropped around 40%. According to the chart setup, it seems to be getting ready for a breakout now.
Has been consolidating into a small range in recent sessions. Now formed an inverted Head & Shoulder pattern. Also, there will be a breakout of the dotted line, joining the tops of wicks of the last 8 months.
If gives a breakout around 1950, there may be a bullish phase ahead. Targets may be 1980/2100 and 2200.
The setup will lose significance if sustains below 1830.
The strategy should be coupled with some hedging tool for better risk coverage, if possible. Or keep your position size according to the risk capacity.
All these illustrations are only for learning and sharing purposes, only for paper trading. It is not a buy or sell recommendation.
All the best.
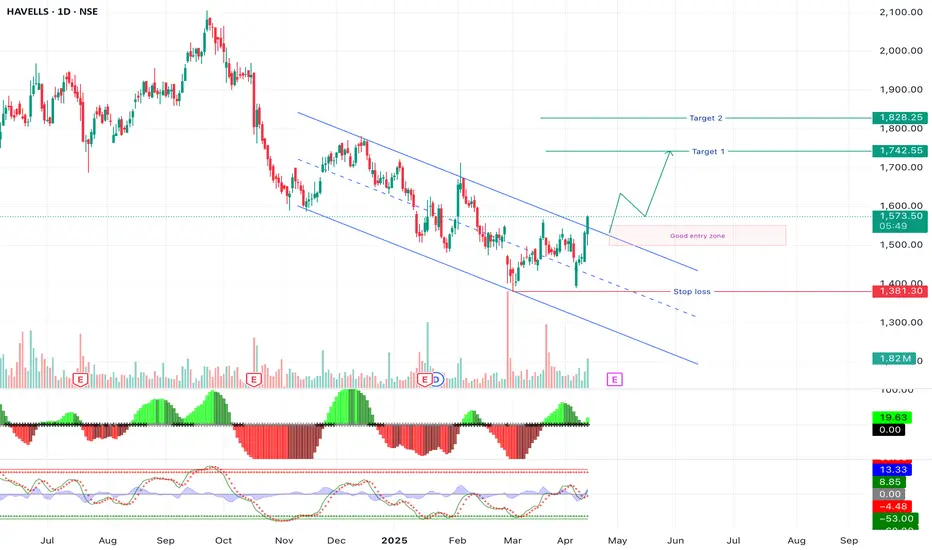
Havells Long l Swing Moving out of channel
Volume greater than average volume
Making higher high, change of character
Can wait for some reversal for better risk rewards
Targets and SL as given in the chart
NIFTYAfter a meaningful descending triangle, an open expanding triangle has been detected. For Nifty to continue moving up, at least one support is required on this triangle, and this dip will be called as The TRUMP Effect. in.tradingview.com

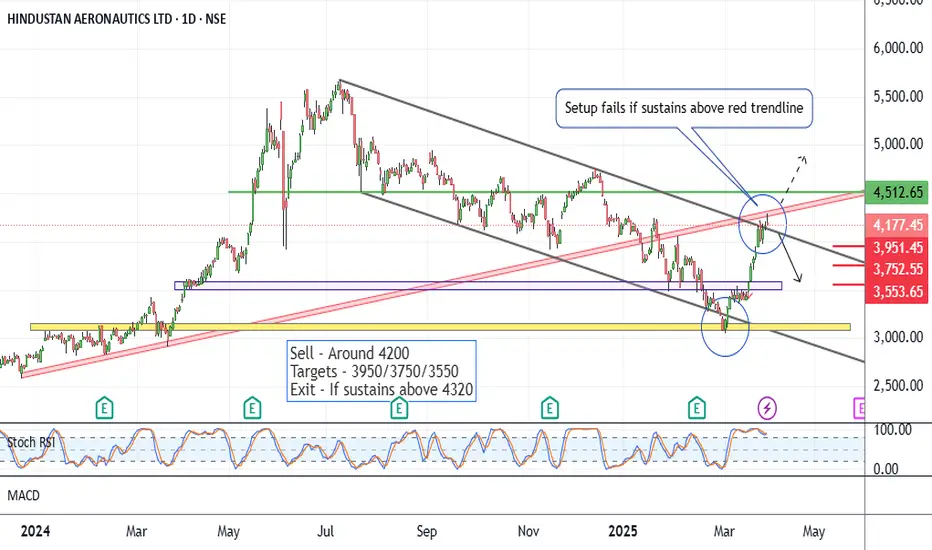
HAL - What Next ?CMP 4177 on 31.03.25
The stock has shown a 40% rise in the recent month. This time may face resistance as shown on the chart (the red trendline).
If the price is rejected from these levels, a downside move can be seen ahead. That can push the price down to the levels of 3950/3750 and 3550.
The setup fails if the price sustains above 4320 levels.
The strategy may be coupled with some hedging options for a wide coverage.
All these illustrations are only for learning and sharing purposes, for paper trading. They are not trading recommendations in any way.
All the best.
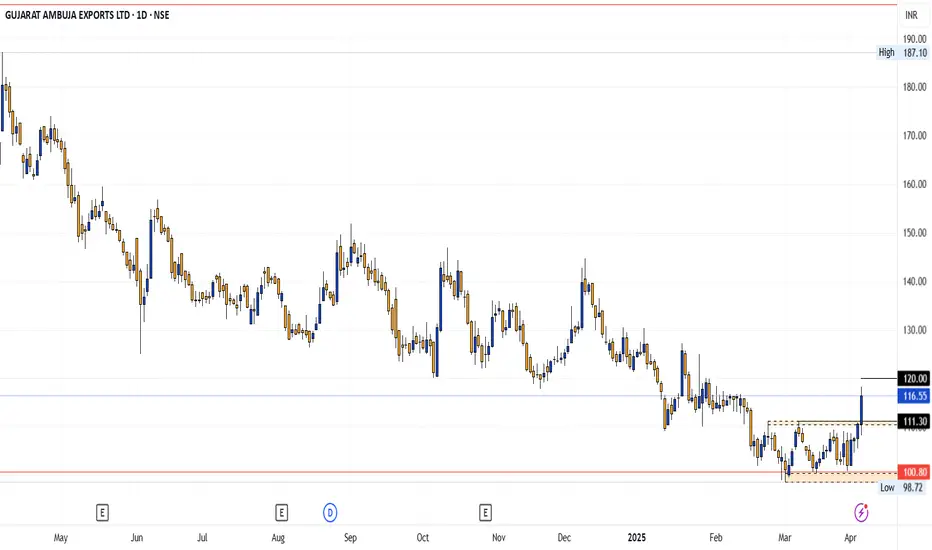
GAEL Stock Alert: Strong Setup After Days of SilenceGujarat Ambuja Exports Ltd (GAEL)
Current Market Price (CMP) : ₹116
Buy Level: Above ₹120
Add on Break Above: ₹120, with further additions up to ₹111
Stop Loss (SL): ₹96 (Weekly Closing Basis)
After a prolonged decline, Gujarat Ambuja Exports Ltd (GAEL) has shown promising movement following a substantial consolidation phase. This presents an opportune moment to consider a position in this stock. Here’s why:
Technical Analysis: GAEL has recently emerged from a significant consolidation period, indicating potential bullish momentum ahead. The buy signal triggers once the stock surpasses ₹120, with an option to accumulate additional positions as it continues above this level, targeting up to ₹111.
Investment Strategy: Positioning for the uptrend after consolidation suggests a favorable risk-reward ratio, with ₹96 serving as a critical stop-loss level on a weekly closing basis. This strategy aims to capitalize on the anticipated upward movement while effectively managing downside risk.
Conclusion: With GAEL poised for a potential breakout following a period of consolidation, this recommendation aligns with a strategic approach to capitalize on emerging market trends. Investors looking to leverage technical indicators and market sentiment can consider initiating positions above ₹120 with prudent risk management through the specified stop-loss level.
By leveraging this opportunity, investors can potentially benefit from the anticipated bullish movement in Gujarat Ambuja Exports Ltd (GAEL), making informed decisions based on market dynamics and technical analysis.
Disclaimer: This recommendation is based on technical analysis and market trends. Investors are advised to conduct their research and consider their risk tolerance before making investment decisions.
Feel free to adjust your strategy according to your investment goals and risk appetite. Happy investing!
WABAG | Reversal Swing CandidateStock has corrected and now looked like formed base. Probably reversing from here.
Forming higher high Higher low
RSI is strong
Taking support on ema at daily level
Fundamentals are good.
Good for swing and long term.
SL and target for swing as given chart.

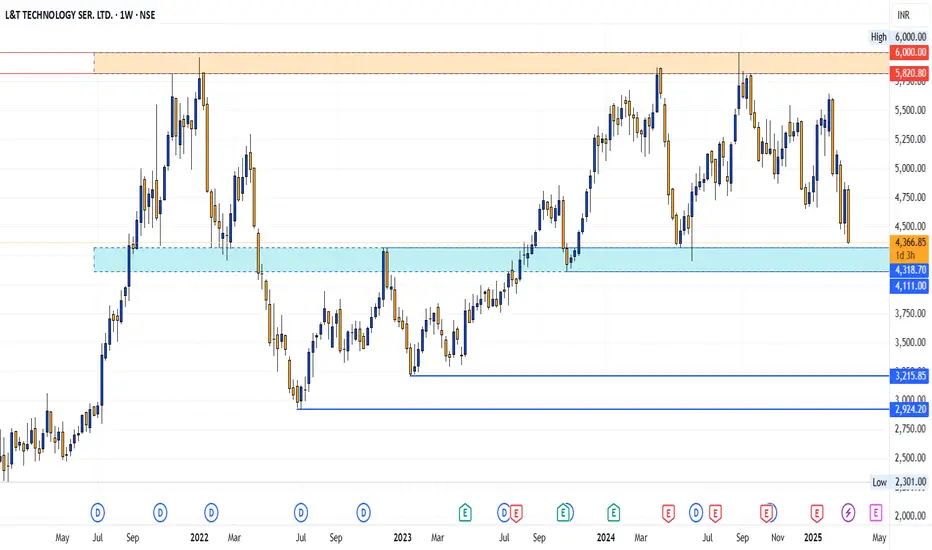
LTTS | SUPPORT & RESISTANCE | BUY LEVELSI've identified the support and resistance zones for LTTS, which you can see on the chart. This analysis is based on a weekly timeframe.
If you're interested in creating an entry plan, entering at the support zone might be a good strategy. If you'd like to learn more about how I approach this, please follow along. I'd be happy to share my process!
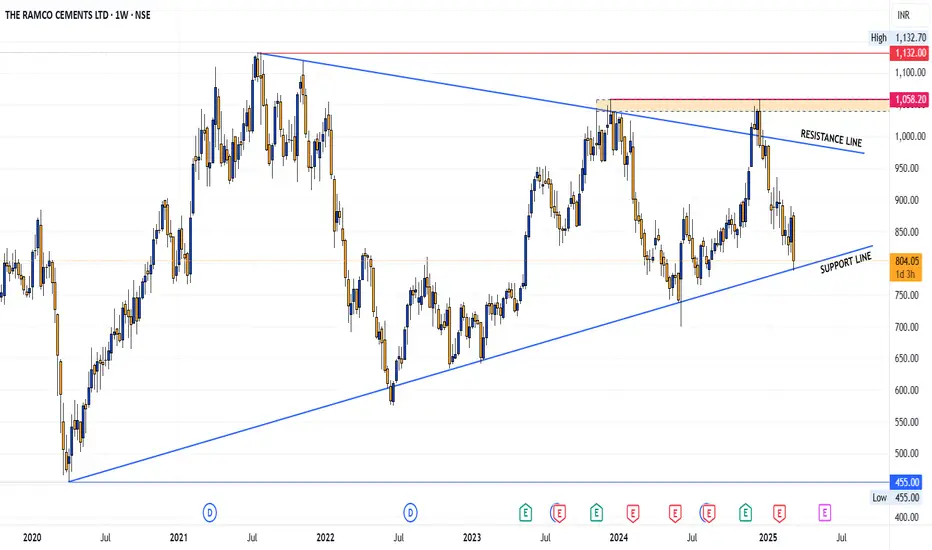
Ramco Cements: A triangle pattern is emergingRamco Cements is developing a triangle pattern, which occasionally offers support and resistance points that can create trading opportunities. I've highlighted these levels on the chart, and I hope this might be useful for anyone looking to navigate these price movements.
Hindustan Zinc Update – A Breakout on the Horizon?Hindustan Zinc is trading at 432 after pulling back from its all-time high of 807.
It’s approaching a critical zone— a potential trendline breakout could be in the cards! But first, we need a daily closing above 438 to confirm strength.
Key Levels to Watch:
Major Support – It has taken strong support, which can be validated on the monthly timeframe.
The Real Bullish Move? – A decisive closing above 481 could trigger a strong rally!
Plan Your Entry Wisely!
If you want to know my entry, stop-loss, and target, follow me for live updates! Let’s trade smart!

Suven Pharma Swing Trade (Long)Suven Pharma is in Uptrend in Daily TF.
On 2h timeframe, it is in uptrend and has grabbed liquidity from Weekly low and daily low.
If Nifty holds current levels ie 22400, then there are high chances Suven Pharma will touch ATH soon.
The Risk Reward is more than 1:8
Do like and follow for more Trading ideas like this regularly. Comment your views on this analysis.

Max Financial - Low Risk SetupCMP 1032 on 20.02.25
It is clear from the chart that the stock price has been rising in a parallel channel in recent sessions. Right now it is at the bottom of the channel.
If gives a bounceback, may go into a bullish phase again.
The risk-reward ratio seems good at the moment.
The setup remains active when the price sustains inside the parallel channel.
Plz keep the position size according to the risk management.
All the above illustration is my own view. Shared only for learning purposes. It is not a trading recommendation in any form.
All the best.

Titan - Keep On WatchCMP 3580 on 03.02.25
The above chart shows that the price has been traveling in a rising parallel channel in recent sessions. At this moment, the price has touched the upper edge of the channel. If rejected from these levels, a bearish move may be seen further.
Targets may be 3510/3330 and 3190.
Please keep in mind the earnings day around 4th February.
This setup fails if the price sustains above 3710.
Plan your trade as per your risk management. ( entry and exit)
The above illustration is my view. It is only for learning and sharing purposes, not a trading recommendation.
All the best.

VMM Breakout and Retest Possible Entry For Long confirmation, wait for :
1. Reversal candle
2. Volume uptick
3. SL would be 103
Classic Breakout And retest
