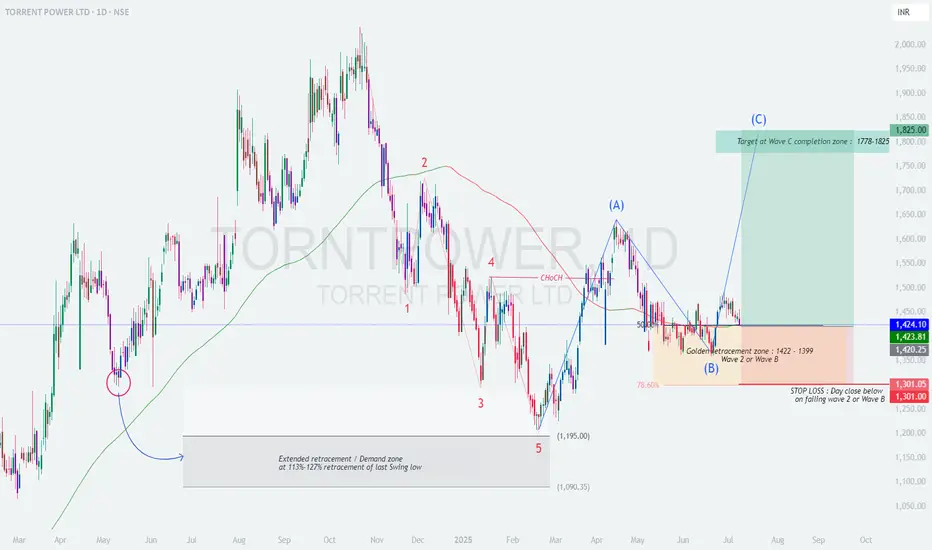
TORNTPOWER – Wave C Rally Loading from Golden Fib Zone?
After a 5-wave fall and clean ABC correction, price is poised for a potential Wave C breakout.
Golden retracement zone held strong – is this the beginning of a bullish continuation toward ₹1825?
🧩 Elliott Wave Structure:
Full 5-wave impulse decline completed → Wave 5 bottom at ₹1195
Sharp Wave A rally confirms initial trend reversal
Wave B retraced to Golden Zone (50–78.6%) → ₹1399–1422
Structure now favoring development of Wave C
📌 Key Confluences:
Golden Zone Support: Price holding firm at ₹1399–1422
CHoCH (Change of Character): Clear structure shift after Wave 5 bottom, confirming trend reversal
Price action above CHoCH level = bullish intent
Support + Fib + CHoCH = high-conviction reversal case
🎯 Targets:
Wave C Completion Zone: ₹1778–1825
Upside potential: ~28.5% from current levels
🛑 Stop-Loss & Risk Control:
Stop-loss: Day close below ₹1301
Risk:Reward: 3.4+
📈 Summary:
5-wave decline + ABC setup = classic reversal blueprint
CHoCH confirms structure flip from bearish to bullish
Low-risk swing opportunity from high-probability zone
Wave C often delivers strong directional moves – and with CHoCH in place, the foundation looks ready!
#TORNTPOWER #WaveC #CHoCH #ElliottWave #SwingTrade #GoldenZone #TrendReversal
Swingtrade
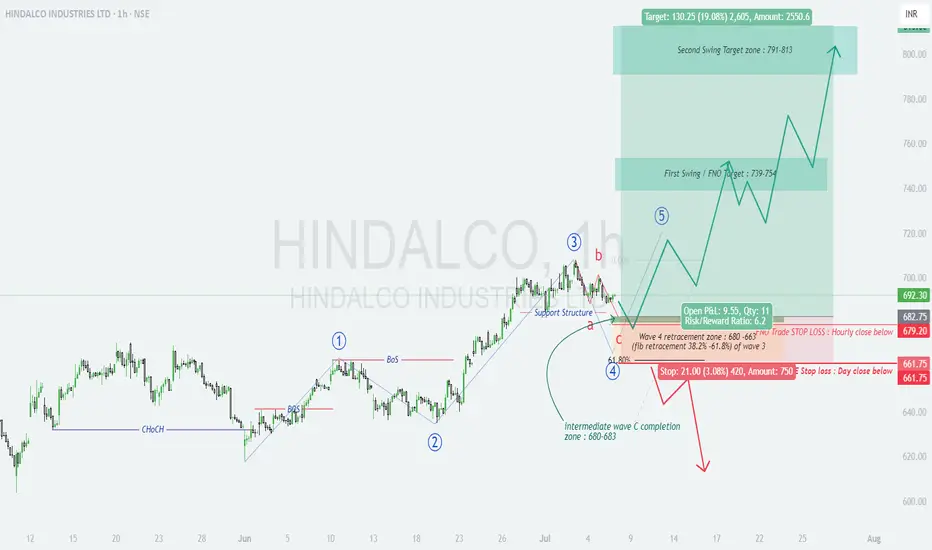
HINDALCO Gearing Up for Wave 5? Entry Zone Locked In for Swing!
📊 HINDALCO – Elliott Wave Analysis (1H Timeframe)
Textbook 5-wave impulse in play – Wave 4 nearing completion
Structurally clean setup with ideal R:R and defined invalidation. High probability long opportunity forming.
🧩 Wave Structure:
Wave 1 to 3 completed; Wave 3 peaked with momentum
Current correction forming a classic ABC zig-zag in Wave 4
Subwaves 'a' and 'b' completed; 'c' approaching ideal completion zone
🔎 Technical Confluence Zone:
Wave 4 Fib Retracement: 38.2–61.8% of Wave 3 → ₹680–663
Support Structure: Aligns with Wave C zone = ₹680–683
Price action showing slowdown → low volatility candles + buyer absorption
Entry zone aligns with high-probability reversal structure
🎯 Upside Targets (Wave 5 Projection):
First Swing Zone: ₹739–754
Second Swing Zone: ₹791–813
🛑 Stop-Loss Zones:
Intraday SL: Hourly close below ₹679.20
Positional SL: Day close below ₹661.75
📈 Reward Potential:
R:R ratio: 6.2+
Structure offers clear risk management and ideal swing setup
A must-watch for swing traders and Elliott Wave learners. Let price react at ₹680–683 zone for confirmation before entry.
#Hindalco #ElliottWave #SwingTrade #WaveAnalysis #TechnicalSetup #NSE
WCIL - H&S Pattern | Breakout Above Resistance | Daily Chart📊 WCIL – Breakout Above Resistance | RSI Bullish | Strong Volume | Fibonacci Levels | Daily Chart
📅 Chart Date: June 27, 2025
📈 CMP: ₹114.43 (+3.42%)
📍 Ticker: NSE:WCIL
🔍 Technical Analysis Summary
🔺 Breakout From Trendline & Resistance
WCIL has broken out above horizontal resistance at ₹113.50 and long-term descending trendline, indicating strong bullish momentum
Golden neckline breakout of a potential inverse head & shoulder / V-recovery formation
📊 Volume Spike
Massive increase in volume (7.09M) confirms buying interest and validates the breakout
📈 RSI Indicator (14, Close)
RSI at 70.85, trending upward and entering bullish territory
Multiple Bullish RSI crossover signals provide confluence for the uptrend
🌀 Fibonacci Retracement Levels
38.2% – ₹107.94
50.0% – ₹121.13 (next key level)
61.8% – ₹134.31
100% – ₹177.00 (full retracement potential)
📍 Key Price Levels
✅ Breakout Zone: ₹113.50
🔼 Immediate Resistance: ₹121.13
🎯 Target Levels: ₹121 → ₹134 → ₹153+
🛡️ Support Levels: ₹107.9 → ₹100 → ₹91
💡 Trade Idea
Entry: Above ₹114 on confirmation with volume
SL: Below ₹107.50 (close below previous resistance)
Targets: ₹121 → ₹134 → ₹153
Risk-Reward: High conviction due to structure and volume
⚠️ Disclaimer
This chart analysis is for educational purposes only. Always DYOR (Do Your Own Research) and consult a financial advisor before making investment decisions.

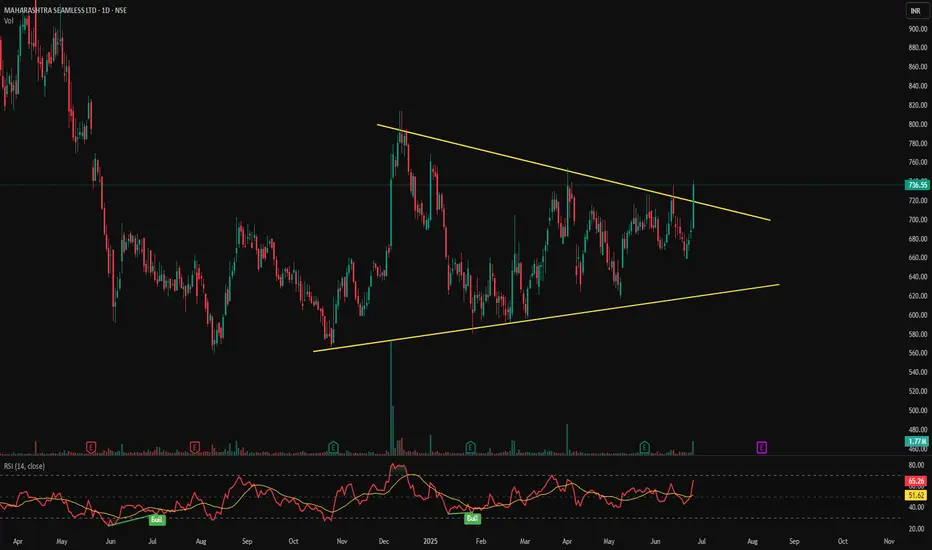
MAHSEAMLES - Symmetrical Triangle Breakout📊 MAHSEAMLES – Symmetrical Triangle Breakout | RSI Bullish | Volume Surge | Daily Timeframe
📅 Chart Date: June 26, 2025
📈 CMP: ₹736.55 (+7.20%)
📍 Ticker: NSE:MAHSEAMLES
🔍 Technical Analysis Overview
🔺 Symmetrical Triangle Breakout
After months of consolidation within a symmetrical triangle pattern, MAHSEAMLES has broken out with a strong bullish candle
Breakout level: Above ₹725, confirmed with strong price momentum
Breakout marks potential trend reversal and beginning of new bullish phase
📊 Volume
Volume spike to 1.77M, significantly higher than recent average – validates breakout strength
📈 RSI Indicator (14)
RSI at 65.26, trending upwards – bullish zone
Previous RSI Bullish signals noted at key turning points, providing confluence
📍 Key Technical Levels
✅ Breakout Level: ₹725
🚀 Potential Upside Targets (based on pattern height projection):
₹770
₹800
₹840+
🛡️ Support Zones:
₹700 (retest zone)
₹670 (lower trendline support)
₹635 (triangle base)
💡 Trade Setup Idea
Entry: On breakout close above ₹725 with confirmation
Stop Loss: Below ₹695 (just under triangle resistance)
Targets: ₹770 → ₹800 → ₹840+
Risk-Reward: Favorable with pattern breakout and rising momentum
⚠️ Disclaimer
This chart analysis is for educational purposes only. Always DYOR (Do Your Own Research) and consult a financial advisor before making investment decisions.
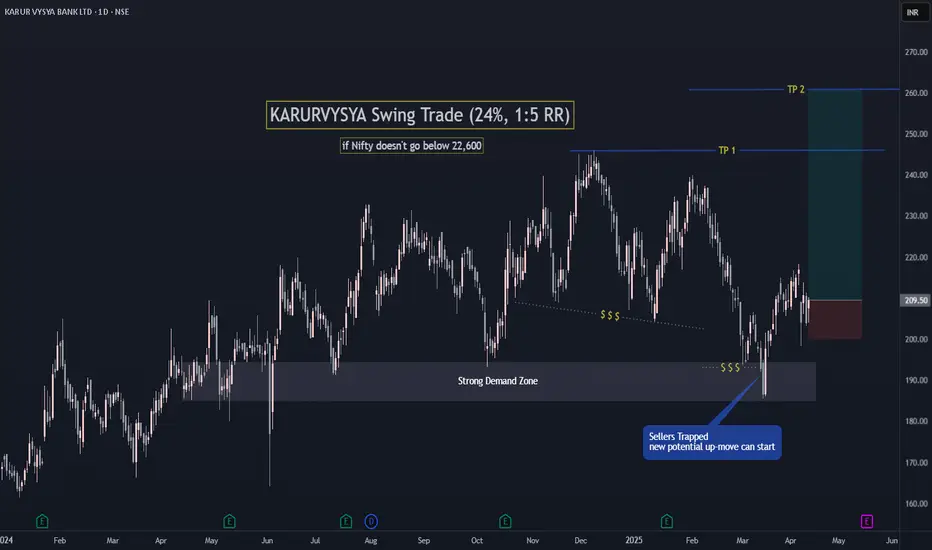
KARURVYSYA Swing Trade (24% potential, with 1:5 RR)Pretty much everything self explanatory in chart.
A very good potential trade if Nifty holds it current level ie 22,700.
Also a very good fundamental stock.
Follow for such good setups.
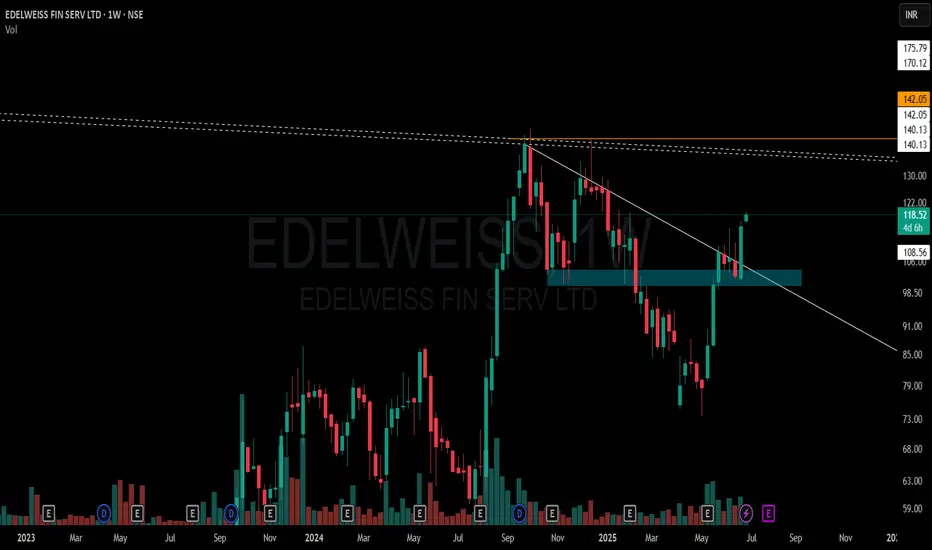
EDELWEISS FIN SERV LTD – Weekly Structure A few key observations on this weekly chart without any forecast bias:
🔹 White Solid Trendline – Marks the active CT (counter-trend) level which has now been decisively taken out.
🔹 Blue Zone – A previously tested supply and demand area has been regained and price is now sustaining above it.
🔹 White Dotted Lines – Multiple short-term weekly hindrances lie just above, acting as micro-resistances.
🔹 Orange Line – Reflects multi-timeframe level confluence and a known volume cluster region to watch ahead.
🔹 Volume has seen a healthy pickup during this breakout, suggesting participation.
📌 Not a recommendation. Just sharing chart structure and price behavior.
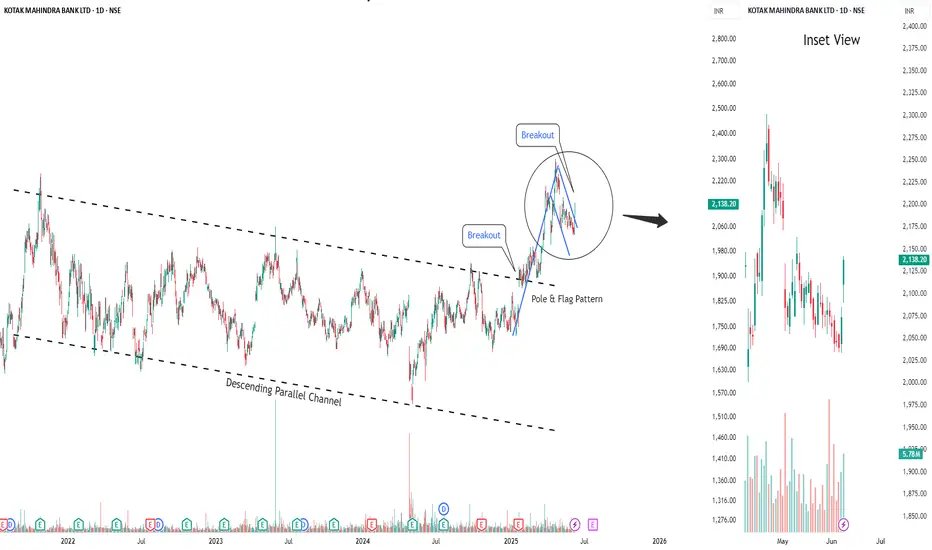
Buy Kotak Mahindra Bank Short Term Trading Advice by Goodluck Capital
Buy Kotak Mahindra Bank
Buy Range- 2100 - 2135
Target- 2200 - 2225
StopLoss- below 2060
Upside Potential- 4% -5%
Approx trade duration 7 - 8 days
Trent Price Action Decoded – Simplicity Wins!No calls, no forecasting — just pure price action. In this post, I’m simply sharing how I see Trent’s chart. Clean structure, organic movement, and a simple approach to reading the price. For those who enjoy observing the market without noise or bias.

Bulish Breakout in HUBTOWNIn upcomming Few Days we ll see a bulish breakout in HUBTOWN
as price is going to retrace the level then it will break the level 136.6 and there is a possible upcomming move in HUBTOWN

BDL | Long | Swing Setup | Wave AnalysisBDL is either in Wave C of abc
or Wave 3 of 1-5 as shown in chart
both cases suggest a bullish up-move towards target one in case of wave C and towards target 2 in case of wave 3.
SL would be 1090- 1130 zone. If looks weak in this zone we will exit.
Increasing volume suggests a good momentum long setup.
Just my 0.02$

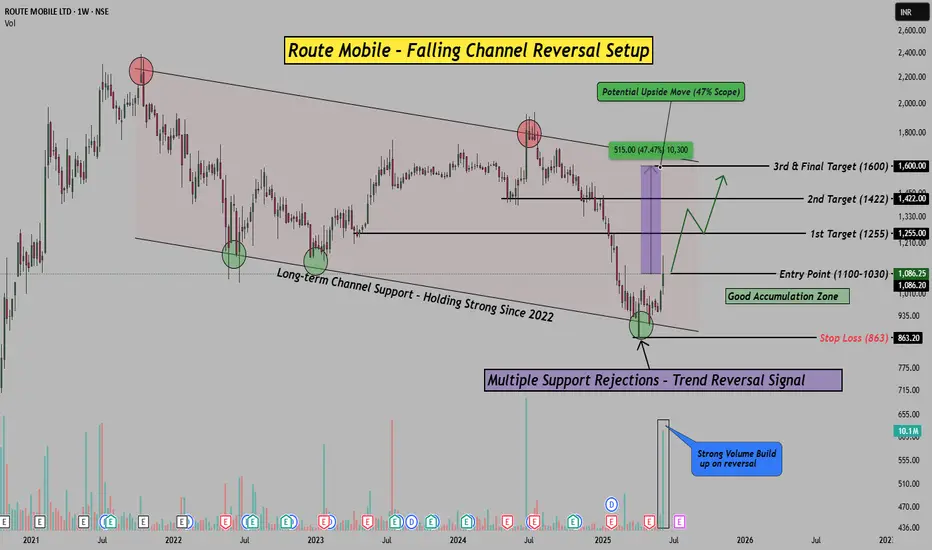
47% Potential Upside in Route Mobile? Channel Reversal Analysis!Hello Everyone, i hope you all will be doing good in your life and your trading as well! In today's post, i have brought a very interesting reversal setup on Route Mobile Ltd.
After spending over 2 years inside a falling channel , the stock has recently shown a sharp bounce right from the long-term channel support , which has held strong since 2022. Not just that, this bounce came with a strong volume spike , hinting at fresh buying interest.
The current price action structure is clearly indicating a potential trend reversal from the lows. I have marked a Good Accumulation Zone between (1100-1030) , where smart money seems to have stepped in. If this setup works out, I am looking we can see good spike in coming few weeks, Please check chart above to know about the targets.
To manage risk, I have kept a safe Stop Loss at 863 , which is approx 12% downside , while potential upside is over 47% . That gives us a solid risk-reward structure for positional traders.
Technicals Match Fundamentals:
Route Mobile is a strong player in global cloud communications, working with big names across the world. Long-term fundamentals remain stable, and the chart now supports a technical reversal.
If you enjoy such chart-based trade setups backed by structure and logic, don’t forget to LIKE & FOLLOW for more.
Disclaimer: This idea is purely educational. Please consult your advisor before investing.
When to Exit a Trade: Exit Plan for Every Trading Style!Hello Traders!
Every trade type needs a different kind of exit plan — but most traders use one-size-fits-all. That’s why they either exit too soon or too late.
Today, I’ll break down how to plan your exits based on trade type and intention .
A smart exit plan fits the nature of the trade — not just your emotion in the moment.
Exit Plan for Swing Trades
Target Based: Pre-decide 1:2 or 1:3 risk-reward levels.
Trailing SL (Candle Based): Move SL below each higher low in uptrend.
Exit on Structure Break: If price breaks key swing low, exit immediately.
Exit Plan for Positional Trades
Weekly Chart View: Exit only if weekly trend changes or closes below trendline.
Partial Booking: Book some profits at resistance zones, hold rest for trend continuation.
News/Events SL: Avoid holding through uncertain events unless strategy-backed.
Exit Plan for Long-Term Trades (Investment Trades)
Fundamental Exit: Exit only if company fundamentals weaken or story changes.
Valuation-Based Exit: Exit when valuations are stretched beyond long-term average.
Exit in Phases: Don’t exit fully — scale out in parts across 10-20% intervals.
Exit Plan for Breakout Trades
Multi-Year Breakout: Hold till price holds above breakout zone on weekly chart.
2-Week Breakout: Use previous resistance as SL. Exit if it fails to sustain above it.
Volume Confirmation: Exit if breakout happens on weak volume and fails to follow through.
Exit Plan for Options Trades
Defined SL in Premium: Keep strict SL (e.g., ₹30 loss on ₹100 premium).
Time-Based Exit: Exit if expected move doesn’t come by your time window.
Theta Decay Watch: Exit early if holding beyond 2–3 days and premium drops without move.
Momentum Exit: Trail SL tightly once premiums start shooting.
Rahul’s Tip
Don’t treat every trade the same. Swing, positional, long-term — each needs its own exit discipline.
Your plan should depend on chart timeframe, reason for entry, and trade type — not just emotions.
Conclusion
Your exit strategy should match your trade type, not just your mood.
Once you start using the right exit logic for the right trade, your results will become more consistent, more powerful, and way less stressful.
Thanks for reading!
If this helped bring clarity, do like, share and follow for more trading insights made simple.

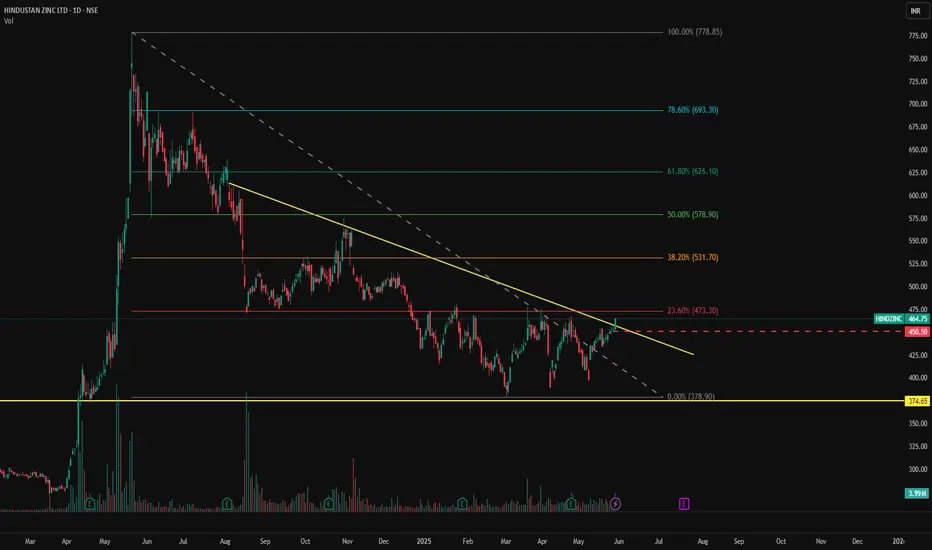
HINDZINC - NSE | Daily Chart Analysis📊 HINDUSTAN ZINC LTD (HINDZINC) – NSE | Daily Chart Analysis
📅 Date: May 30, 2025
📈 CMP: ₹464.75 (+2.68%)
📌 Ticker: NSE:HINDZINC
🧠 Technical Breakdown
🟢 Descending Trendline Breakout 🟢
The stock is showing early signs of strength as it approaches the apex of a long-term descending trendline. Price action is attempting a trendline breakout from a nearly year-long downtrend, suggesting the possibility of a bullish reversal.
🔍 Volume Confirmation
Steady volume buildup over the past few sessions, potentially indicating accumulation ahead of a confirmed breakout.
📉 Well-Defined Support
₹374.65 has acted as a strong demand zone on multiple occasions, offering a solid base for the current move.
📍 Key Price Levels
🔺 Resistance (Trendline Breakout Zone): ₹465
🔻 Major Support: ₹374.65
🎯 Upside Targets (on breakout):
₹500
₹535
₹575+
🛡️ Stop Loss: Below ₹440 (on breakout failure)
📌 Trading Strategy
Aggressive Entry: On breakout + closing above ₹465 with volume surge
Conservative Entry: Retest of trendline post-breakout
SL: ₹440
Target Zone: ₹500–₹575
⚠️ Disclaimer
This post is for educational purposes only and does not constitute financial advice. Always conduct your own analysis or consult a financial advisor before investing.
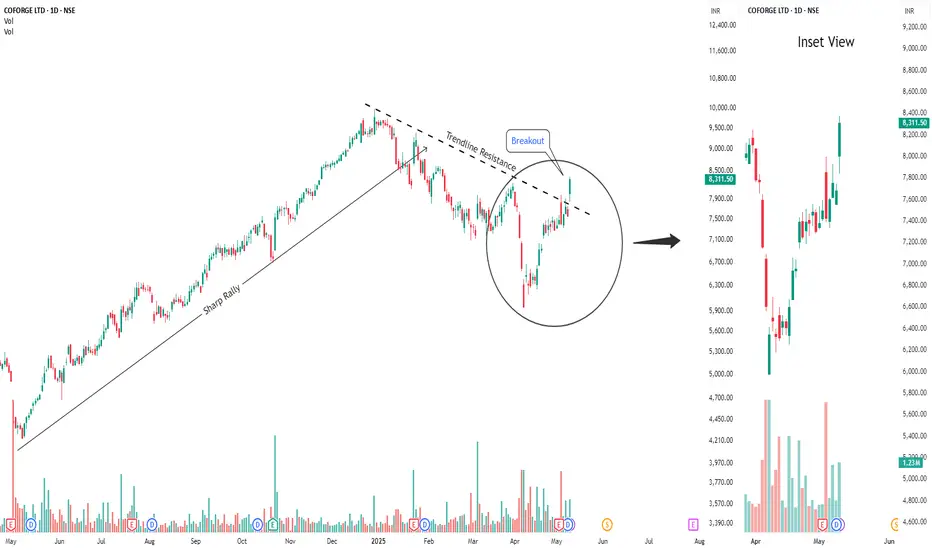
Buy Coforge Short Term Trading Advice by Goodluck Capital
Buy Coforge
Buy Range- 8000 - 8200
Target- 8750 - 8850
StopLoss- below 7700
Upside Potential- 8% -9%
Approx trade duration 14 - 15 days
PVSL : Swing Trade#PVSL #swingtrade #Trendingstock #momentumstock
PVSL : Swing trade
>> Breakout stock
>> Trending setup
>> Momentum stock
>> Good Strength & Volume buildup
Swing Traders can lock profit at 10% and keep Trailing
Disc : Stock Charts shared are for Learning purpose and not a Trade Recommendation.
Consult a SEBI Registered advisor before taking position in it.

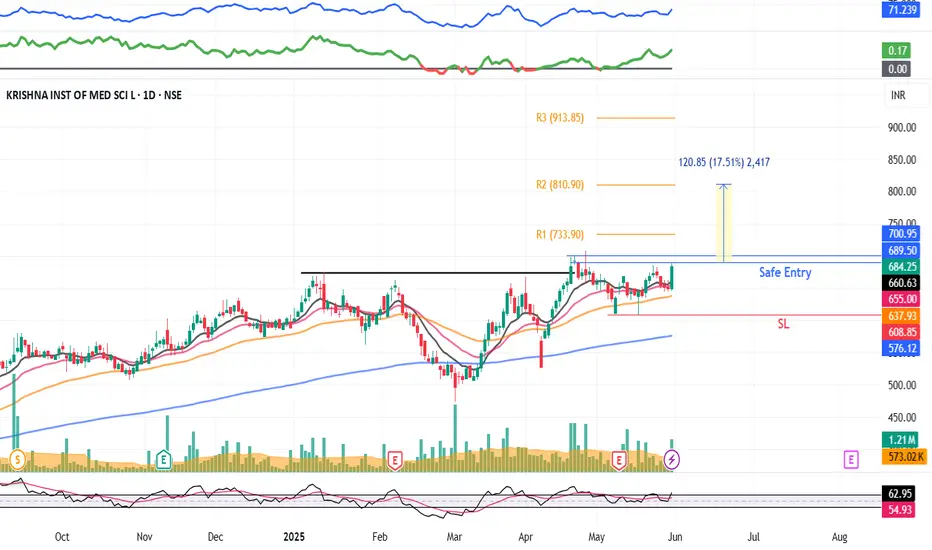
KIMS : Swing pick#KIMS #Swingtrade #trendingstock #breakoutstock
KIMS : Swing Pick
>> Breakout Stock
>> Trending setup
>> Good Strength in Stock
>> Good Volumes Buildup
>> Good Upside Potential
Swing Traders can lock profit at 10% and keep trailing
Disc : Stock charts shared are for Learning purpose not a Trade recommendation.
Consult a SEBI Registered Advisor before taking position in it.
CHALET Hotels : Swing pick#CHALET #swingtrade #breakout #threewhitesoldiers #trendingstock
CHALET : Swing Trade
>> TWS Visible
>> Trending Setup
>> Good Strength in Stock
>> Volumes Dried up, Expansion imminent
>> Quick 10-15% upside potential
Swing Traders can lock profit at 10% & Keep Trailing
Disc : Charts shared are for Learning purpose and not a Trade recommendation. Consult a SEBI Registered Advisor before taking position in it.

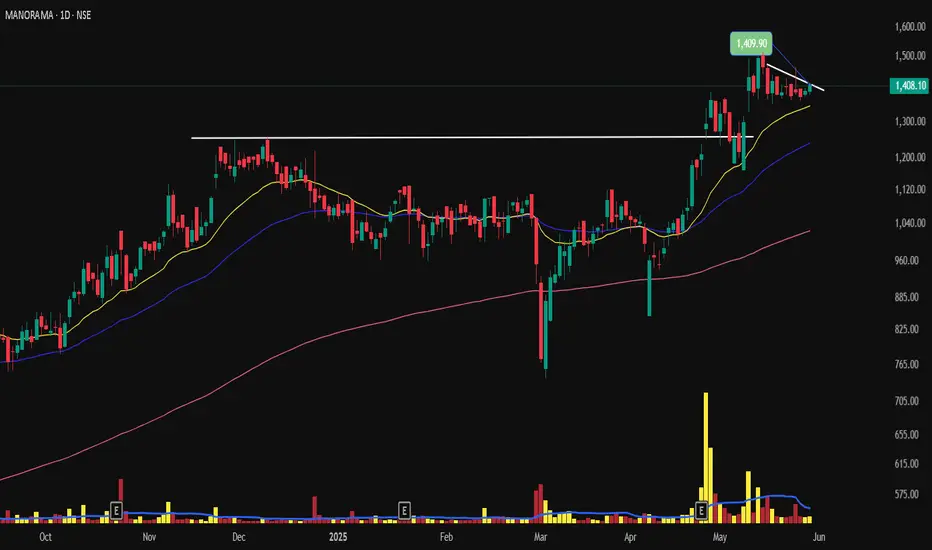
Long base setup A good long base consolidation and breakout and then price taking support at 21 EMA can be considered for swing with SL 1353
LongTerm Support Reversal with Volume Surge in Bayer CropscienceHello everyone! I hope you all are doing well in your life and trading journey. Today I’m sharing a positional setup on Bayer Cropscience Ltd , which has given a strong bounce from a key long-term support zone. A massive volume spike confirms a potential trend reversal, indicating smart money may be accumulating at current levels. This setup offers a great opportunity for medium to long-term investors with a favorable risk-reward ratio.
The fundamentals of the company are equally strong, backed by Bayer AG with zero debt, healthy ROCE, and consistent performance in India’s agrochemical space. I’m eyeing an entry range of 5450–5750 , with a stop loss at 4630 . Upside targets stand at 6730 , 7799 and 9200 . Let’s track this breakout closely for further confirmation.
Disclaimer: This analysis is for educational purposes only. Please consult a financial advisor before making any investment decisions.
If you found this helpful, don’t forget to like, share , and drop your thoughts in the comments below.

TDPOWERSYS: Anticipated 20% upsideThe chart of TDPOWERSYS provides delineates critical price thresholds that signify breakout points, along with specific support levels that serve as indicators of where buying interest may manifest.
Additionally, the chart highlights regions likely to act as ceiling points for future price ascensions, allowing for informed decisions on entry and exit strategies.
Disclaimer: The information contained in this technical analysis report is intended solely for informational and educational purposes. It should not be interpreted as financial advice or a recommendation to buy or sell any security. Investors are strongly encouraged to conduct their own research and consult with a qualified financial advisor before making any investment decisions.

CSB Bank Short Term ViewBreakout above 365 on Closing basis.
Volume:
Volume is less than previous session by 12.67%.
Volatility:
ATR% of the stock is 3.46%
Average of last 20-day is 4.01%
Moving Average Observations:
Price remains above 200-day Moving average.
Price above 50-day, 100-day and 200-day Moving average.
RSI Observations:
The Daily RSI indicator has remained above 50. This is a bullish zone. Current Daily RSI reading is 60.95.
The Weekly RSI indicator has remained above 50. This is a bullish zone. Current Weekly RSI reading is 64.27.
The Monthly RSI indicator has remained above 50. This is a bullish zone. Current Monthly RSI reading is 58.48.
ADX Observations:
The Daily DMI position remains bullish.
The Daily ADX fell by -1.36%. Current ADX reading is 19.03.
The Daily distance between DMI lines is 27.01%.
The Weekly DMI position remains bullish.
The Monthly DMI position remains bullish.
Donchian Channel Observations:
Price is above middle Donchian channel (Bullish).
Bands are flat.
Difference between bands is 10.68%.
Ichimoku Observations:
Price above Ichimoku clouds.
Clouds are bullish.
Tenkan line is above Kijun line. Ichimoku setup is bullish.
Current cloud range is 1.28% and Future cloud range is 8.63%.
Bollinger Band Observations:
Price is above middle Bollinger band (Bullish).
Bands are converging.
Difference between bands is 5.29%.

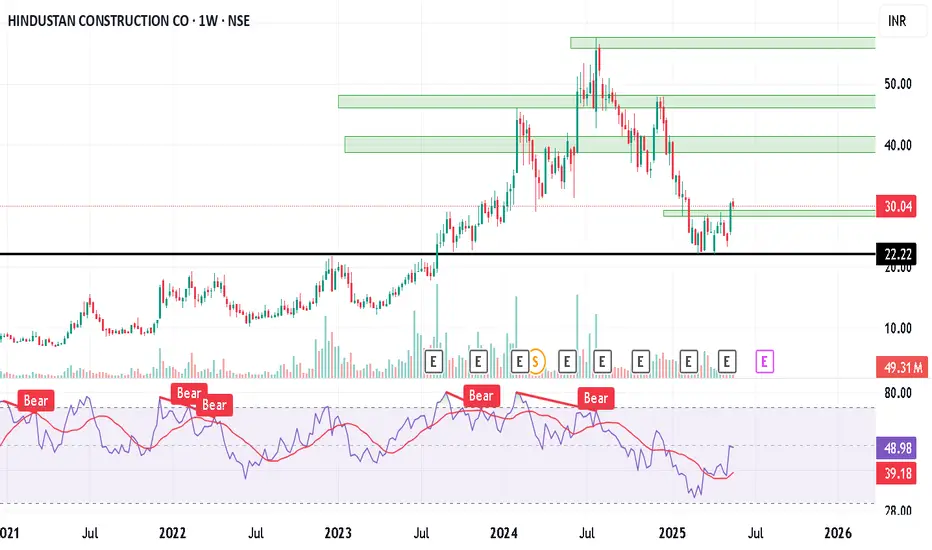
HCC, long, weekly chart, long termHCC, chart looks good for long side after base breakout, potential targets 39, 45, 55.
Buy Premier Explosives Short Term Trading Advice by Goodluck Capital
Buy Premier Explosives
Buy Range- 444 - 466
Target- 520 - 540
StopLoss- below 400
Upside Potential- 15% -20%
Approx trade duration 20 - 25 days
