Double bottom created in Dmart 1) On support dmart have formed double bottom pattern
2) falling wedge pattern makes more confirmation that buyers are taking control now
3) In negative market stock didn't breakdown
4) In short term stock may reach 4300 levels with strict sl R:R is good
Swingtrading

Swing Trade - SOLEX BUYTechnical Trade Set up
1) Sorted Ema's shows Higher timeframe Bullish sentiment
2) Price Bounced from strong Demand Zone
3) Aggresive trade active / Conservative entry wait for Price action
4) RSI in Oversold zone
Tgts wld be 1152 / 1297 / 1786
Stoploss 865 / 630 on candle closing Basis
Disclaimer: Educational purposes only. Not financial advice. DYOR and consult a professional before investing.

TMB : VCP Short Base BreakoutTMB has just completed a textbook VCP (Volatility Contraction Pattern) consolidation. We observed three clear rejections accompanied by consistent higher lows, along with a noticeable volume dry-up — all classic signs of tightening supply.
This was followed by a clean breakout backed by strong volume expansion, confirming demand stepping in. Fundamentally, both EPS and sales are improving QoQ, which adds further conviction to the setup. Overall, it checks all the boxes for a high-quality VCP trade.
I initiated the position with a conservative 0.1% risk, as I’m currently collecting more data and validating this setup type. Once I gain more confidence in the price action and consistency, I plan to gradually scale up the risk.
📢📢📢
If my perspective changes or if I gather additional fundamental data that influences my views, I will provide updates accordingly.
Thank you for following along with this journey, and I remain committed to sharing insights and updates as my trading strategy evolves. As always, please feel free to reach out with any questions or comments.
Other posts related to this particular position and scrip, if any, will be attached underneath. Do check those out too.
Disclaimer : The analysis shared here is for informational purposes only and should not be considered as financial advice. Trading in all markets carries inherent risks, and past performance is not indicative of future results. It’s essential to conduct your own research and assess your risk tolerance before making any investment decisions. The views expressed in this analysis are solely mine. It’s important to note that I am not a SEBI registered analyst, so the analysis provided does not constitute formal investment advice under SEBI regulations.

BNBUSDT – Daily Timeframe AnalysisBNB is reacting from a strong support zone around 770 after a sharp sell-off. I’m looking for a bounce from this demand area for a possible short-term recovery.
Plan:
📍 Entry zone: 770–780
🎯 Target: 950–1000 (previous resistance area)
🛑 Stop-loss: Below 700
Bias: Cautious bullish while price holds above support.
If support fails, bearish continuation toward lower levels is possible.
Not financial advice. Trade with proper risk management.

Updater Services (UDS) – Wave (B) Exhaustion | Wave (C) Counter-Timeframe: Weekly
Market: NSE
Method: Elliott Wave + Fibonacci Projection
Updater Services appears to be completing a higher-degree corrective Wave (B) after a full ABC advance into 438.
The entire decline from the top has been overlapping, channelized, and time-consuming, confirming a corrective structure rather than an impulse.
Wave Structure Overview
Wave (A): Corrective rise into ~438
Wave (B): a–b–c decline, now near the lower boundary of the long-term falling channel
Wave (C): Expected counter-trend rally once Wave (B) exhaustion confirms
🎯 Wave (C) Target Zones (Projected Using Wave A)
Targets are derived using Trend-Based Fibonacci Extension
(Start of A → End of A → End of B)
0.382 Fib: ~225–230 → First reaction / partial booking
0.618 Fib: ~270–280 → Normal Wave (C)
1.0 Fib: ~330–360 → Only if price turns impulsive
⚠️ This is a corrective Wave (C), not a trend reversal unless momentum and structure confirm.
🛑 Invalidation
A sustained weekly close below the Wave (B) low (~145–150) invalidates the Wave (C) thesis.

Nifty 50 : The “Trump–Modi” Rally Meets Budget Reality 🇮🇳🇺🇸Right now, the Indian market feels like it’s standing at a very interesting crossroads — both technically and fundamentally. After the wild start to February 2026, what we’re seeing looks more like a relief rally trying to fight against stretched valuations.
From Budget Shock to Trade Deal Pop
Just a few days back, sentiment was terrible.
The Union Budget’s surprise hike in STT on Futures and Options (0.05% and 0.15%) caught traders completely off guard. That one move alone wiped out nearly ₹10 lakh crore in market cap in a single session. The market was in full panic mode.
But then came the twist.
The “Trump–Modi” trade deal on Feb 2 flipped the script overnight.
The U.S. cut reciprocal tariffs on Indian goods from a brutal 50% to 18%, and in return, India agreed to shift energy imports toward the U.S., committing nearly $500 billion in energy and tech deals.
That was enough to light a fire under the market. Nifty responded with one of its strongest single-day moves, jumping 2.55% and reclaiming the 25,700 zone. Pure relief rally.
But I’m Not Chasing This Move Yet
Even with all the excitement, I don’t think this is the time to blindly chase green candles.
The chart still suggests we might need some time-wise consolidation before any serious attempt at new all-time highs.
Key points of concern :
IT is dragging badly. While textiles and gems are flying, Nifty IT is down almost 5% thanks to H-1B fee hikes and weakness in U.S. tech. That’s a heavy index weight to ignore.
Valuations are stretched. Without stronger earnings support, this rally could easily lose steam near the 26,000–26,100 supply zone.
RBI risk ahead. The Feb 6 MPC meeting is key. A rate cut is unlikely, but the tone matters. If the RBI isn’t dovish enough, sentiment can cool quickly.
My Take
For now, I’d rather stay patient.
This move still feels more like a relief bounce than the beginning of a clean, sustainable breakout. I’d rather see some stability and a proper base form before getting aggressive with fresh positions. We can even expect a move to fill the gap formed during the relief rally.
Right now, the moving averages are still in a bearish crossover, which tells me the broader structure hasn’t fully turned bullish yet. Ideally, I want to see the 20-day EMA cross back above the 50-day EMA and, more importantly, the index sustaining above those levels. That kind of strength would give more confidence that the bullish momentum is real and not just a short-term pullback rally.
Until that happens, it’s better to step back, stay patient, and reassess rather than forcing trades.
📢📢📢
If my perspective changes or if I gather additional fundamental data that influences my views, I will provide updates accordingly.
Thank you for following along with this journey, and I remain committed to sharing insights and updates as my trading strategy evolves. As always, please feel free to reach out with any questions or comments.
Other posts related to this particular position and scrip, if any, will be attached underneath. Do check those out too.
Disclaimer : The analysis shared here is for informational purposes only and should not be considered as financial advice. Trading in all markets carries inherent risks, and past performance is not indicative of future results. It’s essential to conduct your own research and assess your risk tolerance before making any investment decisions. The views expressed in this analysis are solely mine. It’s important to note that I am not a SEBI registered analyst, so the analysis provided does not constitute formal investment advice under SEBI regulations.

BITCOIN at High-Timeframe Demand: Reaction Zone in Play!When I look at this chart, I’m not seeing fear or structural damage.
I’m seeing price doing exactly what it should do after a distribution phase , revisiting demand and slowing down.
Bitcoin has come back into a clearly marked high-timeframe demand / reaction zone . This is not a random level. This is an area where price has previously flipped structure and attracted strong participation.
What stands out to me on the chart:
Price is holding above a major high-timeframe support , not slicing through it. That tells me sellers are no longer aggressive at these levels.
The current zone is labeled as a planned accumulation area (not FOMO) . Price is reacting here instead of accelerating lower, that’s important.
Downside risk is clearly defined with a structure invalidation level below demand. As long as that level holds, structure remains intact.
Upside targets are logical and sequential , starting from a reaction high, followed by range expansion, and then higher-timeframe resistance.
The psychology behind this phase:
This is the part of the market where most people feel uncomfortable.
Price isn’t exciting. It’s not trending fast. It’s just… sitting.
But that’s usually how strong moves begin.
If Bitcoin were truly weak, it wouldn’t pause here, it would break cleanly below demand.
So far, it hasn’t.
That tells me the market is evaluating value , not panicking.
My approach here is simple:
I don’t chase price away from demand.
I don’t panic inside support.
I observe how price behaves at this zone and let the market show its hand.
As long as price holds above the demand zone, reactions from here remain valid.
Only a clean acceptance below the invalidation level would change this view.
Until then, this is a patience zone .
And patience, more often than prediction, is what gets paid in this market.
Disclaimer:
This analysis is for educational purposes only. Not financial advice. Always manage risk and trade according to your own plan.

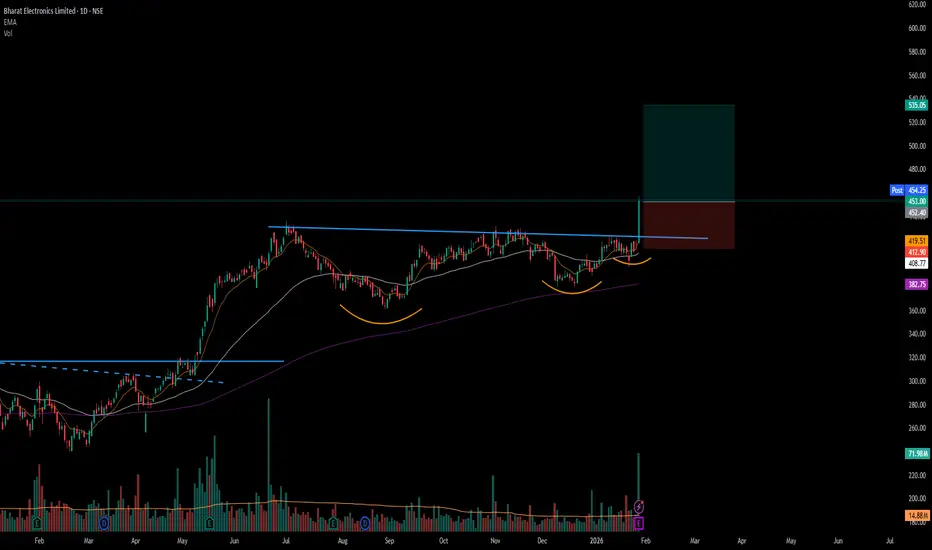
BEL : High-Quality Setup Despite Market Weakness📊 Technical Catalysts :
This is a perfect VCP structure with a clean breakout supported by strong volume, clearly indicating institutional interest. The stop loss is well placed below the basing formation, keeping risk structurally defined. The 20 EMA crossing above the 50 EMA further confirms a bullish trend shift.
EPS and Sales are continuously increasing for the past few quarter. The only dip was in June and this is not a stock specific event but a market wide scenario.
🏭 Fundamental Catalysts :
Good Results ; EPS and Sales are continuously increasing for the past few quarter. The only dip was in June and this is not a stock specific event but a market wide scenario.
Q3 Beat: Net profit grew 20.4% YoY (₹1,590 Cr), comfortably beating street estimates. Revenue execution is at an all-time high.
The EU FTA Factor: The "Mother of All Deals" signed on Jan 27 opens up a $750B market for Indian defense electronics. BEL is the primary beneficiary as it scales up exports to European nations looking to de-risk from China/Russia.
Budget 2026 Speculation: With the Union Budget on Feb 1, the market is front-running a likely increase in defense capital outlay.
Even though the broader market is showing signs of weakness, the confluence of strong technical structure, volume-backed breakout, moving-average crossover, and improving fundamentals provides enough confidence to take this trade, while still maintaining disciplined risk management with a standard 1% risk per trade.
📢📢📢
If my perspective changes or if I gather additional fundamental data that influences my views, I will provide updates accordingly.
Thank you for following along with this journey, and I remain committed to sharing insights and updates as my trading strategy evolves. As always, please feel free to reach out with any questions or comments.
Other posts related to this particular position and scrip, if any, will be attached underneath. Do check those out too.
Disclaimer : The analysis shared here is for informational purposes only and should not be considered as financial advice. Trading in all markets carries inherent risks, and past performance is not indicative of future results. It’s essential to conduct your own research and assess your risk tolerance before making any investment decisions. The views expressed in this analysis are solely mine. It’s important to note that I am not a SEBI registered analyst, so the analysis provided does not constitute formal investment advice under SEBI regulations.

APLAPOLLO : VCP Breakout with Fundamental ConfirmationInitiated a long position in APLAPOLLO following a high-conviction breakout from a multi-month Volatility Contraction Pattern (VCP). Although the price is currently extended from the 20- and 50-day EMAs, the structural strength of the breakout suggests the beginning of a fresh leg in the uptrend.
From a fundamentals perspective, the company continues to deliver strong and consistent sales and EPS growth, reinforcing its positioning as a proxy for India’s infrastructure-led growth cycle.
To manage the risk associated with being extended from the moving averages, I’ve opted for a wider stop-loss, allowing room for short-term volatility or a potential retest of the breakout zone. This approach gives the trade sufficient breathing space while the moving averages gradually catch up to price.
From a broader market standpoint, the recent ~10% correction in ITC following the government’s cigarette tax announcement has created temporary index-level pressure on the Nifty 50. However, this has triggered a clear sectoral rotation rather than broad-based weakness. Capital is rotating out of regulatory-impacted FMCG names and into high-growth industrial leaders like APL Apollo.
Given its insulation from regulatory shocks and its direct linkage to domestic capex growth, APL Apollo is exhibiting strong relative strength even as the broader market remains range-bound.
Initiated the position with 1% risk.
📢📢📢
If my perspective changes or if I gather additional fundamental data that influences my views, I will provide updates accordingly.
Thank you for following along with this journey, and I remain committed to sharing insights and updates as my trading strategy evolves. As always, please feel free to reach out with any questions or comments.
Other posts related to this particular position and scrip, if any, will be attached underneath. Do check those out too.
Disclaimer : The analysis shared here is for informational purposes only and should not be considered as financial advice. Trading in all markets carries inherent risks, and past performance is not indicative of future results. It’s essential to conduct your own research and assess your risk tolerance before making any investment decisions. The views expressed in this analysis are solely mine. It’s important to note that I am not a SEBI registered analyst, so the analysis provided does not constitute formal investment advice under SEBI regulations.

Automotive Axles - ATH Breakout - Investment Ideas#Automotive Axles Limited - Technical Analysis
Current Price: 1,790.80
#Breakout & Retest = Opportunity
#Technical Setup
Strategy: Swing to Short Term Trade
✅ **ATH Breakout + Retest** - Successfully retested breakout zone
✅ **Higher High Formation** - Clear uptrend structure
✅ **EMAs Sorted** - Bullish alignment confirmed
✅ **Trendline Breakout** - Long-term resistance conquered
#Key Levels
Support: 1,520 (Tight SL) | 1,504 (Major support)
Swing Targets:
- T1: 2,078
- T2: 2,189
- T3: 2,284
Short-Term Targets:
- T1: 2,546
- T2: 2,800
- T3: 2,933
- Grand T4: 3,125
#tradesetup
Entry: Current levels (1,790 - 1,800)
Stop Loss: 1,520 (daily closing basis)
Risk-Reward: 1:3+ (excellent)
Timeframe: 2-6 months
Disclaimer: For educational purposes only. Not investment advice. Trading involves substantial risk. Consult a SEBI-registered financial advisor before making investment decisions. Past performance doesn't guarantee future results.
#AutomotiveAxles #SwingTrading #BreakoutTrading #TechnicalAnalysis #NSE #AutoStocks #ShortTermTrading #StockMarket #ATHBreakout #IndianStocks

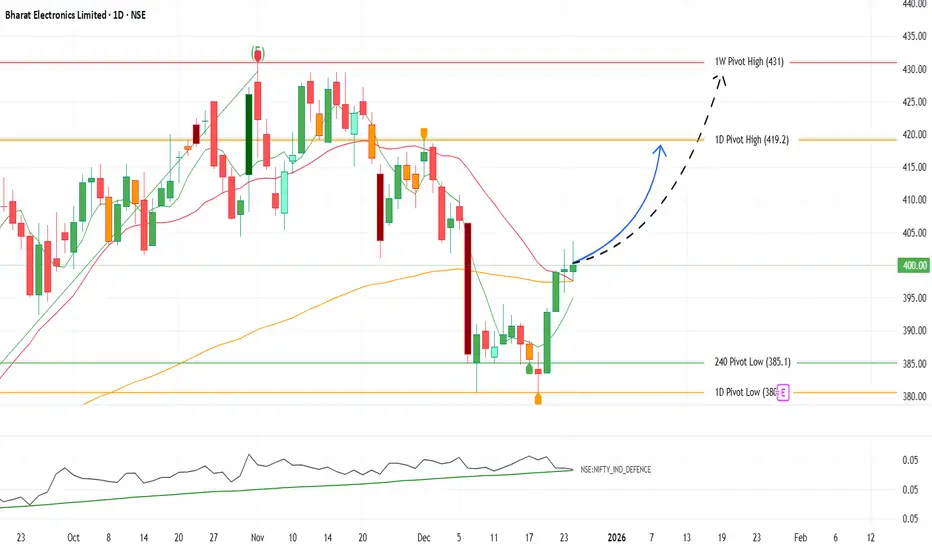
BEL – Setting Up for a 5% Move-Swing TradeBEL – Setting Up for a 5% Upside Move 🚀
BEL has taken strong support near ₹385–388 and is now reclaiming key moving averages with improving momentum. With the upcoming Union Budget expected to favor Defence spending, sentiment & flows remain supportive.
📌 Trade View
CMP: ~₹400
Targets: ₹420 (near-term), ₹431 (extendable)
Support: ₹388
Stoploss: ₹382 (strict)
💡 Why?
Strong bounce from key demand zone
Reclaiming trend levels + improving structure
Budget tailwinds + Defence sector strength
Trend intact. Dips buying. Ride the move! 🐊🔥
Bharat Electronics Ltd (BEL) – Bullish Structure BreakoutNSE:BEL
🔹 Technical View
Price has decisively broken above a major supply / resistance zone (~₹428–432) after multiple rejections in the past.
Strong bullish momentum candle indicates institutional participation and demand dominance.
Previous resistance now likely to act as strong support on any pullback.
Structure shows higher highs & higher lows, confirming an ongoing uptrend.
Immediate levels to watch:
Support: ₹428–420
Upside potential: ₹460 → ₹480 (positional)
🔹 Volume & Price Action
Breakout supported by healthy volume expansion, validating the move.
No major selling pressure visible near breakout zone so far.
🔹 Fundamental View
BEL is a Navratna PSU and a key player in defence electronics.
Strong order book driven by:
Defence modernization
Indigenous manufacturing (Make in India / Atmanirbhar Bharat)
Consistent revenue visibility, healthy margins, and improving ROE.
Virtually debt-free balance sheet adds financial stability.
🔹 Future Growth Prospects
Long-term beneficiary of India’s rising defence spending.
Increasing focus on:
Radar systems
Electronic warfare
Missile & naval electronics
Export opportunities and private-defence collaboration act as additional growth triggers.
Well-positioned for sustainable compounding over the next few years.
🔹 Conclusion
Technically strong breakout + fundamentally robust business.
Suitable for positional & long-term investors on dips near support.
Trend remains bullish as long as price sustains above ₹420–428 zone.
==============
⚠️ Disclaimer:
==============
This content is shared strictly for educational and informational purposes.
We are not SEBI-registered investment advisors or analysts.
The views expressed are personal opinions, based on publicly available data and market observations.
Please consult a SEBI-registered investment advisor before taking any investment or trading decisions.
Any actions taken based on this content are entirely at your own risk and responsibility.
========================
Trade Secrets By Pratik
========================

#BEL - VCP BreakOut in Daily Time Frame Script: BEL
Key highlights: 💡⚡
📈 VCP BreakOut in Daily Time Frame
📈 Volume spike during Breakout
📈 Base BreakOut
📈 RS Line making 52WH
📈 MACD Crossover
⚠️ Important: Market conditions are BAD, Avoid entering any Trade. Protect Capital Always
⚠️ Important: Always Exit the trade before any Event.
⚠️ Important: Always maintain your Risk:Reward Ratio as 1:2, with this RR, you only need a 33% win rate to Breakeven.
✅ Boost and Follow to never miss a new idea!✅
Disclaimer: I am not SEBI Registered Advisor. My posts are purely for training and educational purposes. Not a BUY or SELL recommendation.
Eat🍜 Sleep😴 TradingView📈 Repeat 🔁
Happy learning with MMT. Cheers!🥂
#DCBBANK - BreakOut in DTF with Volume Script: DCBBANK
Key highlights: 💡⚡
📈 C&H BreakOut in Daily Time Frame
📈 Volume spike during Breakout
📈 Base BreakOut
📈 RS Line making 52WH
📈 MACD Crossover
BUY ONLY ABOVE 200 DCB
⏱️ C.M.P 📑💰- 199.62
🟢 Target 🎯🏆 – 12%
⚠️ Stoploss ☠️🚫 – 6%
⚠️ Important: Market conditions are BAD, Avoid entering any Trade. Protect Capital Always
⚠️ Important: Always Exit the trade before any Event.
⚠️ Important: Always maintain your Risk:Reward Ratio as 1:2, with this RR, you only need a 33% win rate to Breakeven.
✅ Boost and Follow to never miss a new idea!✅
Disclaimer: I am not SEBI Registered Advisor. My posts are purely for training and educational purposes. Not a BUY or SELL recommendation.
Eat🍜 Sleep😴 TradingView📈 Repeat 🔁
Happy learning with MMT. Cheers!🥂

Triangle Contraction Symphony: Hidden Supports, Inverted H&SWitness the mesmerizing dance of price action in this chart masterpiece. A pristine triangle contraction pattern emerges, bounded by a supportive yellow trendline below and a red counter-trendline above, perfectly channeling price within tightening bounds.
Layered hidden dotted support/resistance lines add depth, illustrating how price meticulously respects each level—time and again.
Culminating in a textbook inverted head and shoulders formation, this setup showcases contraction elegance at its finest.
Purely educational: Reliving how these levels held in the past. No directional bias here—just the raw beauty of price action precision.
Disclaimer: This post is for educational purposes only, demonstrating historical price action behavior and level interactions. No directional bias or trading recommendations are implied. Past performance is not indicative of future results. Trade at your own risk.

Intraday Trading vs. Swing Trading: A Detailed Comparison1. What Is Intraday Trading?
Intraday trading, also known as day trading, involves buying and selling financial instruments within the same trading session. All positions are closed before the market closes, and no trades are carried overnight.
Intraday traders profit from small price fluctuations using high volume, leverage, and precise timing. The focus is on short-term momentum, liquidity, and volatility.
Key Characteristics of Intraday Trading
Trades last from a few seconds to a few hours
No overnight risk
High frequency of trades
Requires continuous screen monitoring
Strong dependence on technical indicators
Sensitive to news and market sentiment
2. What Is Swing Trading?
Swing trading aims to capture short- to medium-term price swings over several days to a few weeks. Positions are held overnight and sometimes across market cycles.
Swing traders rely on trend analysis, support and resistance levels, and market structure rather than minute-to-minute price action.
Key Characteristics of Swing Trading
Trades last from 2 days to several weeks
Positions are held overnight
Lower trade frequency
Less screen time required
Combination of technical and fundamental analysis
Focus on broader market trends
3. Time Frame and Trade Duration
Intraday Trading
Time frames used: 1-minute, 5-minute, 15-minute charts
Trades aim to capture quick price movements
High pressure due to fast decision-making
Traders must act instantly on signals
Swing Trading
Time frames used: Daily, 4-hour, and weekly charts
Trades allow time for trends to develop
More patience required
Decisions can be planned after market hours
4. Capital Requirement and Leverage
Intraday Trading
Often requires higher capital
Leverage is commonly used
Brokers offer margin benefits for intraday trades
Small adverse moves can cause quick losses
Swing Trading
Lower leverage compared to intraday
Less dependence on margin
Suitable for traders with moderate capital
Lower risk of forced liquidation
5. Risk Exposure and Volatility
Intraday Trading Risks
Sudden price spikes
Slippage during high volatility
Emotional stress due to rapid price movement
Overtrading risk
Swing Trading Risks
Overnight gap risk
News and earnings impact
Broader market risk
Requires wider stop-losses
Despite overnight risk, swing trading often has better risk-to-reward ratios than intraday trading.
6. Profit Potential and Consistency
Intraday Trading
Smaller profits per trade
Requires many successful trades for consistency
High transaction costs (brokerage, taxes)
Suitable for traders seeking daily income
Swing Trading
Larger profit targets
Fewer trades, higher quality setups
Lower transaction costs
Better suited for wealth building
7. Technical Analysis Tools Used
Common Intraday Indicators
VWAP (Volume Weighted Average Price)
Moving Averages (9, 20 EMA)
RSI (short-period)
MACD (fast settings)
Order flow and volume profile
Common Swing Trading Indicators
Support and resistance
Fibonacci retracement
Trendlines and channels
RSI (14-period)
Moving averages (50, 100, 200)
Swing traders rely more on price action and structure, while intraday traders focus on speed and momentum.
8. Psychological Demands
Intraday Trading Psychology
High stress and pressure
Requires emotional discipline
Fear and greed act faster
Quick recovery from losses is essential
Swing Trading Psychology
Requires patience and trust in analysis
Managing uncertainty overnight
Avoiding panic due to short-term noise
More suitable for calm personalities
Psychology often determines success more than strategy.
9. Lifestyle and Time Commitment
Intraday Trading
Full-time commitment
Requires presence during market hours
Not suitable for working professionals
Highly demanding mentally
Swing Trading
Part-time friendly
Ideal for professionals and students
Analysis can be done after market hours
Better work-life balance
10. Market Conditions Suitability
Intraday Trading Works Best When:
Market is highly volatile
Strong intraday trends exist
Liquidity is high
News-driven moves occur
Swing Trading Works Best When:
Clear trends are present
Markets are stable
Volatility is moderate
Broader market direction is defined
11. Taxation and Costs (General View)
Intraday trading usually attracts higher taxes and transaction costs
Frequent trading increases brokerage expenses
Swing trading is more tax-efficient due to lower turnover
(Tax rules vary by country and should be checked locally.)
12. Who Should Choose Intraday Trading?
Intraday trading is suitable for traders who:
Can dedicate full market hours
Handle high stress and fast decisions
Have strong discipline and execution skills
Prefer daily profit opportunities
13. Who Should Choose Swing Trading?
Swing trading is suitable for traders who:
Prefer planned trades
Have limited time during market hours
Aim for higher risk-reward trades
Want consistent growth with lower stress
14. Intraday vs. Swing Trading: Key Differences Summary
Aspect Intraday Trading Swing Trading
Holding Period Same day Days to weeks
Risk High, fast Moderate
Screen Time Very high Low
Leverage High Low
Stress Level High Moderate
Suitable For Full-time traders Part-time traders
Conclusion
Both intraday trading and swing trading are effective trading styles when practiced with discipline, proper risk management, and a clear strategy. Intraday trading offers faster feedback and daily opportunities but comes with higher stress and execution risk. Swing trading provides more flexibility, better risk-reward potential, and a balanced lifestyle but requires patience and the ability to handle overnight uncertainty.
There is no universally superior trading style. The best approach is the one that matches your personality, capital, time availability, and psychological comfort. Many successful traders even combine both styles, using intraday trades for short-term opportunities and swing trades for broader market moves.

INDIANB (Indian Bank)INDIAN BANK is showing a strong and constructive setup.
The stock recently made a fresh all-time high near 894, followed by a healthy pullback, which is a positive sign and often helps in building a stronger base for the next move. Importantly, the pullback was well-controlled, indicating limited selling pressure.
Price has now resumed its upward move and is trading above all key EMAs, reflecting continued strength and bullish momentum. The overall structure remains intact with higher highs and higher lows.
A decisive breakout from the current consolidation zone could open the door for a fresh upside move in the coming sessions.
Keep it in your watchlist.
✅ If you like my analysis, please follow me here as a token of appreciation :) in.tradingview.com/u/SatpalS/
📌 For learning and educational purposes only, not a recommendation. Please consult your financial advisor before investing.

BPCL : Trading the Confluence of Price Action & Macro TailwindsThe stock has been consolidating within a defined range over the past few weeks and has recently started forming a solid base. While the breakout volume isn’t a classic “God-candle,” price action continues to hold firmly above key moving averages, which is a constructive sign. That said, the price is somewhat extended from the EMAs, increasing the probability of a mean-reversion move. Hence, the stop loss needs to be placed wider rather than just below the basing structure.
The conviction behind this trade comes largely from the current Goldilocks macro environment we’re witnessing in early 2026. With global crude prices remaining comfortably low, BPCL is benefiting from strong marketing margins across petrol and diesel, supporting near-term earnings visibility.
On the fundamental side, a major catalyst is the Government’s LPG compensation package. BPCL is expected to receive a significant share of the ₹30,000 crore payout allocated to OMCs, which materially improves cash flows in H2 FY26. This inflow also acts as a strong deleveraging trigger, further strengthening an already improving balance sheet that has seen a steady decline in debt-equity levels over recent quarters.
So took this position with 1% risk on the net capital.
📢📢📢
If my perspective changes or if I gather additional fundamental data that influences my views, I will provide updates accordingly.
Thank you for following along with this journey, and I remain committed to sharing insights and updates as my trading strategy evolves. As always, please feel free to reach out with any questions or comments.
Other posts related to this particular position and scrip, if any, will be attached underneath. Do check those out too.
Disclaimer : The analysis shared here is for informational purposes only and should not be considered as financial advice. Trading in all markets carries inherent risks, and past performance is not indicative of future results. It’s essential to conduct your own research and assess your risk tolerance before making any investment decisions. The views expressed in this analysis are solely mine. It’s important to note that I am not a SEBI registered analyst, so the analysis provided does not constitute formal investment advice under SEBI regulations.

Reading Price action and Candlesticks like a PROI make educational content videos for Trading
In this video I have used charts older than 3 months to share my experience in the markets by sharing my thinking and chart skills - I hope you will learn something out of it

NIFTY – Bearish Structure Playing Out as AnticipatedIn my previous posts, I had clearly highlighted the possibility of a trend shift and warned that the ongoing price action could resolve to the downside. Over the last few sessions, price has started to play out exactly along those lines.
1. Bearish crossover (mini death cross)
A bearish crossover between the short-term and medium-term moving averages has now occurred. This was already anticipated and mentioned in earlier posts, and it marks a loss of bullish momentum after the ATH zone.
2. Clean breakdown below key support
Price has decisively broken below an important support and trendline structure. This confirms the bearish bias and strengthens the view that the broader market is under distribution rather than accumulation.
3. Next immediate support zone
The marked zone below acts as the next immediate support, where we may expect temporary consolidation or a technical bounce. However, unless there is strong follow-through buying, this should be treated cautiously.
4. Caution on bullish moves
Any signs of bullishness from here are likely to be temporary retracements, which may eventually trigger further sell-offs.
➡️ Avoid fresh swing longs until overall market sentiment turns favorable.
➡️ Existing positions should be managed with strict stop-losses and disciplined risk management.
The market is behaving in line with what was discussed earlier. Until structure changes and strength is proven, the risk remains on the downside. Patience and capital protection are more important than chasing trades in such phases.
📢📢📢
If my perspective changes or if I gather additional fundamental data that influences my views, I will provide updates accordingly.
Thank you for following along with this journey, and I remain committed to sharing insights and updates as my trading strategy evolves. As always, please feel free to reach out with any questions or comments.
Other posts related to this particular position and scrip, if any, will be attached underneath. Do check those out too.
Disclaimer : The analysis shared here is for informational purposes only and should not be considered as financial advice. Trading in all markets carries inherent risks, and past performance is not indicative of future results. It’s essential to conduct your own research and assess your risk tolerance before making any investment decisions. The views expressed in this analysis are solely mine. It’s important to note that I am not a SEBI registered analyst, so the analysis provided does not constitute formal investment advice under SEBI regulations.

JK TYREJK TYRE is consolidating near the previous Swing High Supply zone around 500–510 after a strong uptrend from lower levels. Instead of a sharp rejection, price is holding near resistance and contracting, while sustaining above the weekly 9 EMA. This price behaviour often points to supply absorption rather than distribution.
The stock continues to show leadership strength, with a high RS Rating (92 on the daily chart), indicating strong relative performance versus the broader market.
From a probability perspective:
> Sustained acceptance above the supply zone with expansion could support trend continuation.
> Failure to hold above key EMAs and acceptance below the range would suggest supply is still active.
On the fundamental side , the company has outlined a ₹5,000 crore capex plan over the next few years, focused on capacity expansion and long-term growth, which adds supportive context to the technical structure.
Keep it in your watchlist.
✅ If you like my analysis, please follow me here as a token of appreciation :) in.tradingview.com/u/SatpalS/
📌 For learning and educational purposes only, not a recommendation. Please consult your financial advisor before investing.

Hidden Channels & Fib Golden Zone : Beauty of Price ActionObservational Post only Showcasing how price action works using historical price points only
Observe how price elegantly respects this counter trendline on the weekly chart (red line), forging consistent lower highs through precise rejections. A subtle parallel channel lurks beneath, acting as a hidden guardian. Channels like these shield against fakeouts, confirming pure breakouts only when breached alongside key lines.
Shifting to the monthly view, the Fib retracement from swing low to high highlights the golden zone (50 to 61%, white shaded), a magnet for retracements where price often pauses or reverses with stunning symmetry.
This interplay reveals price action's beauty: layers of structure working in harmony, rewarding patient observers.
Disclaimer: This is for educational purposes only, showcasing historical price action observations. Not financial advice. Always conduct your own analysis and manage risk appropriately.

BANK NIFTY - Technical Analysis Bank Nifty is showing an interesting setup on the weekly chart.
After breaking out above its previous all-time high, the index has started contracting in a tight range, indicating healthy consolidation.
On the daily timeframe, it continues to take support near the 9 EMA, and during minor dips, it has also reversed from the 20 EMA, reflecting strong buying interest.
If Bank Nifty breaks out of this range with momentum, the upside potential remains open, sky’s the limit.
In case of a pullback, watch these key support zones:
🟩 57,500 – first immediate support
🟩 57,160 – secondary support
🟩 56,600 – third support
🟩 56,000 – major support zone if deeper retracement occurs
Overall market structure is Bullish, and a bit more consolidation or a short pullback will only strengthen the base for a sustained breakout.
✅ If you like my analysis, please follow me here as a token of appreciation :)
in.tradingview.com/u/SatpalS/
📌 For learning and educational purposes only, not a recommendation. Please consult your financial advisor before investing.
