Option Trading📘 Option Trading
Option Trading is a type of trading where you buy and sell contracts called options, instead of directly buying stocks. These contracts give you the right (but not the obligation) to buy or sell an asset at a set price within a specific time.
There are two main types:
🟢 Call Option – Right to buy the asset
🔴 Put Option – Right to sell the asset
Traders use options to:
📈 Make profits from price movements
🛡️ Hedge their investments
💰 Generate consistent income
⚖️ Manage risk with limited capital
Options are powerful because they offer leverage (small investment, big potential), but they also come with higher risks if not used carefully.
📌 In simple words:
Option Trading lets you bet on whether a stock will go up 📈 or down 📉, without owning it — and helps smart traders manage risk and reward like a pro.
Swingtrading

Learn Advanced Institutional Trading🎓 Learn Advanced Institutional Trading
Advanced Institutional Trading is the high-level skill of trading financial markets the way professional institutions do — using big data, smart tools, and strategic decision-making to consistently win in the market. 💼📊
Learning this means going beyond basic charts or trendlines. It’s about understanding how big money moves, and how to:
🧠 Read institutional order flow
📉 Trade with algorithms and dark pools
📈 Use volume, liquidity zones & smart money indicators
🛡️ Apply institutional-level risk management
⚙️ Trade options, futures, and other derivatives at scale
💬 Interpret economic data like banks and funds do
You’ll learn to:
Identify entry and exit points based on institutional footprints
Use macro and micro market analysis
Build a trading system with logic and consistency
React to live news, earnings, and global events the way hedge funds do
📌 In simple words:
Learning Advanced Institutional Trading gives you the mindset, tools, and strategies used by the top 1% of traders — so you can trade smart, calculated, and professional just like the big players.

Master Institutional Trading🎯 Master Institutional Trading
Master Institutional Trading means learning to trade like the top financial institutions – with precision, strategy, and data-driven decisions. It’s the highest level of trading where you think and act like banks 🏦, hedge funds 📊, and investment firms 💼.
This mastery involves:
🔍 Understanding how smart money moves
📈 Analyzing volume, liquidity zones, and order flow
💹 Executing large trades without impacting the market
🛡️ Applying risk-controlled option & futures strategies
🧠 Using advanced tools, indicators, and market depth
🔄 Adapting to news, events, and institutional triggers
To master this skill, traders must develop:
📊 Strong technical + fundamental analysis
🧘 Discipline and emotion control
🧾 A solid, backtested trading system
💬 Knowledge of macroeconomic impacts
🧮 Command over greeks, derivatives, and hedging
📌 In simple words:
Mastering Institutional Trading means stepping into the shoes of the pros – learning how the big money operates, and trading with structure, edge, and confidence.

Technical Class📚 Technical Class
A Technical Class in trading is a structured learning program focused on teaching you how to read and analyze price charts 📈, indicators 📊, and market patterns 🔁 to make smart and profitable trading decisions.
In a good technical class, you’ll learn to:
🔍 Read candlestick charts like a pro
🧱 Identify support & resistance levels
📉 Spot breakouts, fakeouts, and trend reversals
🔄 Use moving averages, RSI, MACD, and volume tools
🧠 Understand market psychology through patterns
📌 Time your entry and exit points with precision
⚖️ Combine multiple indicators for confirmation
These classes are perfect for:
🚀 Beginners who want to build a strong foundation
📈 Intermediate traders ready to sharpen their skills
🎯 Anyone looking to trade based on logic, not emotion
📌 In simple words:
A Technical Class teaches you how to "read the market" — using charts, patterns, and indicators — so you can trade with confidence, clarity, and strategy.

Trading Master Class With Experts🎓 Trading Master Class With Experts
The Trading Master Class With Experts is a premium learning experience designed to take your trading skills to the next level by learning directly from market professionals – traders who’ve been in the game, seen the cycles, and built real strategies that work. 💼📈
In this expert-led masterclass, you will:
📊 Learn From Real Market Experts
🧠 Gain insights from institutional traders, analysts, and full-time professionals
🔍 Watch live trading sessions, analysis, and decision-making
🎯 Understand the logic behind high-probability trades
🔄 See how pros adapt to changing markets in real time
🔧 Master Advanced Trading Skills
📉 Deep dive into technical and fundamental analysis
💹 Learn options, futures, and multi-asset strategies
📍 Build a risk-managed trading system from scratch
⚙️ Use institutional tools: order flow, volume profiles, and price action
🛡️ Get Mentorship & Community
👥 Join a private trading community
💬 Get answers in live Q&A sessions
📈 Share progress, refine skills, and grow with a pro network
📌 In simple words:
The Trading Master Class With Experts is where serious traders learn the real rules of the game — directly from those who play it at the highest level.

Small Account Scalping / Challenge Trading🔍 What is Small Account Scalping?
Scalping means taking very short, quick trades — entering and exiting the market in a matter of seconds to a few minutes — to capture small price moves.
Now combine this with a small account — typically ₹1,000 to ₹10,000 (or $100 to $500). You're looking at a trading style where:
Tiny profits are taken quickly
High discipline and speed are critical
Risk-to-reward ratios are tight
Compounding is the core idea (small wins stack up)
Scalping with a small account is not just about earning big money quickly — it's often done as a "challenge" to prove skill, build discipline, or simply to show that trading isn’t about how much money you have, but how well you manage it.
🎯 What is Challenge Trading?
Challenge Trading is when a trader publicly sets a goal, like:
Turning ₹5,000 into ₹50,000
Growing $100 to $1,000 in 30 days
Doubling capital in 10 trades
These challenges are usually:
Documented daily (on YouTube, Telegram, or Instagram)
Done with full transparency
Focused on scalping or intraday setups
Built around strict rules and money management
Why do people do it?
For credibility
To learn discipline
To inspire beginners
To prove skill without needing big capital
📉 Why Most Traders Fail with Small Accounts
Let’s be honest — 90% of small account traders blow their capital within days or weeks.
Here’s why:
1. Overleveraging
Trying to turn ₹1,000 into ₹5,000 in one day? Most traders overtrade, use max quantity, and take unnecessary risks.
2. No Risk Management
They don’t respect stop-losses. One bad trade wipes 50% or more of their account.
3. Emotional Trading
Small capital = High emotions. Losing ₹300 from ₹1,000 hurts more than ₹3,000 from ₹1,00,000.
4. No Consistency
They jump from strategy to strategy. From breakout trading to option buying to indicator-based setups — nothing sticks.
5. Trying to Get Rich in One Day
Small accounts are not magic lamps. Trying to “flip money” quickly always backfires without a strong base strategy.
✅ How to Actually Win at Small Account Scalping
Let’s now focus on how to do it right — step by step.
✳️ Step 1: Choose the Right Market Instrument
For scalping with small capital, you want:
High liquidity (easy entries & exits)
Fast movement
Low capital requirement
Some good choices:
Index options like Nifty/BankNifty Weekly
FinNifty (Tuesday expiry)
Micro lots in Futures (if margin allows)
USDT/INR scalping on crypto exchanges (Binance, CoinDCX)
Stocks like Reliance, Tata Motors, SBIN – but be cautious
Avoid:
Illiquid stocks
High lot-size contracts
Multi-leg option strategies with high cost
✳️ Step 2: Pick a Scalping Setup That Works
You don’t need 10 strategies. Just 1-2 that work well on a small timeframe.
Examples:
Breakout on 1-min chart
Mark consolidation
Wait for breakout candle with volume
Enter with tight SL, book in 1:1.5 or trail
VWAP Rejection Entry
Wait for price to test VWAP
If rejected, enter in the opposite direction
Small risk, quick reward
Fakeout Trap
Market fakes breakout → reverses
Enter with confirmation of reversal
Common in BankNifty scalping
News-Based Scalping
RBI decisions, GDP data, Budget day
Extreme volatility → use strict stop-loss
✳️ Step 3: Master Position Sizing
Golden rule: Never lose more than 2-3% in one trade.
With ₹2,000 capital:
Risk max ₹40–₹60 per trade
Use option buying, not futures
Focus on quantity control
If you're using 50% of capital in one trade, you’re doing it wrong. That’s not scalping — that’s gambling.
✳️ Step 4: Use a Simple Tool Setup
Keep your charts clean.
Timeframe: 1-min or 3-min
Indicators: VWAP, EMA (9 or 20), Volume
Levels: Draw basic support/resistance
Avoid: Overloaded charts with 6 indicators
✳️ Step 5: Take Only 1–3 Trades a Day
In small account scalping, overtrading kills faster than losing.
Max 3 trades per day
Win 2 out of 3 = Green Day
Lose 2 = Stop trading
Stick to the plan. Live to trade another day.
✳️ Step 6: Focus on % Growth, Not ₹ Profit
Don’t compare yourself to traders making ₹20K/day
If you make ₹150 on ₹2,000 → that’s 7.5% gain
Make 5% a day for 20 days = 100% monthly compounding!
Small wins matter. They build discipline, confidence, and capital.
🧠 Psychology Behind Challenge Trading
To win the small account game, your mindset matters more than your strategy.
Mental Rules:
Treat every rupee as if it’s ₹1,000
Never chase revenge trades
Accept red days calmly — they’re part of the game
Celebrate consistency more than profit
📌 Tracking Your Progress
Make a Trading Journal:
Entry/Exit time
Setup used
Why you entered
How you felt
Profit/Loss
Over 30 days, this builds emotional and strategic control.
🚫 Mistakes to Avoid in Small Account Scalping
❌ Averaging in loss
❌ Trading without stop-loss
❌ Copying random Telegram tips
❌ Overtrading after losses
❌ Ignoring brokerage and slippage
❌ Expecting daily profits
🏁 Final Words: Is Small Account Scalping Worth It?
✅ YES — if:
You want to build confidence and discipline
You want to master trading with risk management
You like fast-paced, quick decision-making
❌ NO — if:
You’re in a hurry to make big profits
You trade emotionally
You don’t journal your trades or follow structure
It’s a journey — not a race.
With patience and process, your ₹2,000 account can one day fund your ₹2 Lakh trading journey.
Meme Stocks & Retail MomentumIn the last few years, the world of stock markets has witnessed something unusual. Stocks of struggling companies suddenly skyrocketed, not because of strong fundamentals or big institutional investments, but because of... memes, social media posts, and retail trader hype.
Welcome to the world of Meme Stocks and Retail Momentum.
This isn’t traditional investing. It’s the new-age, internet-powered way of moving markets — often driven more by emotion and community than by earnings reports or financial analysis.
They are not driven by traditional factors like strong balance sheets, industry leadership, or earnings growth. Instead, they’re driven by community hype and retail investor activity.
Key Features of Meme Stocks:
Sudden, dramatic price surges 🚀
Lots of trading activity by small/retail investors
Heavy buzz on social media & forums
High volatility (prices can jump or crash in hours)
Often targeted by short-sellers
🎯 Real-Life Examples of Meme Stocks
1. GameStop (GME) – USA
In early 2021, GME went from $17 to nearly $483 in weeks. Why?
It was heavily shorted by hedge funds.
Reddit users decided to push back and caused a short squeeze.
Retail investors coordinated buying, sending the price to the moon.
This was a social movement, not just a trade. It became a battle between “small traders” and “Wall Street giants.”
2. AMC Entertainment (AMC)
A struggling cinema chain during COVID saw its stock go up over 1000% in months.
Why?
Meme hype
Reddit army
FOMO (Fear of Missing Out)
3. Bed Bath & Beyond, Blackberry, Nokia
All had their moment as meme stocks even if their business fundamentals were weak.
4. Indian Examples
While India hasn’t seen the exact same meme stock culture, we’ve seen similar retail momentum in:
Zee Entertainment (after merger news & social buzz)
Vodafone Idea (VI) – due to social campaigns and hopes
IRCTC – when people piled in during rapid rallies
👥 What is Retail Momentum?
Now let’s talk about retail momentum — the force behind meme stocks.
Retail Momentum means:
A sudden inflow of buying (or selling) from small, individual investors, usually following trends or hype.
This momentum is usually:
Fast-moving
Emotional
Trend-following
Influenced by influencers, YouTubers, or social forums
Retail traders often follow:
WhatsApp groups
YouTube tips
Trending stocks on Twitter
Telegram pump groups
When thousands (or lakhs) of people chase the same stock, price moves dramatically — even if there's no news or earnings change.
🤖 How Social Media Creates Market Movement
Social media has turned into a financial battleground.
Here’s how a meme stock or retail wave starts:
One user posts a chart, theory, or meme on Reddit, X, or Telegram.
It goes viral. Thousands like or comment.
YouTubers make videos explaining how it can go “5x”.
Traders start piling in.
Price moves rapidly.
News channels pick it up.
Even more retail investors join.
The price spikes even further.
At this point, the stock is not rising on logic. It's rising on human emotion and network effect.
📈 Why Do Meme Stocks Go Up So Fast?
Short Squeezes
Hedge funds or big players short the stock.
Retail investors aggressively buy.
Short sellers are forced to cover — which pushes the price up further.
FOMO (Fear of Missing Out)
When people see others making 100%, 200% in days, they panic and enter at any price.
Retail Buying Power
Today, thanks to apps like Zerodha, Robinhood, Upstox, Groww — it’s easy to buy a stock.
Even a small investor can join in with ₹500.
Community Psychology
People feel like part of a movement.
They hold, buy, and even defend the stock online — often calling it “diamond hands.”
💣 Why Do Meme Stocks Crash?
No Fundamental Support
Eventually, reality hits. The stock isn’t worth the inflated price.
Profit Booking
Early traders book profits → price falls → panic spreads → others sell.
Regulatory Actions
Exchanges might restrict buying (like Robinhood did in GME).
Dilution
Companies issue new shares to cash in on hype → lowers value per share.
🧠 Psychology Behind Meme Stocks
Meme stocks are a human behavior experiment in real-time.
They show:
The power of belief
Herd mentality
Rebellion against institutions
Internet unity
Addiction to risk and gambling thrill
It’s part social movement, part financial play, and part crowd psychology.
🧰 Tips for Trading Retail Momentum Stocks
Enter early or don’t enter at all
Don’t jump in when it's already trending on YouTube.
Use trailing stop-loss
Lock your profits as the stock climbs.
Book profits partially
Don’t wait for the “moon.” Sell in phases.
Avoid margin/leverage
You can be wiped out in one bad move.
Track social buzz
Use tools like Google Trends, Twitter hashtags, Reddit mentions.
Never invest your main capital
Treat it as a speculative side bet, not a long-term investment.
🏁 Final Thoughts: Meme Stocks Are a Mirror of Modern Markets
Meme stocks and retail momentum are not going away. They are part of the new-age investor culture:
Fast-paced
Emotionally charged
Social media influenced
Sometimes logical, often not
They’ve changed how people see the markets. Retail investors now know they can move prices. But with that power comes great risk.
If you want to explore meme stocks, do it with eyes wide open, a small budget, and full acceptance of the risk.

Macro-Driven Risk Planning🔍 What is Macro-Driven Risk Planning?
At its core:
Macro-driven risk planning means managing your investment or trading risks by keeping the larger economic environment in mind.
You don’t just look at a stock or a chart — you ask:
What's happening with interest rates?
Is inflation rising or falling?
What’s the government doing with taxes or spending?
Is the US dollar strong or weak?
What are central banks like the RBI or the Federal Reserve up to?
These macroeconomic factors can make or break entire trades, portfolios, and even industries. So macro-driven risk planning is about aligning your strategies with the economic environment.
🧠 Why Is This Important?
Let’s say you’re trading in India.
If the US increases its interest rates sharply:
Foreign investors might pull money out of Indian markets.
INR might weaken.
Stock market might fall due to FII outflows.
If you're not paying attention to this macro signal, you might be trading blindly — even if your technicals are perfect.
🏦 Key Macro Factors That Drive Risk
Here’s a list of major macroeconomic indicators that smart investors and institutions track:
1. Interest Rates
Central banks (like the RBI or US Fed) control this.
📈 Rising Rates: Borrowing becomes expensive → Business slows → Markets may fall.
📉 Falling Rates: Loans become cheaper → Business expands → Markets may rise.
How to plan risk:
If rates are going up, shift from high-growth, high-debt companies to safer sectors like FMCG, pharma, utilities.
2. Inflation
This measures how fast prices are rising.
Moderate inflation = Normal
High inflation = Dangerous for consumers
Deflation = Danger of recession
Indicators: CPI (Consumer Price Index), WPI (Wholesale Price Index)
Risk Planning Tip:
In high inflation, avoid sectors that depend on raw material prices (like auto, FMCG) and look at commodities or inflation-protected assets (like gold, real estate).
3. GDP Growth (Economic Output)
Gross Domestic Product shows if the economy is expanding or shrinking.
📈 Strong GDP = Business confidence = Higher earnings
📉 Weak GDP = Caution = Lower valuations
Risk Strategy:
During GDP growth, take on slightly higher risk with cyclical stocks (like infra, banks). During slowdown, shift to defensive sectors (like pharma, IT).
4. Currency Movements (INR/USD, etc.)
Currency strength/weakness affects:
Imports/Exports
FII flows
Commodity prices (like oil)
Example: If INR weakens, oil imports become costly → Impacts inflation → May lead to rate hikes.
Plan risk: Export-based sectors (IT, pharma) benefit from weak rupee. Importers (oil, aviation) suffer.
5. Fiscal and Monetary Policies
This includes:
Government budgets (fiscal policy) – Taxes, subsidies, spending
Central bank actions (monetary policy) – Rate changes, money supply
Risk View:
A budget with heavy borrowing = inflation pressure
A tight monetary policy = reduced liquidity in markets
Keep eyes on RBI speeches, Fed meetings, union budgets.
6. Global Events
Even if you only trade in India, global news affects you:
US elections
Crude oil prices
Geopolitical tensions (e.g. China-Taiwan, Russia-Ukraine)
Supply chain issues
US Non-Farm Payroll (NFP) data
Macro-risk planning = Staying alert to these changes.
7. Bond Yields
Especially US 10-year bond yield.
Rising yield = Risk-off = Equities may fall
Falling yield = Risk-on = Equities may rise
Foreign investors use this as a guide. It directly affects FII flows.
📘 Real-Life Example: Macro Risk in Action
Case: COVID-19 Pandemic (2020)
Global economy shut down
Interest rates slashed to zero
Stimulus packages announced
Investors moved money into gold, tech stocks, pharma
Smart traders did this:
Moved into digital, pharma, and FMCG stocks
Stayed away from travel, aviation, real estate
Watched central bank actions daily
Used hedges (like buying puts or moving to cash)
This is macro-driven risk planning in real-time.
⚖️ How to Build a Macro Risk Management Plan
Here’s a step-by-step structure anyone can follow:
Step 1: Define Your Risk Tolerance
Are you a short-term trader or long-term investor?
Can you handle volatility?
Do you rely on leverage or trade with cash?
This tells you how much room you have to play with.
Step 2: Track Macro Indicators Weekly
Use sites like:
RBI website for policy updates
Trading Economics for inflation, GDP, interest rates
Bloomberg, CNBC, or Twitter for global headlines
Set alerts for:
Fed meeting dates
India CPI, GDP, IIP
Crude oil updates
Step 3: Use Hedging Tools
Advanced traders use:
Options (buying protective Puts)
Inverse ETFs (for global markets)
Gold or commodities
Diversification (across sectors, geographies)
Step 4: Stay Flexible
Macro conditions change fast. Stay open to:
Rotating your portfolio
Sitting on cash during uncertain times
Changing strategies with data, not emotions
🧭 Conclusion: Think Bigger, Trade Smarter
Macro-Driven Risk Planning is about being proactive, not reactive.
Markets aren’t moved by charts alone. They’re driven by:
Central banks
Government decisions
Global events
Economic data
So when you plan your next trade or invest in a stock, ask yourself:
“Am I moving with the economic current — or fighting against it?”
The more you understand macro trends, the better you’ll manage your risks and grow consistently.
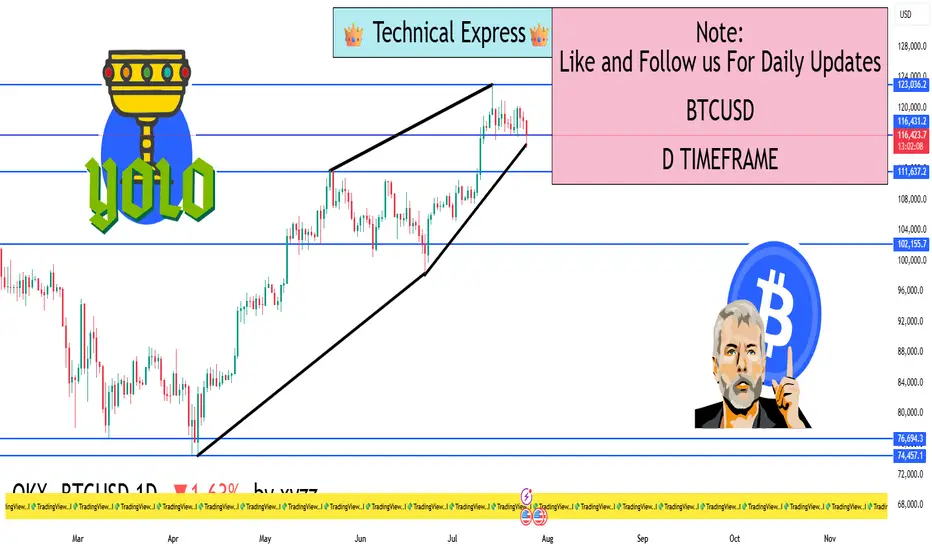
BTCUSD 1D Timeframe📈 BTC/USD 1D Timeframe Overview (as of Today)
Current Price: Around $116,100
Price Change: Down by approximately 2.1% from the previous close
Day’s High: Around $119,436
Day’s Low: Around $115,002
📊 Chart Analysis (1-Day Candle)
Each candle on the 1D chart represents one full day. Today’s candle shows:
Bearish Momentum: The candle is red, indicating sellers dominated.
Wick at Bottom: Suggests some buying pressure or support near the day's low.
Rejection from Highs: Price tried to go higher but failed, showing resistance near $119,400.
🔍 Key Support and Resistance Levels
Resistance Zone: $119,000 – $120,000 (recent highs)
Support Zone: $115,000 – $113,500 (demand area and previous consolidation)
If BTC breaks below the $115,000 support, it may test lower levels like $112,000 or $110,000. If it bounces, it could reattempt $120,000.
🧠 Technical Perspective (Daily View)
Trend: BTC is currently in a short-term pullback phase after a recent rally.
Structure: Higher lows are intact if it stays above $112,000, which suggests uptrend continuation.
Volume: Decreasing volume on red candles could mean weak selling — possible sign of reversal soon.
🔄 Daily Timeframe Strategy Insight
Swing Traders: Wait for bullish reversal candle or break above resistance to go long.
Breakout Traders: Watch if price breaks and closes above $120,000 for trend continuation.
Risk-averse Traders: Wait for confirmation of direction before entering (like bullish engulfing or hammer candle).
📉 Summary
BTC is showing short-term weakness but remains in a larger range.
$115,000 is the key short-term support, and $120,000 is the key resistance.
Watch for candle patterns, volume, and reaction at support/resistance zones.
BANKNIFTY 1D Timeframe📉 Bank Nifty – Daily Overview (as of July 25, 2025)
Opening Price: Around 57,170
Day’s High: Around 57,170
Day’s Low: Around 56,439
Closing Price: Approximately 56,520
Net Change: Down by around 545 points (–0.95%)
🕯️ Candlestick Pattern (1D Chart)
The daily candle is bearish with a long upper wick and small lower wick.
This indicates strong selling pressure from the opening level.
The index failed to hold the highs and reversed sharply during the session.
🔍 Key Technical Zones
Level Price Range
Support 56,500 – 56,400
Next Support 56,150 – 56,000
Resistance 57,200 – 57,300
Major Resistance 57,500 – 57,650
If Bank Nifty breaks below 56,400, it may slide further toward 56,000 or even 55,800.
A move above 57,300 may invite bullish momentum.
📊 Trend & Technical Outlook
Short-Term Trend: Bearish
Medium-Term Trend: Neutral to mildly positive (if above 56,000)
Price Structure: Lower highs are forming; a descending pattern is developing.
Volume Analysis: Increasing volume on red candles suggests sellers are active.
Indicators (general behavior):
RSI may be near 50–55 range — neutral zone.
MACD likely showing bearish crossover.
Moving averages are flat to slightly negative.
✅ Strategy Suggestions
For Swing Traders:
Look for a bullish reversal pattern near 56,400–56,150 zone for possible long entries. Avoid long positions until price shows strength above 57,200.
For Breakdown Traders:
Wait for a solid close below 56,400 with high volume. Target levels can be 56,150 and 55,800.
For Intraday Traders:
Expect a volatile range between 56,400 and 57,200. Trade breakouts or reversals near these levels with confirmation.
📌 Summary
Bank Nifty is currently weak, with clear selling from resistance levels.
It is trading near key support (56,500–56,400). If this zone breaks, expect further downside.
Bulls need to reclaim 57,200+ for any reversal signals.
Trend remains bearish in short term, neutral in medium term.

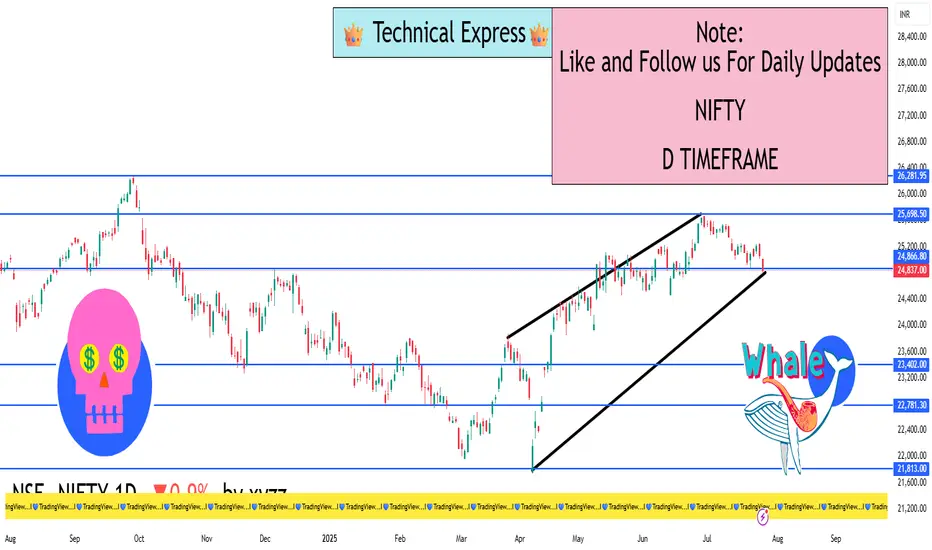
NIFTY 1D Timeframe📉 Nifty 1D Snapshot (as of July 25, 2025)
Previous Close: 25,062
Opening Price: 25,010
Intraday High: 25,010
Intraday Low: 24,806
Closing Price: 24,833
Change: Down by approximately 230 points (–0.9%)
🕯️ Candlestick Pattern (Daily Chart)
A clear bearish candle was formed today.
The index opened flat, tested the previous day’s low, and faced selling pressure all day.
Closing is near the day’s low, which shows weakness and no buying support at lower levels.
🔍 Support & Resistance Levels
Level Type Price Range
Immediate Resistance 25,000 – 25,050
Immediate Support 24,800 – 24,750
Next Support Zone 24,650 – 24,600
If Nifty breaks below 24,800, expect a move toward 24,650.
If it reclaims 25,000, a minor pullback or bounce could occur.
📊 Technical Overview
Short-Term Trend: Bearish
Medium-Term Trend: Neutral
Structure: Lower highs forming; prices struggling to hold key supports
Indicators (Typical Behavior):
RSI likely near 50 – neutral but leaning bearish
MACD may have crossed downward
Moving averages (like 5 & 20-day) likely showing bearish crossover
🧠 Market Sentiment Factors
Broad-based sectoral weakness led the fall – especially financials, IT, auto, and energy.
Major stocks like Reliance, HDFC Bank, Infosys, and Bajaj twins contributed heavily to the decline.
Investor mood remains cautious due to:
Weak earnings from select companies
Foreign investor outflows
Global uncertainty (interest rates, trade deals, etc.)
✅ Trading Strategy Insights
For Swing Traders:
Avoid long trades unless there’s a strong reversal candle from 24,750–24,800 zone.
Shorting near 25,000 resistance could offer low-risk entries.
For Intraday Traders:
Watch for consolidation between 24,800–25,000.
Play range until a breakout or breakdown occurs.
For Breakdown Traders:
A confirmed break below 24,750 can lead to quick dips toward 24,600 or lower.
📌 Summary
Nifty dropped 230 points, forming a strong bearish candle.
Bears are in control unless bulls reclaim 25,000+.
Support sits at 24,800, with downside potential toward 24,650–24,600 if broken.
Sentiment remains cautious; short-term trend is bearish.
Divergence Secrets📌 What is Divergence?
Divergence occurs when the price action of a security moves in the opposite direction of a technical indicator or momentum oscillator.
There are two main types:
Regular Divergence – Signals potential reversal
Hidden Divergence – Signals trend continuation
🔍 1. Regular Divergence (Reversal Signal)
Occurs when:
Price makes a higher high, but the indicator makes a lower high (bearish divergence)
Price makes a lower low, but the indicator makes a higher low (bullish divergence)
✳️ Example:
Bearish divergence: Price is rising, but RSI is falling → Possible upcoming downtrend.
Bullish divergence: Price is falling, but MACD is rising → Possible upcoming uptrend.
This tells you the momentum is weakening, even though price appears strong.
🔍 2. Hidden Divergence (Trend Continuation)
Occurs when:
Price makes a higher low, but the indicator makes a lower low → Bullish hidden divergence
Price makes a lower high, but the indicator makes a higher high → Bearish hidden divergence
Hidden divergence shows that momentum is aligning with trend direction and suggests continuation.
📈 Indicators to Spot Divergence
RSI (Relative Strength Index)
Best for spotting overbought/oversold and divergences.
MACD (Moving Average Convergence Divergence)
Great for visualizing momentum divergence.
Stochastic Oscillator
Good for short-term divergence.
On-Balance Volume (OBV)
Helps spot divergence using volume behavior.
CCI (Commodity Channel Index)
🔐 Institutional Secret: Volume Divergence
Institutions look for divergence between price and volume:
Price making higher highs but volume falling? Institutions might be distributing (smart money exiting).
Price making lower lows but volume rising? Could be accumulation.
This is often missed by retail traders!
✅ How to Trade Divergence (Checklist)
🔸 Entry Strategy:
Wait for divergence confirmation on a strong indicator (RSI/MACD)
Use candlestick reversal patterns near divergence zones
Align with support/resistance or trendlines
🔸 Stop-Loss:
Always place below/above recent swing low/high (depending on long or short)
🔸 Take-Profit:
Use Fibonacci levels, previous structure, or trend-based targets
⚠️ Common Mistakes
Trading divergence without price confirmation
Forcing divergence on weak or flat trends
Ignoring higher timeframe context
Using only one indicator
Always confirm with price structure, volume, and multi-timeframe analysis.
🎯 Pro Tip: Combine with Institutional Tools
Use Order Blocks + Divergence = Strong reversal signal
Combine Liquidity Zones + Divergence = Catch smart money traps
Divergence + Imbalance zones = Laser-precise entries.

Institutional Intraday option Trading🔶 What is Institutional Intraday Options Trading?
Institutional Intraday Options Trading is how big players (institutions) like hedge funds, proprietary trading firms, mutual funds, foreign institutional investors (FIIs), and domestic institutional investors (DIIs) actively trade in options markets within the same day to generate quick profits, manage large positions, or manipulate price movements in their favor.
Unlike retail intraday trading (which is usually based on tips, indicators, or scalping), institutional intraday options trading is based on:
Advanced option data (like OI, volume, IV)
Market structure and liquidity
Algo-based executions
Risk-adjusted strategies and fast decision making
Institutions don’t trade for fun or luck—they trade with purpose, plan, and size. Their presence in the market creates price movements, and learning to track their footprints gives retail traders a powerful edge.
🔶 Why Institutions Trade Options Intraday?
Institutions prefer intraday option trading because it allows them to:
✅ Manage Risk & Hedge Positions
Institutions often hold large equity/futures positions. Options allow them to hedge intraday volatility without disturbing their long-term positions.
✅ Scalp Based on Volatility and News
Events like RBI policy, Fed data, results, or global news create fast-moving markets. Institutions use intraday options to take advantage of volatility spikes.
✅ Generate Quick Alpha
Institutional traders are expected to generate consistent returns. Intraday option trades provide high leverage and faster capital rotation.
✅ Exploit Liquidity and Traps
Institutions use fake breakouts, premium decays, and short-covering rallies to trap retailers and make profit intraday.
📌 1. Premium Decay Strategy (Theta Game)
Objective: Sell options when implied volatility is high.
Institutions sell both call and put options (straddle or strangle) around key zones (like CPR, VWAP).
They collect premium and profit from time decay as long as the market stays in range.
✅ Works well in sideways markets (common post-gap days or after big moves).
🎯 Focus: Short Straddle / Short Strangle near key levels
📌 2. Directional Option Buying (with Risk Control)
Objective: Ride fast moves using OTM options
Institutions buy deep OTM options when they expect sudden movement due to:
Breakout + OI unwinding
Short covering rally
News trigger or liquidity sweep
But they:
Use tight stop-loss, and
Enter near liquidity zone, not after the breakout
🎯 Focus: Volume + OI Shift + IV Expansion
📌 3. Scalping with Delta-Neutral Strategies
Objective: Profit from small intraday movements without market direction bias.
Example:
Sell ATM Call + Buy slightly OTM Call (Call Ratio Backspread)
Profit when price breaks in either direction and IV increases
🎯 Focus: Neutral strategy + quick reaction to movement
📌 4. Trap and Reverse (Liquidity Play)
Objective: Trap retailers near breakout/fakeout and reverse
Steps:
Identify large open interest buildup at a strike.
Price spikes above that level and then quickly reverses.
Institutions initiate the opposite side—profit from panic exits.
🎯 Focus: Option chain + sudden volume spike + reversal candle
📌 5. Hedged Position for Intraday Spike
Example Setup:
Buy Nifty 22500 CE + Sell 22700 CE
Risk defined, cheap entry, and profits from quick momentum.
Used during:
Event days
News expectations
VIX spikes
🎯 Focus: Defined risk with high reward if breakout happens
🔶 Institutional Footprints in Options
Here’s how to detect institutional presence:
✅ Sudden spike in option volume without news
✅ Aggressive unwinding near key levels
✅ High IV in far OTM options (possible trap)
✅ Large quantity buying/selling in illiquid strikes
✅ Price rejecting exact levels (like round numbers, day high/low)
🔶 Real Example of Institutional Intraday Option Play
Let’s say it’s Thursday (weekly expiry). Nifty is at 22500.
Retailers:
Start buying 22500CE, expecting a breakout.
Institutions:
Let price go up to 22540, triggering all CE entries.
Institutions sell huge lots of 22500CE with rising OI.
Nifty reverses to 22460. CE premium crashes.
Result:
Retailers lose.
Institutions profit via option writing and liquidity sweep.
🔶 How to Learn and Master Institutional Intraday Option Trading?
Step-by-step roadmap:
✅ Learn Option Chain Reading
Focus on OI shifts, strike buildup, and PCR.
✅ Understand Option Greeks
Especially Delta, Gamma, Theta, and Vega.
✅ Master Market Structure
Use price action, VWAP, volume profile, CPR.
✅ Practice Institutional Patterns
Liquidity grabs, stop hunts, traps, and reversals.
✅ Use TradingView or platforms like Sensibull, QuantsApp
For live data, OI heatmap, option analytics.
✅ Backtest with Replay Mode
See how institutions played in past events.
🔶 Bonus Tips for Retailers to Follow Institutional Moves
🧠 Always ask:
Who is trapped right now—buyers or sellers?
Is this a genuine breakout or just a liquidity grab?
What is option chain telling me?
🚫 Avoid:
Blind call/put buying without OI confirmation
Buying high IV options post move
Selling naked options in low capital

Trading Master Class With Experts.
🔶 Who Are These "Experts"?
The “experts” in a trading master class are usually:
✅ Professional traders working with institutions, hedge funds, or prop firms
✅ Full-time independent traders with consistent profit history
✅ Option Greeks and derivatives specialists
✅ Technical and price action experts
✅ Economists and market analysts
They are people who have traded for years, been through different market cycles, and know what works and what fails in the real market.
🔷 What You Will Learn in a Trading Master Class With Experts?
Here is a detailed breakdown of what such a master class includes:
🧠 1. Trading Mindset & Psychology Mastery
“90% of trading is mindset, not charts.”
Experts teach you:
How to control emotions like fear, greed, FOMO
How to build discipline, patience, and consistency
How to handle losses without revenge trading
How to develop a winning mindset like a hedge fund trader
📊 2. Advanced Technical Analysis (Beyond Indicators)
Forget about just MACD, RSI, Bollinger Bands.
Experts teach:
Price Action Secrets
Multi-timeframe analysis
Structure-based trading (HH, HL, LL, LH)
Breakout vs Fakeout patterns
Volume analysis and hidden traps
🎯 You’ll learn to predict moves with logic, not luck.
📈 3. Institutional Concepts (Smart Money Approach)
This is a core part of the class. You will learn how institutions trade, including:
Liquidity Zones & Order Blocks
Stop Loss Hunting Techniques
Fair Value Gaps (FVG)
Break of Structure (BOS)
Mitigation Blocks
Imbalance trading
You’ll finally understand:
"Why price reverses after breakout?”
"Why your stop loss gets hit and then the market moves in your direction?”
Experts teach you how to track institutional footprints and follow their logic.
📉 4. Derivatives & Options Trading Mastery
For advanced traders, especially in India (Nifty/Bank Nifty), the class covers:
✅ Options Chain Interpretation
✅ Open Interest (OI) Strategy
✅ Option Greeks (Delta, Gamma, Theta, Vega)
✅ Directional & Non-Directional Trading
✅ Intraday Option Scalping Techniques
✅ Straddles, Strangles, Spreads, Iron Condors
✅ Event-based strategies (Budget day, RBI day, earnings)
Live examples are shown using tools like Sensibull, QuantsApp, TradingView.
🔐 5. Risk Management Like Professionals
Trading without risk control is gambling.
In the master class, you’ll learn:
Position Sizing Models
Risk-to-Reward (RRR) Strategies
How to protect capital in volatile markets
Importance of trade journaling
When not to trade (which is as important as trading)
🎯 You’ll be taught how to think like a fund manager, not a gambler.
🧾 6. Trading Plan and Strategy Building
By the end of the class, you will have your own trading system, built with guidance from the experts.
Includes:
Entry and exit rules
Setup confirmation techniques
Trade management
Backtesting
Live trading practice
🎯 You’ll no longer depend on Telegram groups or paid signals. You will have your own tested edge.
💡 7. Live Market Sessions and Analysis
One of the most powerful parts of a master class is live sessions with experts, where you:
✅ Watch experts analyze the market in real-time
✅ Learn how they decide trades
✅ Ask questions on-the-spot
✅ See how they manage losses and winners
✅ Get live updates on index, stocks, options strategies
This removes confusion like:
“Should I buy or sell now?”
“Is this a trap or breakout?”
🔧 8. Tools, Platforms & Market Scanners Training
Learn to use:
TradingView Pro with institutional indicators
Option Analytics Tools (Sensibull, Opstra, Quantsapp)
Volume & Order Flow Tools
How to read market depth (Level 2 data)
How to use backtesting software for strategy building
🎯 The goal is to make you fully independent and tool-savvy.
📁 What’s Included in a Master Class Package?
A typical premium expert trading master class includes:
📌 20-30 hours of recorded sessions
📌 Weekly live sessions (Q&A, market review)
📌 Real trade examples (screenshots or live trades)
📌 Market homework and trade journaling
📌 Access to private trading communities
📌 Lifetime access + updates
📌 Strategy PDFs, cheat sheets
📌 Certificate of Completion (optional)
🔑 Benefits of Taking This Master Class
✅ Get direct mentorship from people who actually trade
✅ Save years of trial & error
✅ Learn real strategies, not just theory
✅ Increase accuracy and reduce losses
✅ Learn why you lose money and how to fix it
✅ Build discipline, process, and patience
✅ Join a community of focused traders
👨🏫 Who Should Join?
This class is perfect for:
Traders who lose consistently and don’t know why
Those who want to learn institutional-style trading
Option traders who want to become premium sellers / scalpers
People ready to invest time and discipline—not chasing “quick money”
Anyone who wants to turn part-time trading into serious skill
🔁 Real Case Example:
Imagine a Bank Nifty trader who always loses during breakouts. He joins the master class.
He learns:
How institutions create false breakouts
How to identify order blocks & liquidity grabs
How to position sell options around key zones
How to protect his capital with hedging and RRR control
Now, instead of gambling, he trades with confidence and understands what’s happening behind the candles.
🎓 Final Words
A Trading Master Class With Experts is like getting a direct map to reach consistent profitability in the market.
It is not a magic formula, but it trains your brain to think like a professional, trade like an institution, and manage risk like a fund.
It teaches you to focus not on tips, indicators, or chasing, but on:
Process
Discipline
Data
Edge
Execution.

Institution Option Trading📌 1. Multi-leg Strategic Trades
Institutions rarely take single-leg naked options. They use advanced setups like:
✅ Vertical Spreads (Bull Call / Bear Put)
✅ Iron Condor / Iron Butterfly
✅ Calendar / Diagonal Spreads
✅ Ratio Spreads
✅ Box Spreads (riskless arbitrage)
These strategies offer:
Defined risk
Better reward-to-risk ratios
Controlled exposure to market direction and volatility
📌 2. Delta Hedging
Institutions holding large stock or futures positions hedge delta using options.
For example:
Holding ₹50 crore worth of Reliance shares
Buy Reliance PUT options to protect against fall
Or, dynamically sell call options as price rises to adjust exposure
This is called Delta Hedging, and it’s done in real-time using algorithms.
📌 3. Open Interest (OI) Tracking
Institutions use option chain OI to:
Spot support/resistance based on strike activity
Identify traps and short-covering zones
Detect institutional presence via unusual OI spikes
For example:
Sudden OI surge at 22,000 PE in Bank Nifty
Might indicate put writers protecting downside, expecting reversal
📌 4. Time Decay (Theta) Exploitation
Institutions are the real beneficiaries of theta decay.
They sell options (straddles, strangles, spreads) around key levels (like VWAP, CPR) and let time decay eat the premium.
Especially on:
Expiry day (Thursday in India)
After big moves
In range-bound markets
They deploy millions of rupees in premium-selling strategies to generate daily/weekly returns.
🔶 Institutional Option Strategies Explained
Let’s break down some common institutional strategies in real terms:
🔷 1. Short Straddle
Sell ATM Call and ATM Put at same strike
Works in sideways markets
Profits from time decay and low movement
✅ Used heavily by institutions on weekly expiry
✅ Risk: Sharp move in either direction
🔷 2. Bull Call Spread
Buy a lower strike Call
Sell a higher strike Call
Lower cost, limited risk & reward
✅ Used when institutions expect moderate bullish move
✅ Controlled exposure + reduced premium
🔷 3. Iron Condor
Sell OTM Call & Put
Buy further OTM Call & Put
Net credit strategy with limited risk
✅ Best in low volatility, non-trending markets
✅ Profitable if market stays between two levels
🔷 4. Calendar Spread
Sell near-term option
Buy far-month option (same strike)
Used when:
Near-term IV is high
Long-term view is neutral or unclear
✅ Profits from IV difference and time decay advantage
🔷 5. Protective Put
Holding equity or futures
Buy Put Option to insure position
Institutions use this to hedge large portfolios during high uncertainty (e.g., elections, war threats, Fed rate decisions)
🔶 Real Example – How an Institution Trades Nifty Options
Let’s say Nifty is at 22,000.
📊 Scenario:
IV is high
No major event ahead
OI buildup seen at 22000 PE and 22100 CE
📈 Institutional Strategy:
Sell 22000 PE and 22100 CE (Short Straddle)
Buy 21900 PE and 22200 CE (hedge legs)
Result:
If Nifty stays in range → theta decay = profit
If it breaks out → hedge legs protect loss
✅ Low-risk, smart premium capture strategy
🔶 Key Tools Institutions Use in Options Trading
Bloomberg Terminal (real-time global data)
Opstra / Sensibull / QuantsApp (for Greek/OI analysis)
Option Vega/IV scanners
Algo trading engines
Python/R-based custom backtesting engines
Retail traders can start by using TradingView + Sensibull/Opstra.
🔶 How to Learn Institutional Options Trading?
Here’s a step-by-step approach:
✅ Understand Options Basics – Calls, Puts, Moneyness
✅ Study Greeks Deeply – Delta, Theta, Vega, Gamma
✅ Learn Option Chain Analysis – OI, IV, Max Pain
✅ Explore Spreads & Multi-leg Setups
✅ Practice Risk Management & Position Sizing
✅ Track Institutional Behavior via OI shifts & volume
✅ Backtest Your Strategy before going live
🔶 Final Takeaways
Institutional Options Trading is not about guessing. It’s about data, structure, and risk.
Retail traders who try to copy institutions without understanding their objectives often get trapped.
But if you:
Study Smart Money behavior
Use strategic entries based on volume + volatility
Respect risk and capital preservation
…you can trade with the institutions, not against them.

Advance Option Trading🔶 What Is Advanced Options Trading?
Advanced Options Trading goes beyond buying and selling simple Calls and Puts. It’s about using multi-leg strategies, managing risk with precision, applying greeks and volatility, and aligning your trades with market conditions.
Advanced traders treat options like a math-based chess game. They don’t gamble—they strategize, hedge, spread, and use data-driven decisions to extract profits in all kinds of markets (bullish, bearish, sideways, volatile, calm).
🔍 Why Learn Advanced Options Trading?
While beginners just "buy options" hoping for a quick profit, advanced traders use options to:
Control risk
Earn consistent income
Capitalize on volatility
Trade sideways or range-bound markets
Create hedges for portfolios
Use smart capital deployment with defined risk
2️⃣ Implied Volatility (IV)
IV tells you how expensive or cheap options are.
📈 High IV = Options are expensive → Ideal for selling
📉 Low IV = Options are cheap → Ideal for buying
Advanced traders use:
IV Rank / IV Percentile
Volatility skew analysis
Volatility crush trades around earnings or events
3️⃣ Option Strategies
Here’s where real skills come in. Advanced trading uses multi-leg strategies to limit loss, increase odds, or make money in non-directional moves.
🔍 Strategy Example: Iron Condor
Sell 22000 CE
Sell 21800 PE
Buy 22100 CE (hedge)
Buy 21700 PE (hedge)
You’ll profit if the index stays between 21800 and 22000, and time decay works in your favor.
✅ Defined risk
✅ Limited profit
✅ Great for expiry week if market is range-bound
💹 Advanced Techniques for Smart Trading
Let’s now explore how pros operate:
🔸 A. Delta-Neutral Trading
Institutional or advanced traders often create delta-neutral positions—no directional bias.
Example:
Buy Call option (Delta +50)
Sell Put option (Delta -50)
Net Delta = 0 → Neutral. The position doesn’t care which way market moves—only volatility or time decay matters.
🔸 B. Hedging with Options
Advanced traders hedge their stock or futures positions using options.
Example:
You hold ₹5 lakh worth of Reliance shares
You buy Reliance PUT options to protect downside risk
Result? You keep profits if stock goes up and protect capital if it drops. It's like insurance.
🔸 C. Trading Earnings or Events
Options let you trade volatility, not just direction. Ahead of events like:
Earnings reports
RBI or Fed meetings
Budget announcements
You can use:
Straddles / Strangles (if expecting big move)
Iron Condors (if expecting no major move)
Calendar spreads (to exploit IV difference)
🔸 D. IV Crush Strategy
Before major events, IV rises. After the event, IV drops (called IV crush).
Advanced traders:
Sell options before events (high premium)
Buy options after IV crash (cheap premium)
They know when NOT to buy options just before news—because premium is inflated!
🔸 E. Adjusting Trades
Advanced traders don’t just “hope” for success. If a trade goes wrong, they adjust it:
Roll to a new strike
Convert from debit to credit spreads
Hedge with opposite positions
Manage Delta/Theta/Vega exposure
This proactive style protects capital and increases recovery chances.
🛠️ Tools Used by Advanced Option Traders
Opstra / Sensibull – Strategy builder, Greek analyzer
TradingView – Charting & technical levels
OI Analysis Platforms – For understanding institutional footprints
Python / Excel – Custom backtesting tools
Algo Platforms – For speed and logic-based execution
📌 Important Rules for Advanced Option Traders
Don't chase trades. Let trades come to you.
Always define risk before entering.
Use multi-leg setups, not naked options unless there's an edge.
Stay Theta positive in low volatility markets.
Only buy options when IV is low and breakout is expected.
✅ Final Thoughts
Advanced options trading is a skillset—not a shortcut.
If you:
Want consistent profits
Wish to trade like institutions
Hate gambling and want a plan
Love logic, numbers, and control
…then advanced option trading is your next big step.
It gives you the tools to win in all market types, not just trending ones.

Institutional Objectives in Options Trading🔷 What Are Institutions in the Market?
Before diving into their objectives, let’s first understand who institutions are:
Institutions are large, professional organizations that trade in the financial markets using massive amounts of capital. These include:
Mutual Funds
Hedge Funds
Pension Funds
Insurance Companies
Investment Banks
FIIs (Foreign Institutional Investors)
Proprietary Trading Firms
These players account for over 80-90% of daily turnover in options markets like NSE’s Bank Nifty and Nifty. Unlike retail traders, they don’t trade emotionally or randomly. Every move they make has a calculated reason behind it.
🎯 Why Do Institutions Use Options?
Options are powerful tools. Institutions don’t just trade them for direction; they use options to achieve multiple objectives:
✅ 1. Hedging Portfolios
🔍 Objective:
To protect their large equity/futures holdings from adverse market movements.
Institutions have huge long-term positions in stocks or indices. If the market falls sharply, these positions can suffer big losses. So, they use PUT options to hedge.
📈 Example:
A pension fund holds ₹500 crore worth of Nifty 50 stocks.
It buys Nifty 50 PUT Options at 22,000 strike.
If market crashes, the loss in stocks is offset by profit in PUTs.
📌 Result: Limited downside, peace of mind, capital protection.
✅ 2. Generating Additional Income (Option Writing)
🔍 Objective:
To generate consistent income from existing holdings through Covered Calls, Cash-secured Puts, or Iron Condors.
Institutions write options (sell) to earn premium—especially in sideways markets.
💡 Examples:
Covered Call: Own Reliance shares + Sell OTM Call option to earn income.
Short Strangles: Sell far OTM Put and Call if volatility is high.
Iron Condor: Sell call/put spreads to profit from time decay.
📌 Result: Generates passive income with controlled risk.
✅ 3. Arbitrage and Spread Trading
🔍 Objective:
To lock in risk-free or low-risk profits through price inefficiencies.
Institutions use Calendar Spreads, Box Spreads, or Volatility Arbitrage to exploit inefficiencies in option pricing.
🔧 Example:
Calendar Spread: Buy Nifty 22500 CE in August, sell Nifty 22500 CE in July.
Profit from IV differences or time decay.
📌 Result: Non-directional trading, but consistent profits with high capital.
✅ 4. Taking Directional Bets With Defined Risk
🔍 Objective:
To take high-conviction trades without exposing entire capital like futures.
Institutions use Debit Spreads, Straddles, or Long Options for directional views with limited risk.
💡 Example:
If expecting a bullish breakout, they might:
Buy 22000 CE
Sell 22200 CE
It caps both risk and profit. Perfect for risk-managed directional exposure.
📌 Result: Risk-defined entry into market trends without using futures.
✅ 5. Volatility Trading (Not Price Trading)
Institutions often trade volatility, not just price direction. They use Straddles, Strangles, Calendar Spreads to play IV.
💡 Example:
If implied volatility is low and an event is coming (like RBI policy):
Buy Straddle (ATM Call + Put)
Expect IV spike or a big move
📌 Result: Profit from volatility expansion or collapse, even if price stays in a range.
✅ 6. Managing Fund Exposure / Risk Neutralizing
Large funds have multiple exposures—options help them balance and adjust their overall risk (Delta-neutral, Vega-neutral, etc.).
They regularly:
Adjust positions using Gamma scalping
Balance portfolio Delta using options
Reduce Vega risk in high IV periods
📌 Result: A smooth, hedged, and controlled portfolio with minimal exposure to wild market moves.
✅ 7. Creating Synthetic Positions
Sometimes, instead of using equity or futures, institutions use options to replicate or create synthetic trades.
💡 Example:
Buy Call + Sell Put = Synthetic Long Future
Sell Call + Buy Put = Synthetic Short
This helps institutions:
Avoid STT, slippage
Better margin use
Higher flexibility with position sizing
📌 Result: Capital efficiency and strategic execution
📈 How to Spot Institutional Activity in Options?
You can decode institutional movement using these tools:
🔸 1. Open Interest (OI) Analysis
Spike in OI with price action = smart money at work
Build-up of OI near a strike = possible resistance/support zone
Use tools like Sensibull, Opstra
🔸 2. Volume + Price Movement
Sudden spike in volume in far OTM options = Institutional hedging or setup
Buy-Sell flow data shows positioning
🔸 3. Put-Call Ratio (PCR)
Used to detect market sentiment and institutional net positioning
🔸 4. IV Charts / Skew
Institutional volatility strategies are visible through steep IV skew or unusual IV changes
🔐 Final Thoughts
Institutional trading in options is not speculation. It is a scientific approach to manage:
Capital exposure
Risk control
Income generation
Volatility protection
Their objectives are not just to win trades, but to:
Protect capital
Optimize returns
Stay profitable in all market conditions

Technical Class🧠 Why Learn Technical Analysis?
Because price is king.
All news, fundamentals, and economic data are already reflected in price. Technical analysis teaches you how to read price charts and anticipate movements—giving you the timing advantage.
Institutions, traders, and even algorithms rely heavily on technical levels. So if you want to:
Know when to enter/exit
Understand where big money is active
Manage risk smartly
Improve accuracy
…you need strong technical skills.
🔍 What Will a Good Technical Class Cover?
Let’s break this into 10 structured modules, explained in human-friendly language.
📘 1. Basics of Price Action
What is a chart? (Line, Bar, Candlestick)
Understanding OHLC (Open, High, Low, Close)
Why price is the most important factor
How price creates support, resistance, and trends
👉 Outcome: You’ll read any chart confidently.
📘 2. Candlestick Patterns
Single candlesticks: Doji, Hammer, Engulfing, Marubozu
Dual & triple candle patterns: Morning Star, Evening Star, Three Soldiers
Reversal vs Continuation patterns
👉 Outcome: You’ll know how to identify potential trend reversals or strength.
📘 3. Chart Patterns (Price Structures)
Reversal Patterns: Double Top/Bottom, Head and Shoulders
Continuation Patterns: Triangles, Flags, Pennants, Rectangles
Understanding Breakouts vs Fakeouts
👉 Outcome: You’ll recognize market structures and act before the move begins.
📘 4. Support and Resistance Mastery
How to identify major support/resistance levels
Role of historical price zones
Dynamic support/resistance using moving averages
Price reaction techniques
👉 Outcome: You’ll place entries and exits at the most strategic levels.
📘 5. Trend Analysis
What is a trend? (Uptrend, Downtrend, Sideways)
How to draw trendlines correctly
Role of higher highs & lower lows
Using Multiple Timeframe Analysis
👉 Outcome: You'll align trades with major trends like professionals do.
📘 6. Indicators & Oscillators
Moving Averages (SMA, EMA): Trend confirmation
RSI: Overbought/Oversold signals
MACD: Momentum and divergence detection
Bollinger Bands: Volatility breakout
Volume Profile / VWAP
👉 Outcome: You’ll combine indicators for confluence and higher accuracy.
📘 7. Intraday Technicals
Best indicators for intraday (VWAP, Supertrend)
Time-based chart usage (5m, 15m, 1hr)
Institutional trap zones (fakeouts, liquidity sweeps)
Scalping vs momentum setups
👉 Outcome: You’ll confidently take trades within the day using fast setups.
📘 8. Risk Management and Trade Psychology
Position sizing
Risk-Reward ratio planning
Importance of Stop Loss
Emotional control: Fear, Greed, Impatience
Creating a rule-based system
👉 Outcome: You’ll trade stress-free, without blowing up your capital.
📘 9. Advanced Institutional Concepts
Smart Money Concepts (SMC): Liquidity, Order Blocks, BOS/CHOCH
Institutional Order Flow: Where big money trades
Volume Spread Analysis
Wyckoff Theory (Accumulation/Distribution phases)
👉 Outcome: You’ll learn how institutions move the markets and how to follow them.
📘 10. Strategy Building and Backtesting
Creating rule-based strategies
Journaling trades and analyzing results
Backtesting on historical data
Live market application with confidence
👉 Outcome: You’ll develop your own strategy and remove guesswork.

TATACONSUMHi guys, In this chart i Found a Demand Zone in TATACONSUM for Long Term, Observed these Levels based on price action and Demand & Supply. WW. Don't Take any trades based on this Picture
...because this chart is for educational purpose only not for Buy or Sell Recommendation..
Thank Q

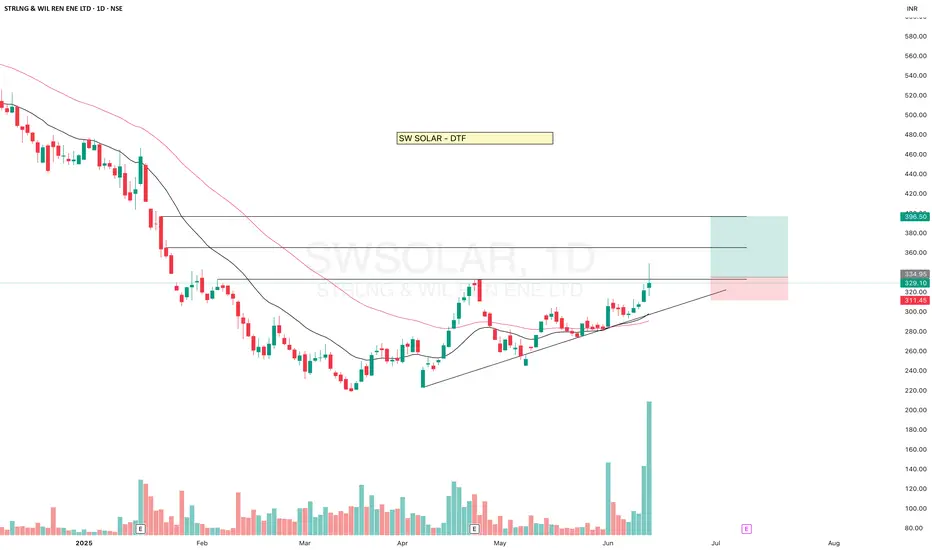
SW SOLARSW SOLAR gave BO but came down, heavy volume, if sustain this level then it may give a good upside move.
Moving above 20-50ema.
✅ If you like my analysis, please follow me as a token of appreciation :)
in.tradingview.com/u/SatpalS/
📌 For learning and educational purposes only, not a recommendation. Please consult your financial advisor before investing.
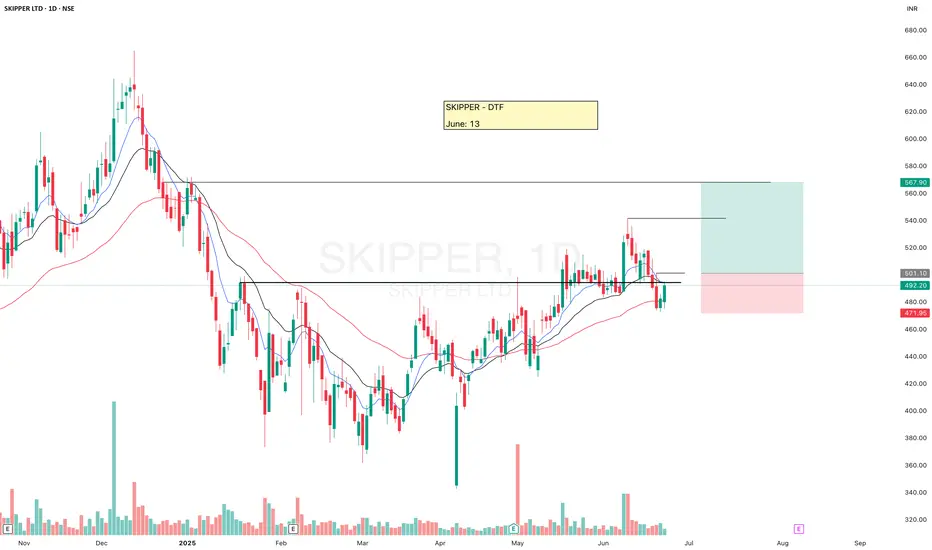
SKIPPERSKIPPER has been re-testing the recent breakout. It is moving above 50ema. Now the breakout above 500 may give an upside move.
Keep following.
✅ If you like my analysis, please follow me as a token of appreciation :)
in.tradingview.com/u/SatpalS/
📌 For learning and educational purposes only, not a recommendation. Please consult your financial advisor before investing.
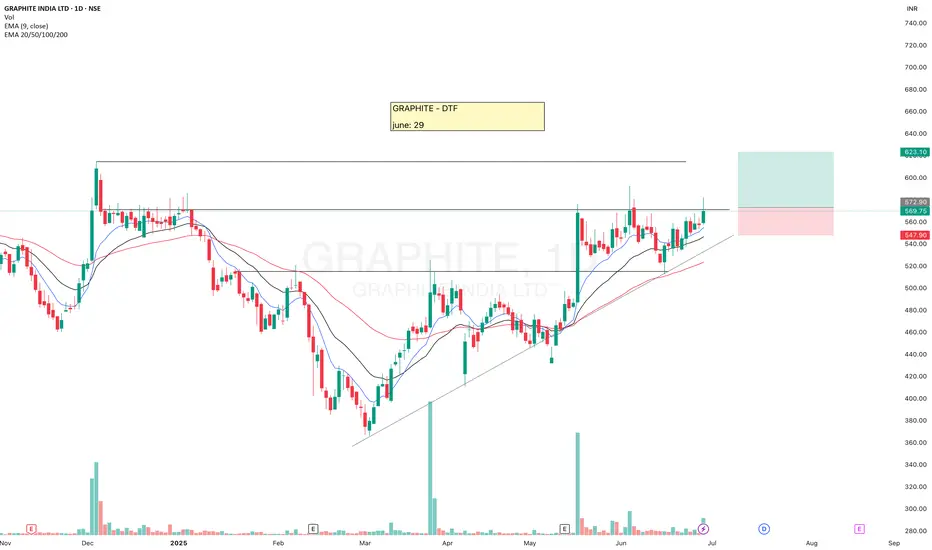
GRAPHITEGRAPHITE has been facing resistance at this level, now there is probability of an upside move.
Look for the breakout.
✅ If you like my analysis, please follow me as a token of appreciation :)
in.tradingview.com/u/SatpalS/
📌 For learning and educational purposes only, not a recommendation. Please consult your financial advisor before investing.
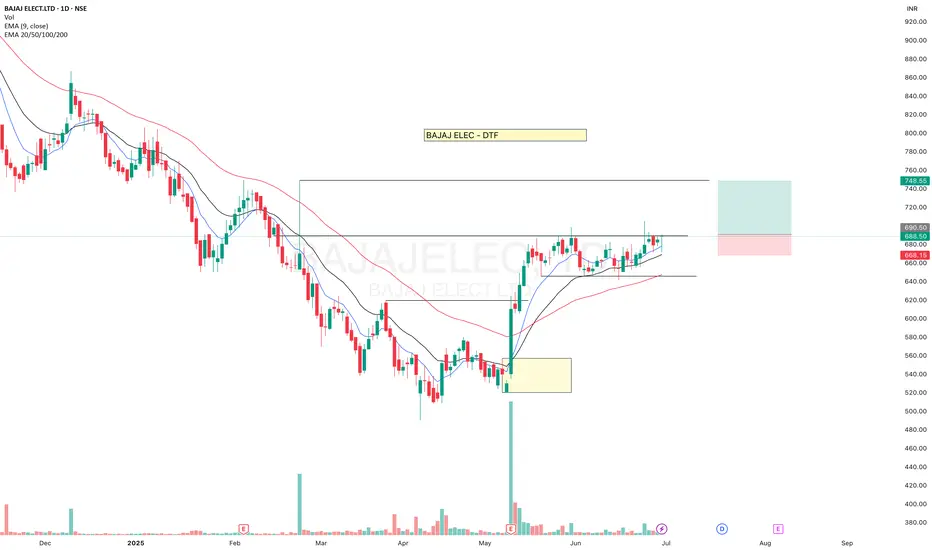
BAJAJ ELECTBAJAJ ELECT is facing resistance and now seems to be ready for the BO.
Breakout from here may give a good upside move.
✅ If you like my analysis, please follow me as a token of appreciation :)
in.tradingview.com/u/SatpalS/
📌 For learning and educational purposes only, not a recommendation. Please consult your financial advisor before investing.