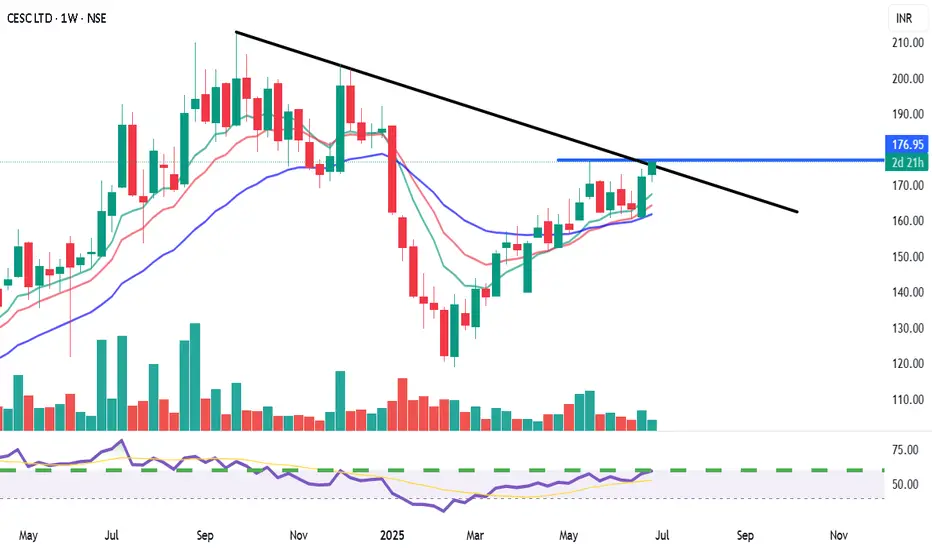
CESC Ltd. (NSE: CESC) - Weekly Chart AnalysisView: Bullish on confirmed breakout.
Bias: Positive momentum.
Strategy:
BUY: Above ₹178-180 (on weekly closing basis, confirming trendline and resistance breakout).
Targets (T):
T1: ₹195-200
T2: ₹210-220+
Stop-Loss (SL): ₹168 (on weekly closing basis).
Reasoning:
Attempting a breakout from a significant descending trendline.
Cleared horizontal resistance at ₹175.
Bullish crossover in moving averages with price above all MAs.
Strong RSI and supportive volume.
Potential for a major trend reversal.
Note: This is an educational analysis and not financial advice. Do your own due diligence before investing.
Swingtrading
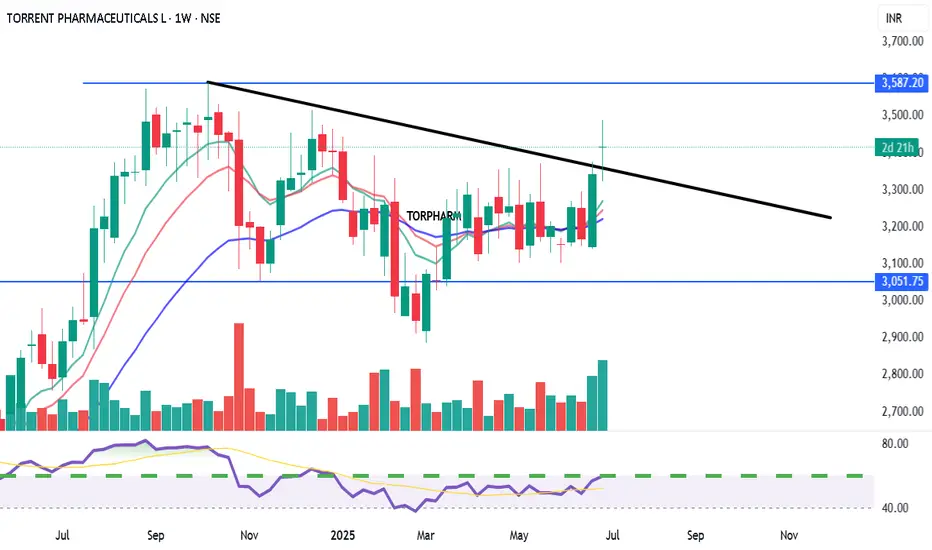
TORRENT PHARMACEUTICALS LTD. (TORPHARM) View: Bullish on confirmed breakout.
Bias: Positive momentum building.
Strategy:
BUY: Above ₹3600 (on weekly closing basis with strong volume confirmation).
Targets (T):
T1: ₹3750
T2: ₹3950+
Stop-Loss (SL): ₹3400 (on weekly closing basis).
Reasoning:
Strong support at ₹3000-₹3050.
Challenging multi-month descending trendline resistance.
Positive RSI divergence and increasing volume.
Potential for a significant trend reversal if breakout is confirmed.
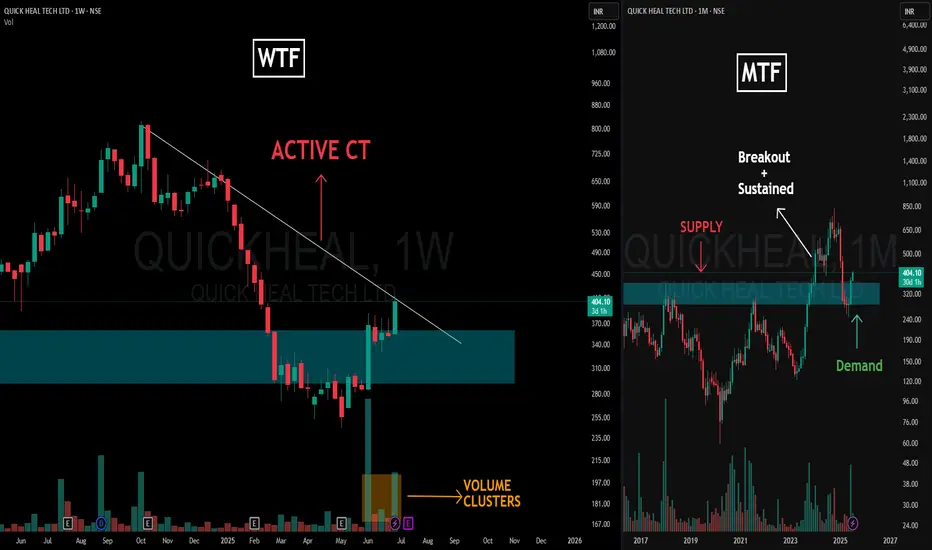
Supply Flips, Trendline Squeezes & Volume Talks – Clean MTFA📌 Charting Breakdown
This post dives into a clean Multi-Timeframe Analysis (MTFA) for QUICKHEAL using structural logic — with Weekly Time Frame (WTF) on the left and Monthly Time Frame (MTF) on the right.
🔍 Left Side – Weekly Time Frame (WTF)
-The Active CT (Counter-Trend) is marked via the dominant trendline resistance, which price is actively engaging.
-We observe a strong Volume Cluster forming near the base of the reclaimed demand zone — often a sign of accumulation or significant interest.
🧠 Right Side – Monthly Time Frame (MTF)
-Here, a textbook Supply & Demand Conversion is visualized.
-Initially, price reacted to a clear Supply Zone, creating the resistance base.
-Once that zone was broken with strength and sustained above it, the previous supply area transformed into Demand, validating the impulse move.
-Price then returned to test this now-converted zone — an SR flip seen through the lens of supply-demand logic, not just support/resistance lines.
🧾 Disclaimer:
This post is not a forecast, tip, or financial advice. It is purely an educational breakdown of price structure and market behavior based on my personal charting style. Feel free to ask your doubts or thoughts in the comments — let’s build clarity, not predictions.
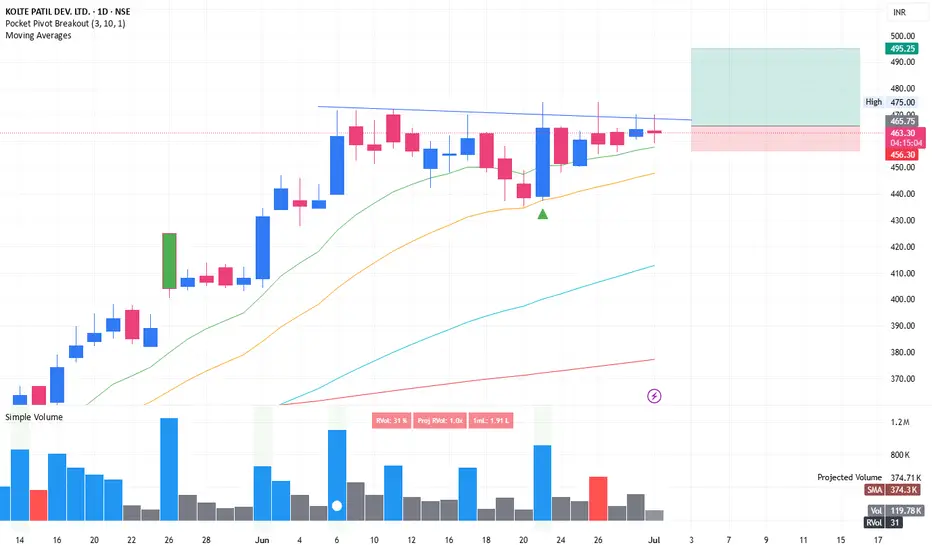
Swing trade opportunity in KOLTEPATILKOLTEPATIL: Tight consolidation with inner bar structure is formed in last 5-6 days. Breaking above the pivot line could lead to significant push when crossing with good volume.
SL is somewhere around 3% (Refer the long position drawn over the chart).
One can invest 10% portfolio size as per following calculations
Position sizing and managing risk is the key.
Portfolio is: 1,00,000
Position size: 10,000
Risk 3%: 300. Which means only 0.3% of overall portfolio value is under risk.
Stay connected for commentary for coming days
Disclaimer:
The information provided herein is for educational and informational purposes only and should not be construed as investment advice. The stock analysis and recommendations are based on publicly available information, data sources believed to be reliable, and our interpretation at the time of writing.
Investing in equities involves risks, including the risk of loss of capital. Past performance is not indicative of future results. Readers and investors are advised to conduct their own research or consult a qualified financial advisor before making any investment decisions.
The author(s), affiliates, or associated entities may hold positions in the stocks mentioned, and such positions are subject to change without notice.
We do not guarantee the accuracy, completeness, or timeliness of any information presented, and we disclaim any liability for financial losses or damages resulting from the use of this content.
VOLTAMPVOLTAMP may give a good upside move if it gives breakout.
It's been making HH-HL formation, broke resistance and re-tested it, now seems ready.
Keep following it.
✅ If you like my analysis, please follow me as a token of appreciation :)
in.tradingview.com/u/SatpalS/
📌 For learning and educational purposes only, not a recommendation. Please consult your financial advisor before investing.

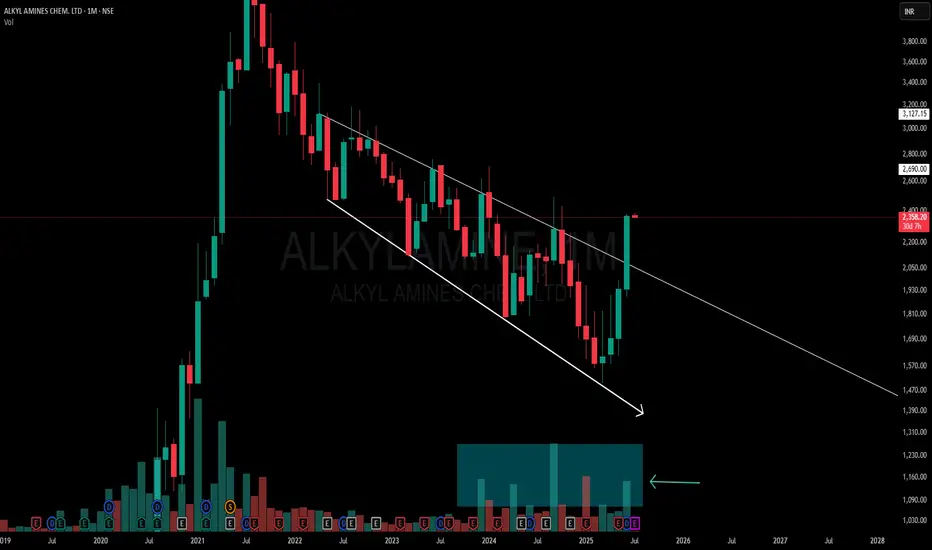
Powerful Monthly Channel | Clean Price Structure Across📉 Description:
-This is a classic example of a broadening falling channel on the Monthly Time Frame (MTF), where the counter-trendline (CT) has just been taken out by a strong bullish candle. Volume confirms the strength
📌What makes this setup particularly interesting:
-MTF structure: Despite a series of lower lows on the monthly, it has respected the broad structure of the falling channel throughout.
-WTF/DTF structure: Weekly and Daily timeframes are making higher lows (HLs),
-Price behavior: Clean reaction to the trendline and no choppiness around breakout — this reflects a well-absorbed selling zone
⚠️ This is not a forecast, not a call or tip — just me charting what I see. Drop any doubts in the comments.
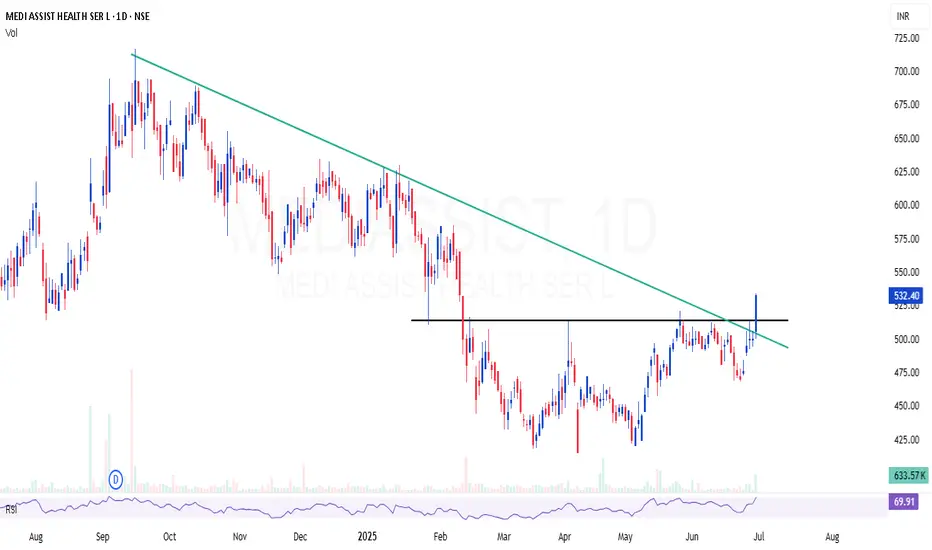
MEDIASSIST | High probable setup - Looks good for 30%MEDIASSIST | High probable setup - Looks good for 30%
Technically, the stock is strong and recent news—like the Star Health deal—is positive. The coming lock-in expiry, however, could trigger volatility. With solid digital expansion but elevated valuation, it's likely attractively positioned yet not without risk.
CMP : 532 (Dip : 500)
SL : 470
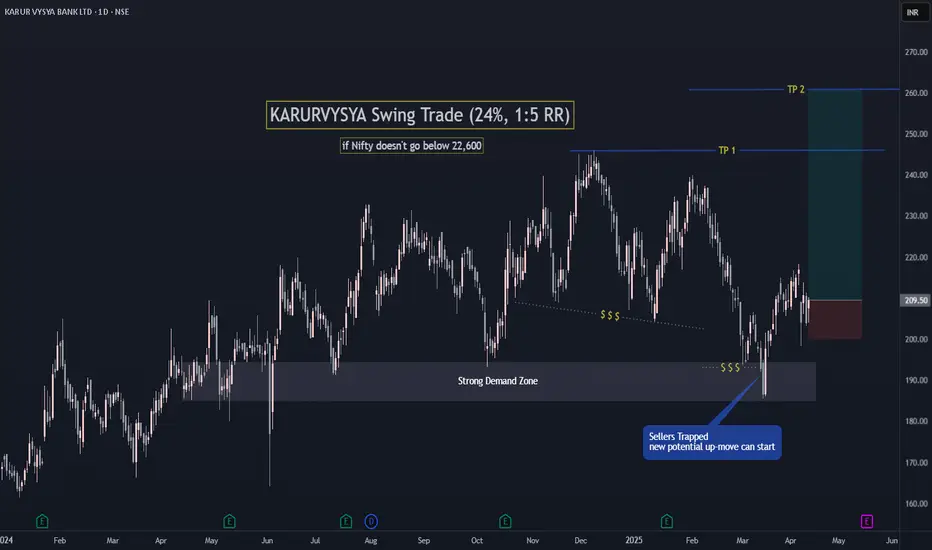
KARURVYSYA Swing Trade (24% potential, with 1:5 RR)Pretty much everything self explanatory in chart.
A very good potential trade if Nifty holds it current level ie 22,700.
Also a very good fundamental stock.
Follow for such good setups.
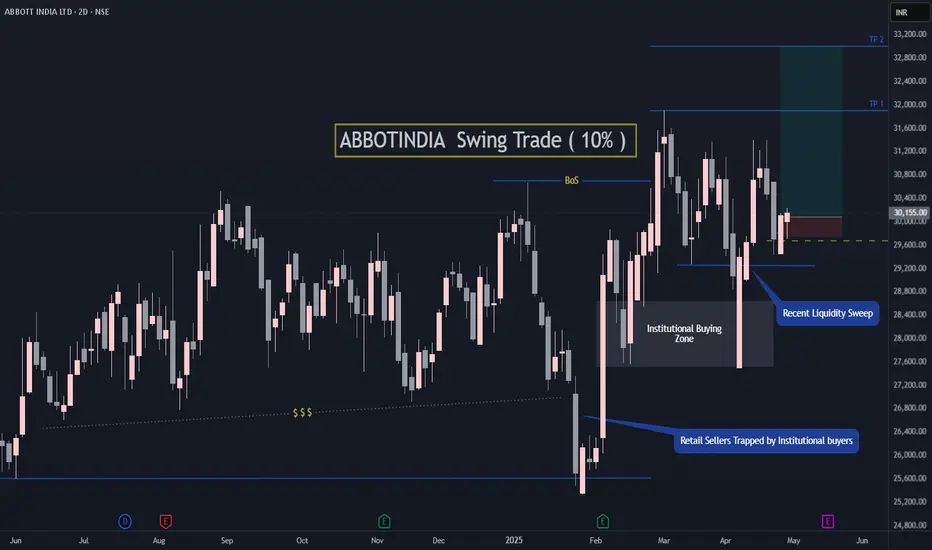
ABBOTINDIA Swing Trade ( 10% upside potential) Abbott India is near to the previous Institutional Buying zone and has upside potential of 10%.
Simple Demand Zone buying setup.
Don't keep hard stop loss. Manage positions as per situation.
Follow for more such setups.
I have been very busy lately because of renovation at home. Will be sharing more setups soon. Thanks.
RATTANINDIA POWER LTDTechnical View:
Price: ₹14.39 (+3.60%)
Volume: Very strong volume (~645M), indicating institutional interest or strong buying pressure.
EMA: Price is trading well above the EMA – confirms short-term bullish strength.
RSI: Currently at 66.67 – strong positive momentum.
Chart Pattern View:
Price is moving within a well-defined ascending channel.
Recently rebounded from the lower boundary – and now heading toward the upper resistance line.
Candlestick View:
Strong bullish candlestick seen in the current breakout candle.
No upper wick implies buyers were in full control throughout the session.
Buy Opportunity:
Entry Zone: 15.00 above
Target 1: 17.50 (previous swing high).
Target 2: 20.00 ++ (upper channel resistance if momentum continues).
Stop Loss: 12.90 (below breakout level and channel lower band).

How I Read Price Action Like a Pro (Most Miss This Step)The REAL Way to Read Price Action — No Indicators, Just Logic
I make educational content videos for swing trading .

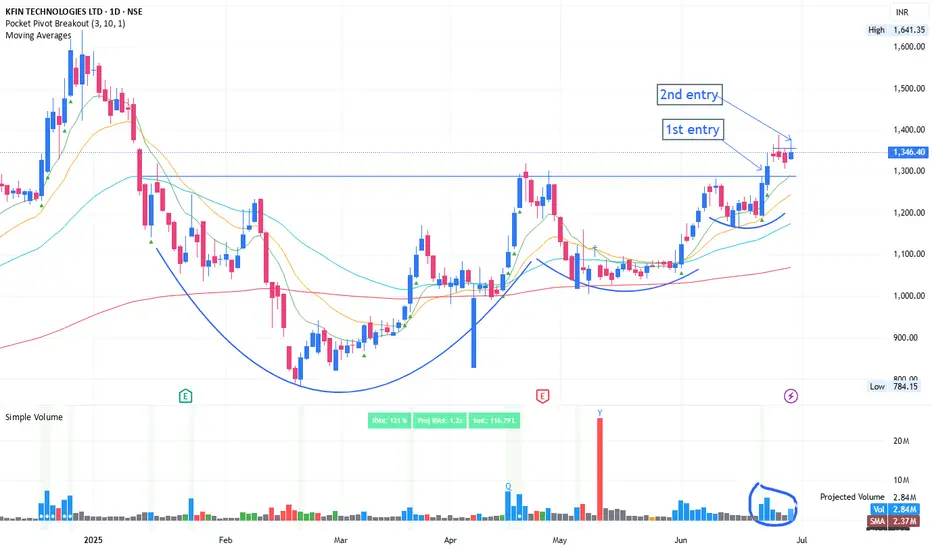
Volatility contraction, breakout and tightnessKFINTECH: Recent breakout which was marked as 1st entry. It is the safest entry, good thing is, post breakout it is forming tightness in price. This acts like spring. Once it bounce from this level, then there are high chance of blasted move.
2nd entry could be above the tightness breakout with 200-300x RVOL during early starting of trading session. This could give huge intraday returns and good topup over existing position
Stay connected for upcoming development and notes.
Disclaimer:
The information provided herein is for educational and informational purposes only and should not be construed as investment advice. The stock analysis and recommendations are based on publicly available information, data sources believed to be reliable, and our interpretation at the time of writing.
Investing in equities involves risks, including the risk of loss of capital. Past performance is not indicative of future results. Readers and investors are advised to conduct their own research or consult a qualified financial advisor before making any investment decisions.
The author(s), affiliates, or associated entities may hold positions in the stocks mentioned, and such positions are subject to change without notice.
We do not guarantee the accuracy, completeness, or timeliness of any information presented, and we disclaim any liability for financial losses or damages resulting from the use of this content.
Weekly CT & Hiddenline Cracked – Supply/Demand Zones In PlayThis weekly chart shows a well-defined price structure shaped around multi-timeframe supply and demand dynamics:
🟩 Green Zone – Broad demand zone, price has respected this area multiple times recently.
🟥 Red Zone – Long-standing WTF supply zone, tested multiple times in the past.
⚪️ White Solid Line – Active CT (corrective trendline), which has been broken cleanly on this week’s candle. Being a weekly close (Friday), the breakout carries more weight.
⚪️ Dotted White Line – A hidden resistance trendline, possibly acting as a confluence level for prior rejections. That too has been convincingly breached.
📊 Notice the strong volume spike on the breakout – always worth watching in a structure like this.
🔁 No predictions. Not a call. Just chart structure and context.

Titan | Swing | Breakout Titan has just given a clean trendline breakout followed by a successful retest, which makes this setup quite interesting from a positional swing trade perspective.
✅ Trendline Breakout
• The stock broke a strong descending trendline that had been acting as resistance for several months.
✅ Retest and Bounce
• After the breakout, Titan came back to retest the breakout level near ₹3,380, which held well — a classic bullish sign. This bounce happened around the 38.2% Fibonacci retracement zone — another technical confluence that adds weight to the trade idea.
⸻
📈 Entry, Targets & Stop Loss
• Entry Zone: Around ₹3,665 – ₹3,695
• Stop Loss (SL): Below ₹3,202
Important note: If price breaks below ₹3,500 without RSI crossing 75, it might lead to negative RSI divergence — a warning of weakening momentum. In that case, better to exit to avoid capital getting stuck.
⸻
🎯 Targets Based on Fibonacci Extensions:
• Target 1: ₹4,123
• Target 2: ₹4,324
• Target 3: ₹4,580
These targets are calculated using Fibonacci extension levels, with the final one being the 1.618 golden ratio zone.
⸻
Disclaimer: Do your own analysis before putting money in investment. Idea is for education purpose to share and learn within trading view community. Not a suggestion to put your hard earn money.

GALLANTT ISPAT LTDGALLANTT - The stock is currently in a rising channel pattern, with consolidation near a key resistance level forming a potential bullish flag continuation pattern. If the stock sustains above 485, it could trigger a move towards 525 and 565.

OPTIEMUS | Reclaiming Zones, Respecting Trendlines🟩 Price is navigating a critical structure:
White Line = Major CT (Control Trendline) — currently acting as resistance.
White Zone = MTF Supply ➡ Demand Flip Zone — price is holding above it.
Blue Zone = WTF Demand Pocket — also reclaimed recently.
📌 After reclaiming both the blue and white zones, price is now consolidating just under the CT, possibly coiling up.
🧠 Not a prediction. No tips. Just structure-based storytelling.

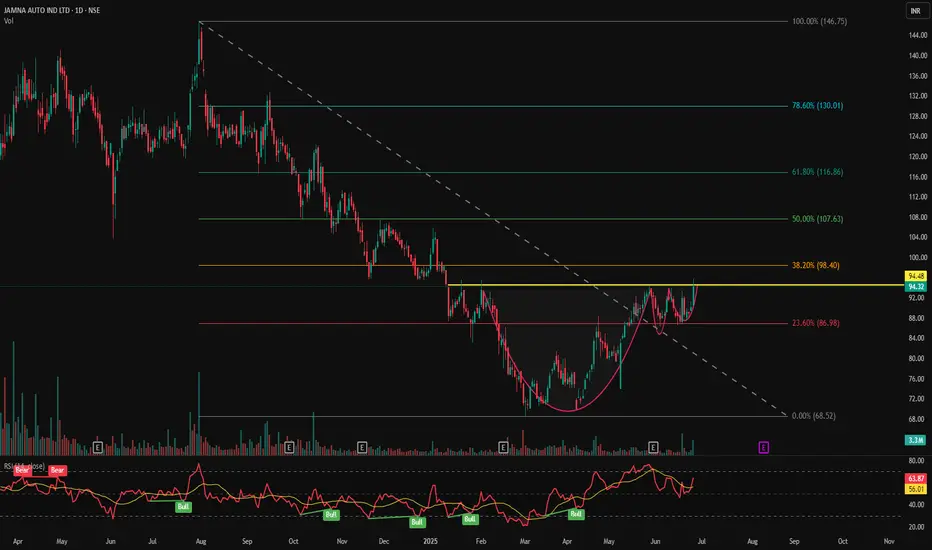
JAMNAAUTO - VCP Pattern Near Breakout📊 JAMNA AUTO (JAMNAAUTO) – VCP Pattern Near Breakout | RSI Momentum | Volume Surge | Daily Chart
📅 Chart Date: June 26, 2025
📈 CMP: ₹94.32 (+4.60%)
📍 Ticker: NSE:JAMNAAUTO
🔍 Technical Analysis Summary
☕ Cup & Handle Formation
The chart shows a well-formed Cup & Handle pattern
Neckline resistance at ₹94.48 – a break above this zone could trigger bullish continuation
Pattern suggests accumulation and breakout setup after prolonged downtrend reversal
📈 Volume
Rising volume on recent candles, supporting strength of potential breakout
Volume above 3.3M confirms strong buying interest
📊 RSI Indicator (14)
RSI currently at 63.87 and rising
Multiple historical RSI Bullish crossovers visible during base and handle formation
RSI > 60 indicates momentum is favoring bulls
📍 Key Price Levels
✅ Breakout Zone (Neckline): ₹94.48
🚀 Upside Targets (Post-breakout estimate):
₹102
₹110
₹120+
🛡️ Support Zones:
₹90 (immediate)
₹85 (handle base)
₹80 (cup base)
📌 Trade Setup Idea
Entry: On breakout above ₹94.50 with volume
SL: Below ₹89
Targets: ₹102 → ₹110 → ₹120+
Risk-Reward: Good, considering rounded base and handle plus RSI confirmation
⚠️ Disclaimer
This chart analysis is for educational purposes only. Always DYOR (Do Your Own Research) and consult a financial advisor before making investment decisions.
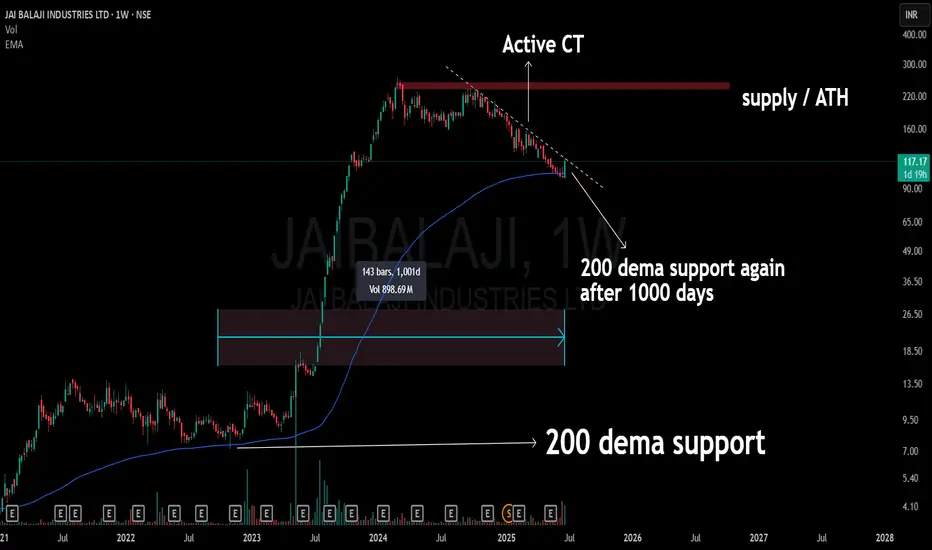
200 Dema Touched After 1000 Days !! 🔵 Stock: JAI BALAJI (Weekly)
🔥 Support Revisit: Back to the 200 DEMA after 1000 days
A level that once acted as the launchpad.
Current structure shows an active compression trend (CT) right into this long-term dynamic support.
The chart also aligns below a major supply zone / ATH band, keeping the broader context in check.
📉 No prediction. No call. Just structure, levels, and time-tested zones doing the talking.
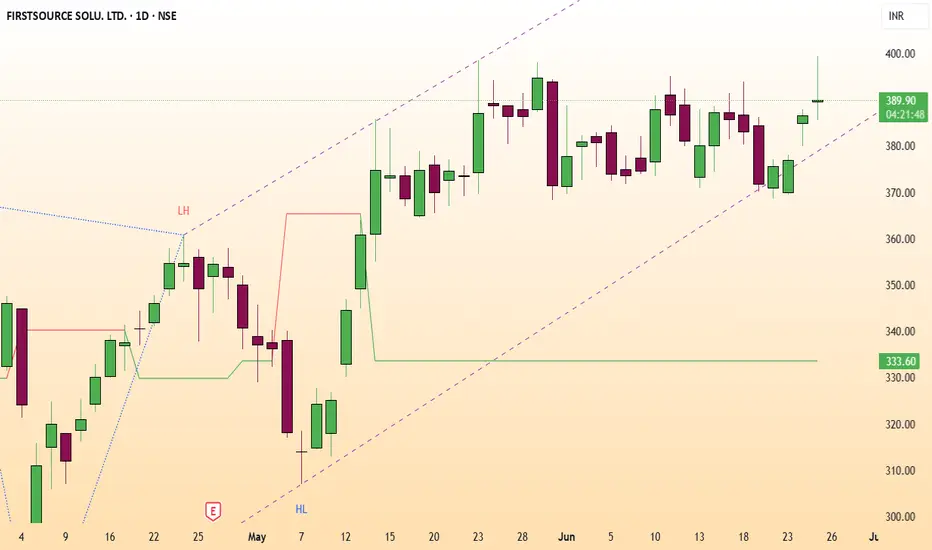
FSL BREAKOUT STOCK🚨 Breakout Stock: FSL 🚨
🚀 CMP: ₹390
🔼 Bullish above ₹392 (Closing Basis)
🎯 Target: ₹450–₹550
🔻 Weak below: ₹365
📘 For Educational Purpose Only | Bullish View
#FSL
GILLETTE BULLISH VIEW SWING🚨 Breakout Watch: Gillette 🚨
Bullish above ₹10,450 (Close)
📍 CMP: ₹10,400
🎯 Target: ₹13,000–₹16,500
❌ Invalid below: ₹9,500
📊 High Volatility — ATR%: 3.25 (Avg: 3.17)
📈 Golden Crossover: 50D > 200D
✅ Price above 50/100/200 MA
📈 RSI bullish — D: 65.36 | W: 66.9 | M: 71.3
📉 ADX: 47.62 | DMI spread: 56.72%
🔍 Donchian flat | Bollinger expanding (14.67%)
Watch ₹10,450 breakout for momentum!
(For Educational Purposes Only)
#Gillette

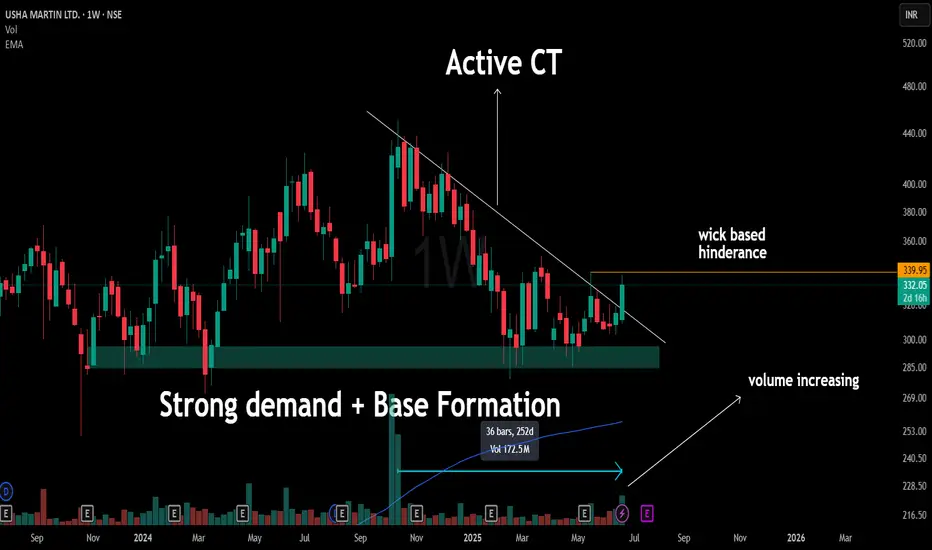
USHA MARTIN – Weekly Structure SnapshotA clean White CT that had acted as a multi-month resistance is now being engaged. Price is attempting to push above it, but the current candle is still developing — small-bodied so far, which is typical during early phases of structural tests on the weekly timeframe (WTF).
🟧 Just above lies a wick-based hindrance — a level that previously reacted with strong rejection. It's also where the current active CT had its last struggle, making it a structurally relevant zone, not something to ignore.
The base that formed in the ₹270–290 region stands out — multiple rejections without deeper breakdowns, a sign of demand stability. Volume expansion this week is notable — especially after 252 days of subdued activity — marking a shift in participation worth observing.
📌 This is not a prediction. Not a forecast. Not a trading call.
Just a structural walkthrough of what price is doing — and where attention has historically been paid.
Let the price write the story — our job is to read structure, not write headlines.
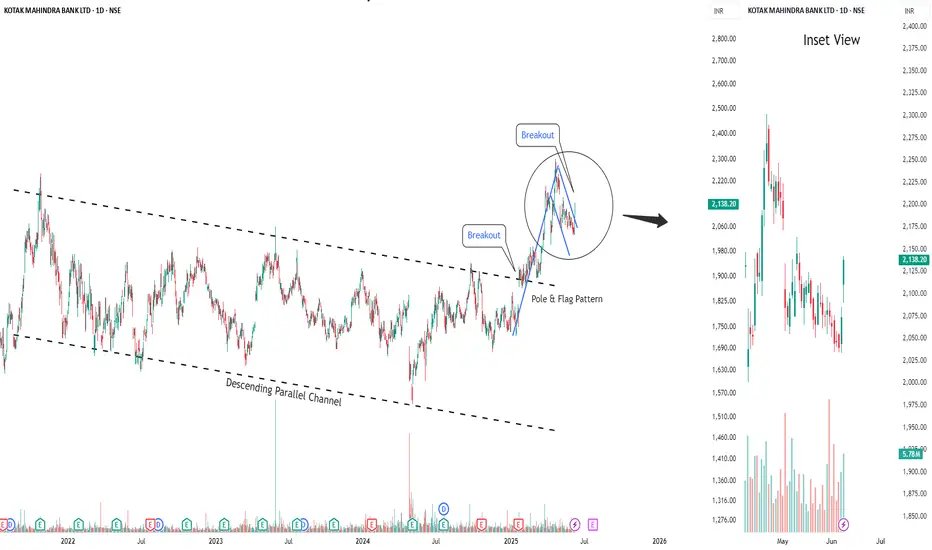
Buy Kotak Mahindra Bank Short Term Trading Advice by Goodluck Capital
Buy Kotak Mahindra Bank
Buy Range- 2100 - 2135
Target- 2200 - 2225
StopLoss- below 2060
Upside Potential- 4% -5%
Approx trade duration 7 - 8 days
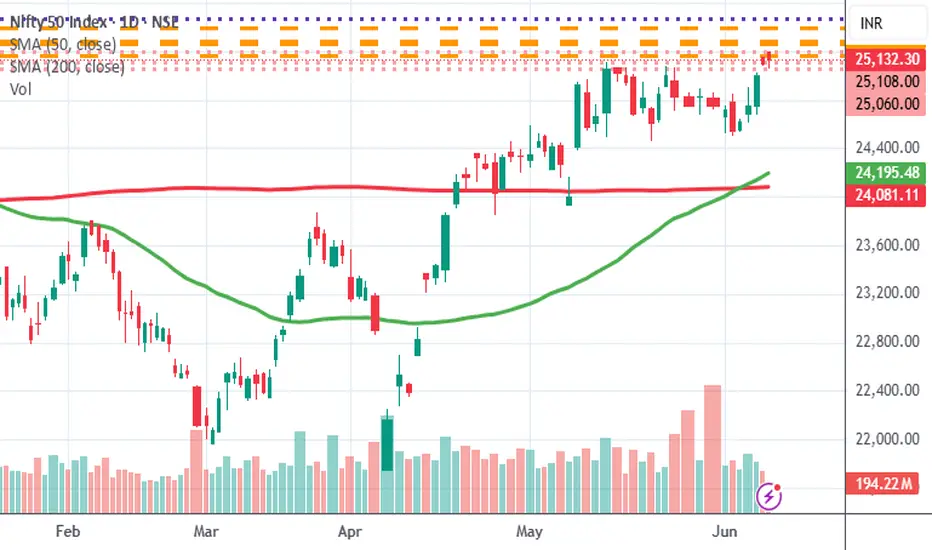
Nifty Likely to test 25260 - Set up in progressWatching Nifty as it forms a rising channel on the daily chart. If current momentum sustains, we may see a move forward 25,260 in the coming sessions.