Inside Bars After High Volume – CERA Setting Up Near Key CT📌 Timeframe: Weekly (WTF)
📌 Type: Technical Observation / Swing Structure
📌 Concept: Counter Trendline Breakout Setup
CERA is currently navigating a highly constructive zone from a swing trading lens. Here's what's developing technically:
🔹 Higher Low Formation:
The stock has established a higher low structure, with the white internal trendline offering visible support across recent weeks. Interestingly, this aligns perfectly with the 200-period EMA on the weekly timeframe, enhancing its significance as a dynamic support layer.
🔹 Volume Clues:
Two of the highest volume candles on the weekly chart have now been followed by inside bars, a potential sign of absorption or base building. This tightening within volume zones signals institutional interest and a possible buildup phase.
🔹 Supply Zone Identified:
An overhead supply (marked in orange)
🔹 EMA Context: The blue 200 EMA further reinforces the idea of Supportive price behavior around this line validates its role.
🔍 This post is for educational discussion only. No recommendation or forecast is implied. Please conduct your own due diligence.
Swingtrading

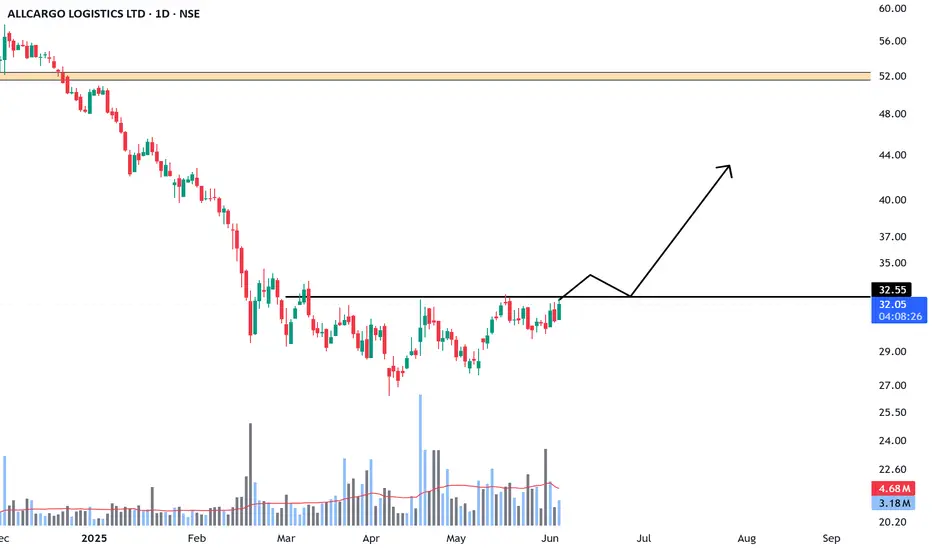
ALLCARGONSE:ALLCARGO
Good to keep on the radar
It's on the verge of BO...
Almost 70% down from ATH
Always respect SL & position sizing
========================
Trade Secrets By Pratik
========================
Disclaimer
NOT SEBI REGISTERED
This is our personal view and this analysis
is only for educational purposes
Please consult your advisor before
investing or trading
You are solely responsible for any decisions you take on the basis of our research.
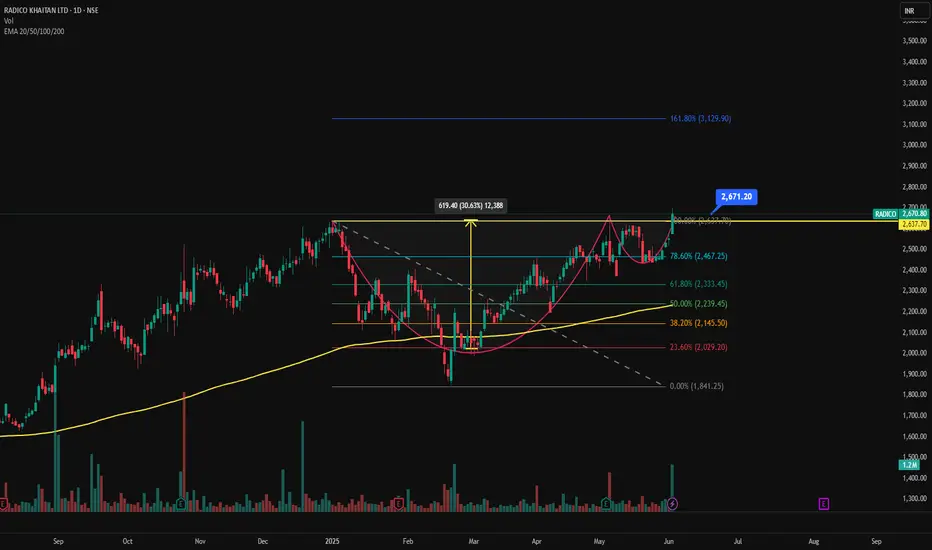
RADICO - Cup & Handle Breakout | Daily Chart📊 RADICO KHAITAN LTD (RADICO) – Cup & Handle Breakout | Daily Chart
📅 Chart Date: June 4, 2025
📈 CMP: ₹2,670.80 (+4.78%)
📍 Ticker: NSE:RADICO
🔍 Technical Breakdown
☕ Cup & Handle Breakout Confirmed
A classic Cup & Handle formation has played out with a bullish breakout above the neckline near ₹2,640–₹2,670. The pattern is well-structured, showing clear accumulation followed by a rounded bottom and brief consolidation.
📏 Measured Target:
The height of the cup (~₹620) projects an initial target near ₹3,129, aligning closely with the 161.80% Fibonacci Extension level.
⚙️ Indicators Used
🔹 Chart Pattern: Cup & Handle
📐 Fibonacci Retracement & Extension
📊 Volume Spike: Strong breakout volume
📈 EMA Cluster: 20/50/100/200-day — bullish alignment
🟢 EMA Support: Price sustaining well above EMAs; 200 EMA ~₹2,000
📍 Key Price Levels
✅ Breakout Zone: ₹2,640–₹2,670
🚀 Upside Targets:
📈 127.20% – ₹2,853
📈 161.80% – ₹3,129
📈 200% – ₹3,352 (extended swing target)
🛡️ Support Levels:
₹2,467 – 78.6% Fibo
₹2,333 – 61.8%
₹2,145 – 38.2%
₹2,029 – 23.6%
🔻 Invalidation/Stop: Closing below ₹2,467 (strong Fibo + EMA support zone)
💼 Trading Strategy
Entry: On breakout retest or strong close above ₹2,670
Stop Loss: ₹2,467
Target Range: ₹2,853 – ₹3,129 – ₹3,350+
Timeframe: Short to medium term swing
⚠️ Disclaimer
This analysis is for educational purposes only. Please do your own research or consult a financial advisor before making trading/investment decisions.
INDIAN BANKINDIANB - The stock has broken out of the ascending channel and is now above the horizontal resistance around 625. This breakout is supported by strong volume, confirming bullish momentum and a clear higher highs and higher lows pattern, indicating a bullish trend. Price action is respecting the trendline well before the breakout—immediate resistance 655 and 670, and short-term target 695.

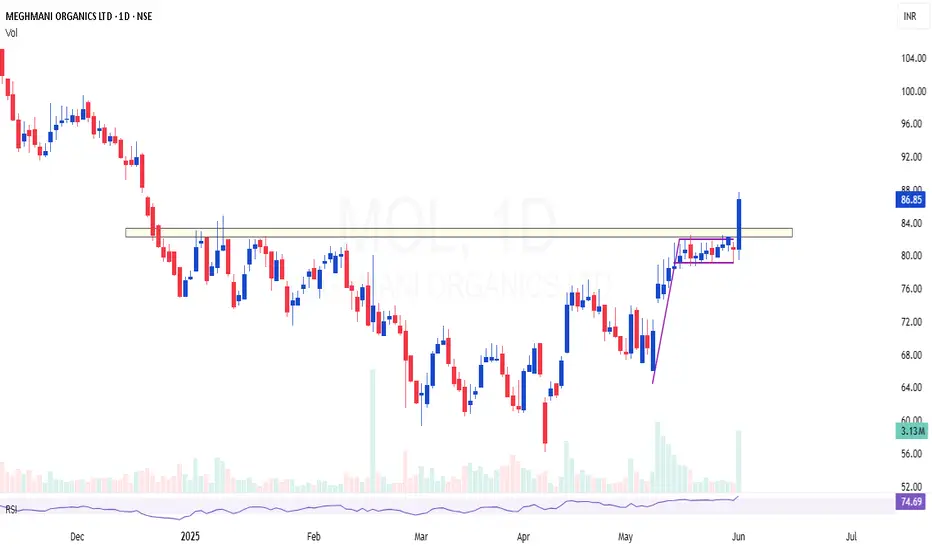
MOL | Breakout Above Supply Zone | Flag + 200 EMA ConfluenceMOL | Strong Breakout Above Supply Zone | Flag + 200 EMA Confluence
Previously shared around the ₹70 level — now showing clear strength with a decisive breakout above the supply zone, backed by strong volume.
✅ Breakout Confirmation: Price has convincingly breached previous resistance, which now acts as support. The volume accompanying this move adds weight to the breakout.
📈 Flag Formation (Daily Timeframe): A clean bull flag is visible on the daily chart — a classic continuation pattern indicating further upside potential.
📉 200 EMA Support: The 200 EMA is holding well and aligns perfectly as a dynamic support, reinforcing the current bullish structure.
🧾 Fundamentals Supporting the Technicals: Recent quarterly results suggest the bottom may already be in place, adding a fundamental tailwind to the technical setup.
🟢 Conclusion: This zone offers an excellent area of value for swing traders and position holders. Watch for sustained momentum and retests as potential entries.
BEPL | Yet another good monthly candle at excellent areaBEPL | Yet another good monthly candle
Excellent area of value at this location
Breakout after 7 years consolidation and retesting
High probable setup for doubling
CMP : 119

PEL : Swing Pick#PEL #trendingstock #breakoutstock #Momentumstock
PEL : Swing Trade
>> Trending setup
>> Breakout candidate
>> Stock in Momentum
>> Rounding bottom in formation
>> Low Risk High Reward Trade
Swing Traders can lock profit at 10% and keep trailing
Disc : Charts shared are for Learning purpose and not a Trade recommendation
Consult a SEBI Registered Advisor before taking position in it.
The Above Stock analysis is done purely on the technical basis only & Technical analysis is also 100% full proof. so i reserve the right to be wrong, if thats d case it will be learning experience.

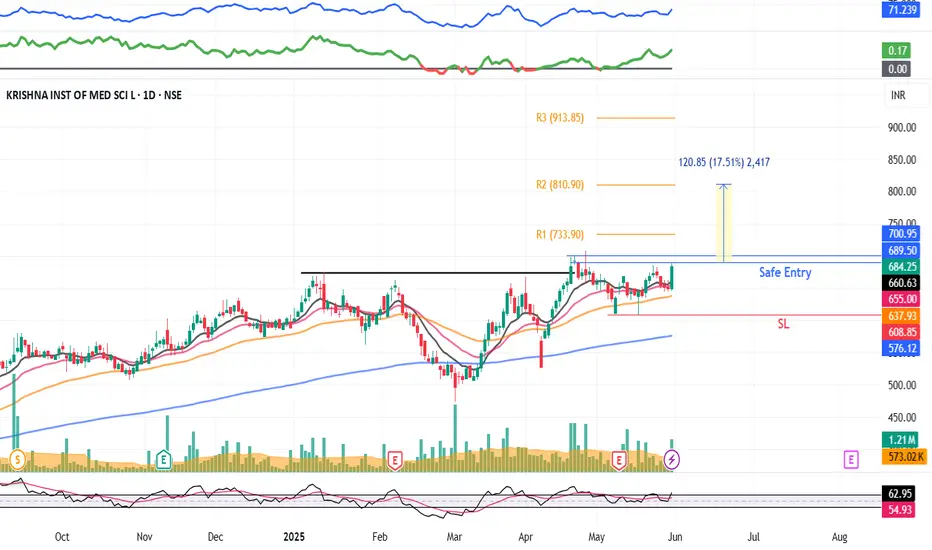
KIMS : Swing pick#KIMS #Swingtrade #trendingstock #breakoutstock
KIMS : Swing Pick
>> Breakout Stock
>> Trending setup
>> Good Strength in Stock
>> Good Volumes Buildup
>> Good Upside Potential
Swing Traders can lock profit at 10% and keep trailing
Disc : Stock charts shared are for Learning purpose not a Trade recommendation.
Consult a SEBI Registered Advisor before taking position in it.
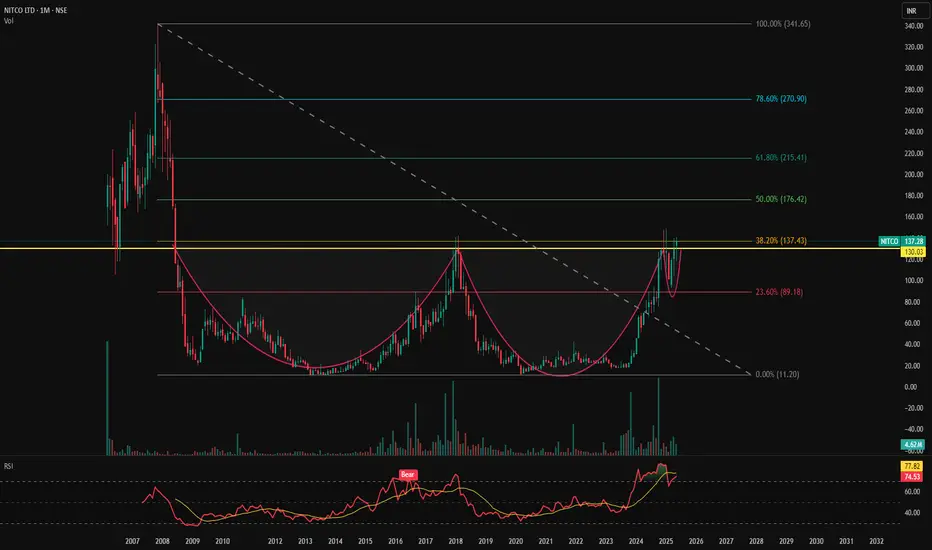
NITCO LTD | Monthly Chart Analysis📊 NITCO LTD (NSE:NITCO) | Monthly Chart Analysis
📅 Date: June 1, 2025
📈 CMP: ₹137.28 (+6.02%)
📌 Ticker: NSE:NITCO
📉 Chart Pattern Insight
🏆 Massive Cup and Handle Breakout Formation (18-Year Base)
NITCO is breaking out of a textbook multi-decade Cup and Handle pattern, forming over 17+ years. This type of structural breakout on a monthly timeframe is rare and typically leads to multi-fold rallies.
💥 The breakout zone lies around ₹130.03 – previously a strong resistance from 2007, 2017, and now being tested again with a strong monthly close above it.
📊 Indicator: RSI + Moving Average Cross (Icon shown)
🔎 RSI (Relative Strength Index): Currently at 74.53, signaling strong bullish momentum
📈 RSI has also crossed above its moving average, and the "Bear" label in the past has flipped, suggesting a shift in long-term trend direction.
🔑 Key Levels
🔸 Breakout Zone: ₹130.03 (now acting as support)
🎯 Target Zones (based on Fibonacci & historical zones):
₹180
₹250
₹320+
🛡️ Stop Loss (Monthly Close Below): ₹120
💡 Trading Strategy
Entry: On successful retest and hold above ₹130
SL: ₹120 (monthly candle close basis)
Target: Positional hold for ₹180–₹320+
Time Frame: Long-term multi-month to multi-year potential
⚠️ Disclaimer
This is for educational purposes only. Please do your own research or consult a registered advisor before taking positions.
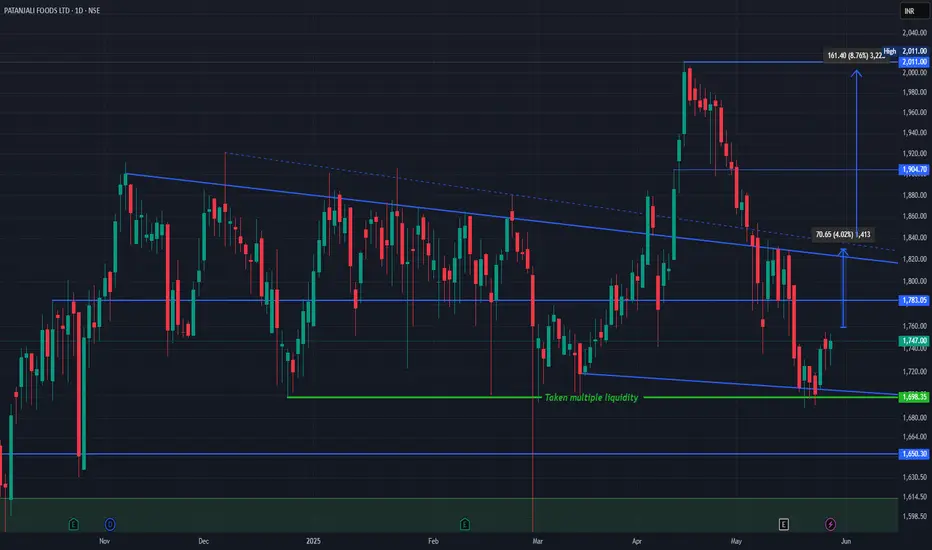
Patanjali Foods Ltd (NSE: PATANJALI) technical chart breakdown.Patanjali Chart Structure & Price Action
The stock has been trading within a descending channel, bounded by the blue trendlines.
It recently bounced from a major demand zone (~₹1,698) marked by the green support line that has absorbed liquidity multiple times ("Taken multiple liquidity").
Price is now slowly recovering from this base.
Current Scenario
CMP: ₹1,747
Immediate Resistance:
₹1,783 (horizontal level)
₹1,818–₹1,835 zone (upper boundary of the falling channel)
Break and sustain above ₹1,783–₹1,835 could trigger a trend reversal.
Upside Targets
Target 1: ₹1,830/Target 2: ₹1,904
Previous structural high Target 3: ₹2,011 Recent swing high Total upside from breakout: ~8.76%
Support Levels
₹1,698 – Critical demand zone (green)
₹1,650 – Next strong support
₹1,570 – Long-term support base (green zone)
Simple Explanation
Patanjali Foods rebounded from a high-liquidity support area and is now showing signs of bullish recovery. A breakout above ₹1,783 could take it back to the ₹1,900–₹2,000 range. Risk is well-defined below ₹1,698. Watch for volume and price action confirmation near the upper channel.
Like, comment your thoughts, and share this post
Explore more stock ideas on the right hand side your feedback means a lot to me!
Disclaimer: This post is for educational purposes only and should not be considered a buy/sell recommendation.
BANCOINDIA Breakout Stock Long Entry🚨 Breakout Watch: BANCOINDIA 🚨
Bullish above ₹580 (CLB)
📍 CMP: ₹572
🎯 Target: ₹650–₹800
❌ Invalid below: ₹540
📊 Volume up by 21.11%
📈 RSI strong — Daily: 78.57 | Weekly: 69.82 | Monthly: 66.80
📉 ADX: 42.6 with 79.29% DMI spread — very strong trend
🔍 Price above 50/100/200 MA, Donchian flat, Bollinger expanding (109.96%)
Watch ₹580 breakout for upside!
(For Educational Purposes Only)
#BANCOINDIA

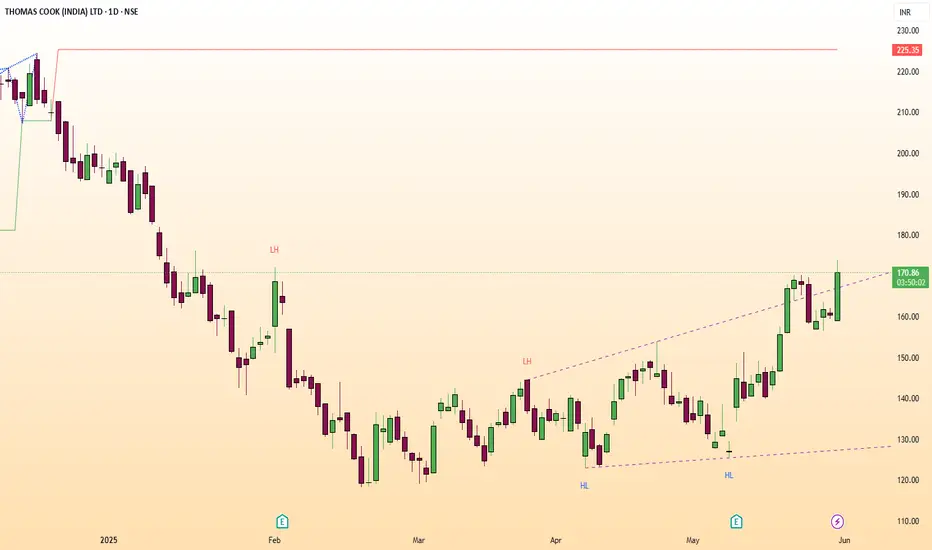
THOMASCOOK LONG ENTRY🚨 Breakout Watch: Thomas Cook 🚨
Bullish above ₹171 (Close). CMP ₹170. Target ₹200–₹240+. Invalid below ₹140.
Volume spiked 818%. RSI strong across timeframes (D: 65.97, W: 55.68, M: 53.65).
ADX 27.92 with 62.96% DMI spread — strong trend.
Price at upper Donchian. Bollinger Bands expanding (45.58%).
Watch ₹171 breakout!
(For Educational Purposes Only)
#ThomasCook
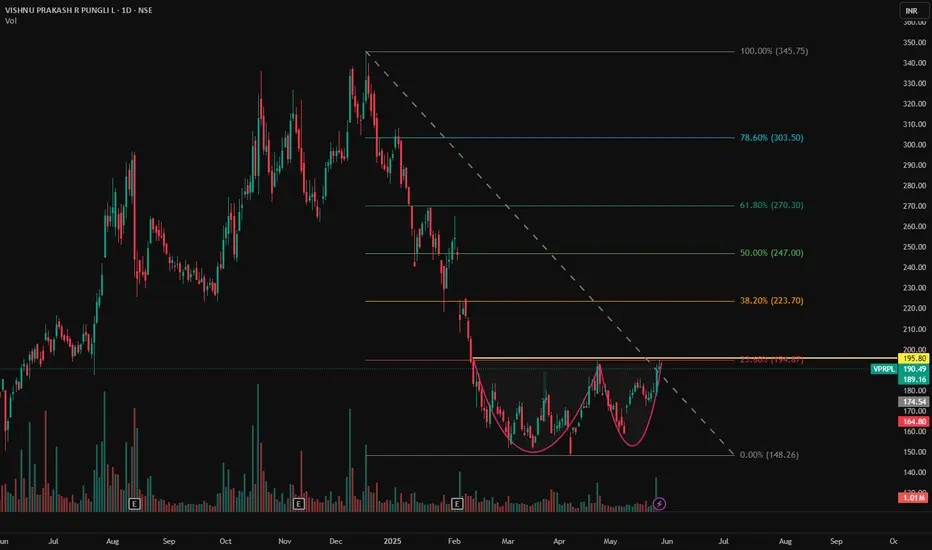
VPRPL - NSE | Daily Timeframe📊 VISHNU PRAKASH R PUNGLIA LTD (VPRPL) – NSE | Daily Timeframe
📅 Date: May 29, 2025
📈 CMP: ₹190.49 (−0.41%)
📌 Ticker: NSE:VPRPL
🧠 Technical Overview
✅ Cup & Handle Pattern in Formation 🍵
Price action is carving out a clean Cup & Handle base near the ₹195.80 resistance zone. A breakout above this neckline could ignite a fresh upside rally. The symmetry, volume spike, and recent bullish structure are all supporting potential continuation.
🧪 Volume Analysis
Noticeable volume increase as the price nears breakout zone, indicating accumulation and rising interest.
📍 Key Levels to Watch
🟡 Breakout Resistance:
₹195.80 (horizontal neckline)
🟢 Support Zone:
₹174.50 (base support of the cup)
₹165 (lower handle risk zone)
🎯 Potential Targets (Post Breakout):
₹220
₹240
₹265 (pattern-measured target zone)
💡 Trade Plan
Entry (on breakout): ₹196+ (with strong volume confirmation)
Stop Loss: Below ₹174
Target Range: ₹220–₹265
Risk-Reward: ~1:2.5+
⚠️ Disclaimer
This chart analysis is for educational purposes only. Always DYOR (Do Your Own Research) and consult a financial advisor before making investment decisions.
Everyone’s Buying MMTC… I’m Waiting for this to happen✅ CT Breakout (WTF): Well-defined CT break cleared with strong bullish momentum.
✅ Volume Confirmation: Breakout candle accompanied by 269M+ volume, signaling genuine interest.
✅ Structure: Higher low before breakout reinforces structural reliability.
✅ Base Formation: Multiple weeks of tight consolidation at base builds a solid foundation for the move.
⚠️ Caution – DTF Overextension: On the daily timeframe (DTF), price shows back-to-back green candles, indicating a short-term overbought condition.
A retracement is healthy and preferred. A direct move from here risks a poor R:R swing
📌 Conclusion:
Solid weekly breakout with all structural prerequisites in place. However, due to the extended DTF structure, wait for a healthy pullback before initiating swing entries. Avoid chasing strength. Let the price offer a clean opportunity.
🔁 Following the yellow path = strategic patience + optimal R:R.

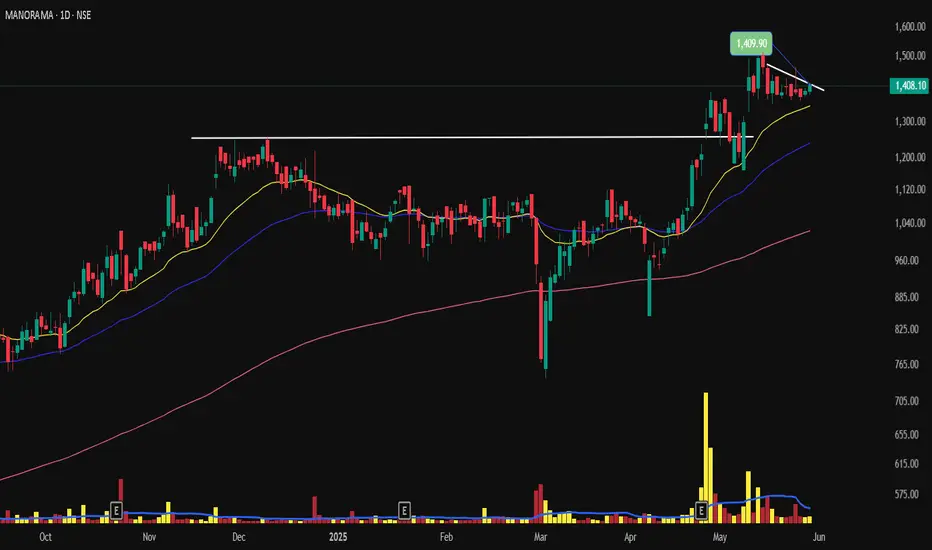
Long base setup A good long base consolidation and breakout and then price taking support at 21 EMA can be considered for swing with SL 1353
DBREALTY BREAKOUT STOCK📌 Stock Name: DBREALTY
(For Educational Purpose Only)
🔼 Breakout Above: 195 on Closing Basis
🚀 Ready for Upside : 240
🔽 Weak Below: 160
💰 Price: 190
📦 Volume
🔻 -63.63% vs previous session (Low Volume)
⚡ Volatility (ATR%)
📉 Current ATR%: 4.16%
📊 20-Day Avg ATR%: 5.14%
📈 Moving Averages
✅ Price > 50, 100, 200 DMA
🌟 Golden Crossover: 50D > 200D → Bullish
💪 RSI
🔹 Daily RSI: 60.41 → Bullish
🔹 Weekly RSI: 57.66 → Bullish
🔹 Monthly RSI: 55.67 → Bullish
📊 ADX / DMI
🟢 ADX: 31.64 (▲ 2.77%) → Strong Trend
📏 DMI Diff: 59.89%
✅ Daily / Weekly / Monthly: Bullish
📉 Donchian Channel
✅ Price > Middle Band
➖ Bands Flat
📏 Width: 23.24%
☁️ Ichimoku Cloud
✅ Price > Cloud
🔺 Tenkan > Kijun → Bullish Setup
🌫️ Future Cloud Width: 14.42%
📊 Bollinger Bands
✅ Price > Middle Band
📈 Bands Rising → Bullish Setup
📏 Width: 21%
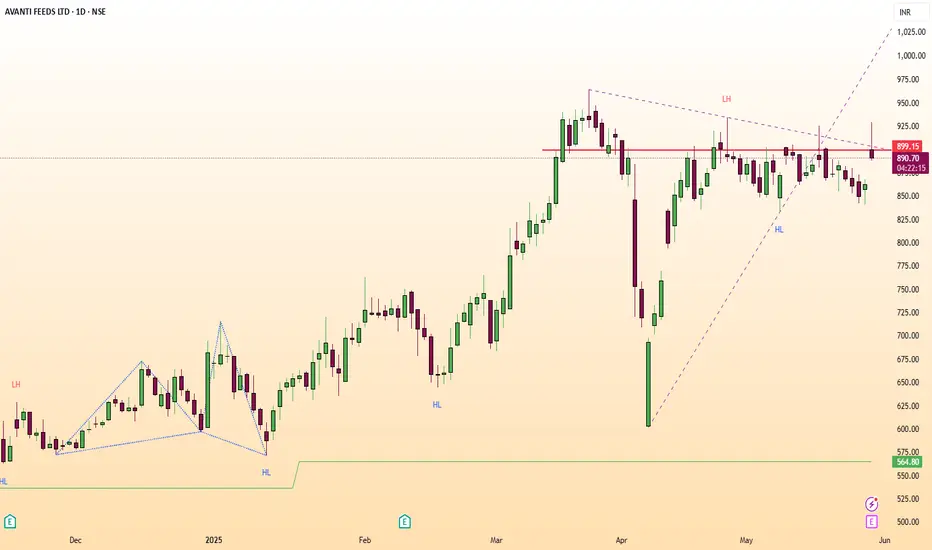
AVANTIFEED Breakout StockGood Above 900 on Closing Basis.
For Educational Purpose only.
Rationale:-
Volume:
Volume is greater than previous session by 848.49%.
Volume is greater than last 10 sessions average volume.
Volume is greater than last 10 sessions volume. That is a high volume.
Highest volume marked in last 20 sessions. That is a volume spurt.
Volatility:
ATR% of the stock is 3.96%
Average of last 20-day is 4.33%
Moving Average Observations:
Price remains above 200-day Moving average.
Price went above 50-day Moving average in the current session, it is a bullish crossover.
Price above 50-day, 100-day and 200-day Moving average.
Moving average alignment is bullish. It is an uptrend & a bullish setup.
RSI Observations:
The Daily RSI indicator has crossed above 50 in the current session. Current Daily RSI reading is 56.32.
The Weekly RSI indicator has remained above 50. This is a bullish zone. Current Weekly RSI reading is 60.34.
The Monthly RSI indicator has remained above 70. Current Monthly RSI reading is 72.59.
ADX Observations:
The Daily DMI position turned bullish. Its a bullish crossover.
The Daily ADX went up by 4.34%. Current ADX reading is 10.76.
The Daily distance between DMI lines is 28.43%.
The Weekly DMI position remains bullish.
The Monthly DMI position remains bullish.
Donchian Channel Observations:
Price is above middle Donchian channel (Bullish).
Price is at Upper Donchian channel band.
Upper band is rising. 20-day new high marked.
Difference between bands is 11.53%.
Ichimoku Observations:
Price above Ichimoku clouds.
Clouds are bullish.
Tenkan line went above Kinjun line in current session. Bullish crossover.
Tenkan line is above Kijun line. Ichimoku setup is bullish.
Current cloud range is 1.25% and Future cloud range is 11.34%.
Bollinger Band Observations:
Price is above middle Bollinger band (Bullish).
Price is above Upper Bollinger band.
Bands are expanding.
Difference between bands is 6.05%.
Inverted Head & Shoulders Breakout | VIKAS LIFESCIENCES🟡 Structure Breakdown:
Left Shoulder: A lower low, continuing the bearish trend.
Head: A deeper low marking the climax of selling.
Right Shoulder: A higher low—a pivotal sign of accumulation and shifting sentiment.
✅ Supply-Demand Flip Zone Cleared:
Price has convincingly closed above the green zone, which acted as both prior supply and recent demand—now serving as a supportive launchpad.
✅ Counter-Trendline (CT) Breakout:
A clean breakout of the white counter-trendline confirms the structural reversal. This breakout is not only technical—it’s also volume-backed with ~24M shares traded, reinforcing conviction.
✅ Volume Confirmation:
Breakout accompanied by surging volume—an essential ingredient for validating any bullish setup. Indicates institutional activity or broader market participation.

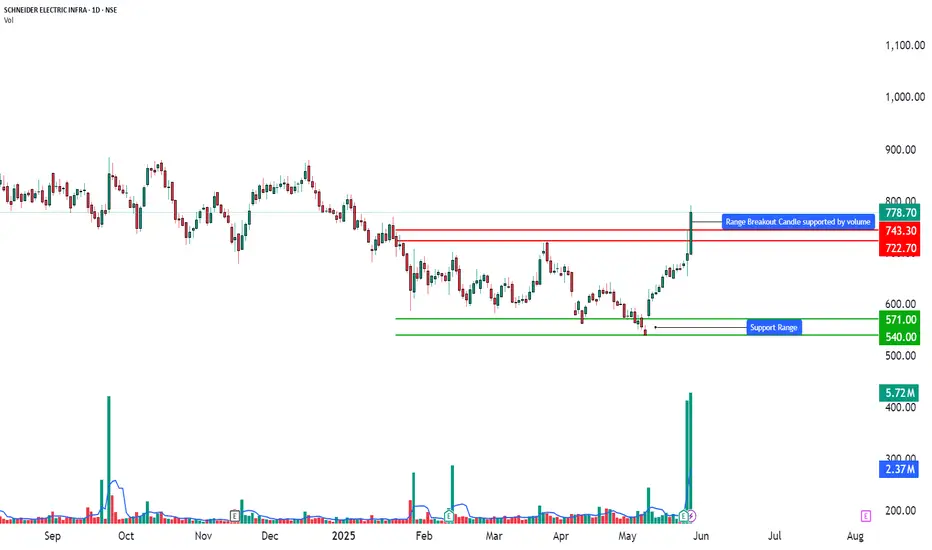
Technical Analysis - 52-Week Volume Breakout📈 SCHNEIDER ELECTRIC INFRA – TECHNICAL ANALYSIS
📆 Date: May 28, 2025
🔍 Timeframe: Daily
________________________________________
Price Action:
Schneider Electric Infra soared over 11.5% today with a strong bullish candle breaking above recent consolidation levels. This wide-range breakout candle marks a 20-day and 52-week volume breakout, indicating heavy accumulation and institutional participation. The price surged from support near ₹570 to close around ₹778.70, confirming bullish momentum.
________________________________________
Chart Pattern / Candlestick Pattern:
• Breakout Setup
• 52-Week High Breakout
• Bullish Candle with strong body and large volume
• BB Squeeze Breakout (Volatility Expansion Expected)
• Bollinger Band Expansion
• Volume Spike – highest in over a year
• Daily Chart: Bullish Initiation pattern on Heikin Ashi
• Weekly Chart: Bullish Continuation pattern formed
• Monthly Chart: Spinning Top, but with bullish undertones confirmed by volume
• Recent Candles: Long White Candle patterns on daily and monthly charts (May 28, 2025)
________________________________________
Technical Indicators:
• RSI (Daily): 79 – Strong bullish territory
• MACD: Bullish crossover active
• Stochastic: 95 – Overbought but shows strong momentum
• CCI: 188 – Momentum phase, institutional buying signs
• Volume: 5.72M – Extremely high, 20-day volume breakout
________________________________________
Support & Resistance Levels:
• Immediate Resistance: ₹814.75
• Next Resistance: ₹850.80
• Major Resistance: ₹910.20
• Immediate Support: ₹719.30
• Secondary Support: ₹659.90
• Major Support: ₹623.85
• Weak Support Zone: ₹570–₹550
________________________________________
Chart Overview:
The chart highlights:
🔸 Strong bullish candle piercing prior resistance
🔸 Volume breakout aligned with price breakout
🔸 Clear resistance cluster above ₹814–₹910
🔸 Support zone well established below ₹720
🔸 Multiple confirmations from indicators and volume surge
🔸 Entry was marked at ₹791.40 with SL at ₹651.85
________________________________________
Educational Breakdown:
This is a textbook breakout with volume confirmation setup:
• Price Action: Breakout from resistance zone
• Momentum Indicators: Strongly aligned
• Volume: Institutional spike with confirmation of trend continuation
• Band Expansion: Signals beginning of high volatility trend
• Entry Confirmation: RSI + BB + Volume breakout + Trend indicators
This setup indicates a fresh trend beginning post-accumulation phase, making it suitable for swing to positional trades. The aggressive rise also suggests short-term profit-taking zones near the immediate resistance, while medium-term targets remain valid.
________________________________________
How to Trade Schneider Electric Infra (for learning purpose):
• Entry Example: ₹791.40
• Stop Loss: ₹651.85 (Risk: ₹139.55)
• Target 1: ₹930.95 (Reward: ₹139.55)
• Target 2: ₹1070.45 (Reward: ₹279.05)
• Sample Quantity: 50 shares
• RR Ratio: 1:1 to 1:2
• Aggressive Traders: Can ride trend with trailing stop
• Conservative Traders: Wait for pullback near ₹720–₹700 before entry
⚠️ Risk Management Tip: Always trade with a clearly defined stop loss. Avoid entering positions impulsively. It is advisable to start with a smaller quantity and increase your exposure only if the price action confirms the continuation of the trend. Capital protection should always be the priority.
📢 Disclaimer
This content is created purely for educational and informational purposes. It is not intended as investment advice, stock recommendations, or trading tips. Trading and investing in the stock market involves risk. Please consult with a SEBI-registered financial advisor before making any investment decisions. The author/creator is not registered with SEBI and shall not be held responsible for any losses incurred based on this information. Always do your own research and use proper risk management.
👉 If you found this analysis helpful, don’t forget to Follow, so you never miss out on a trade-worthy setup, breakout opportunity, or valuable educational insight again. Stay updated and trade smarter! 💡📈
Bharat Dynamics Ltd (BDL)🚀 BDL - Technical Breakout in Play!
Weekly breakout above key resistance zone 🔥
Pattern: Double Bottom ➕ Break of Monthly Mother Candle High
Potential Upside:
🎯 Target 1: ₹1968.50
🎯 Target 2: ₹2590.00

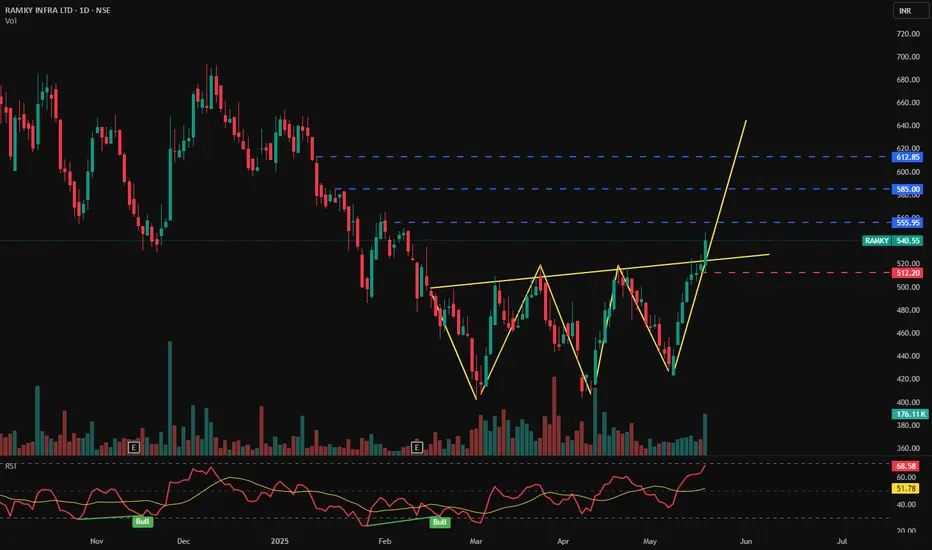
RAMKY INFRA LTD - Bullish Pattern📊 RAMKY INFRA LTD (1D) – CMP ₹540.55
📅 Date: May 21, 2025
📈 Exchange: NSE
📌 Ticker: RAMKY
🧠 Technical Analysis Overview
✅ Bullish Inverse Head & Shoulders Pattern:
Price has broken out of a clearly formed inverse head and shoulders pattern — a powerful trend reversal structure — indicating a strong bullish sentiment and possible long-term uptrend.
✅ Breakout Confirmation:
A sharp breakout above the neckline near ₹512 has occurred with strong bullish momentum and increased volume.
✅ RSI Indicator – 📈
RSI is at 68.58, approaching overbought levels but not showing divergence yet, confirming continued bullish strength. The RSI trend also shows recent bullish crossovers.
📍 Key Price Levels
📌 Support
🟥 ₹512.20 – Neckline retest level (ideal re-entry zone)
📌 Resistance (Targets)
🔵 ₹555.95 – Immediate target
🔵 ₹585.00 – Mid-term resistance
🔵 ₹612.85 – Major resistance / final target from pattern projection
💬 Potential Strategy
Breakout Entry already active above neckline
Pullback Entry possible near ₹512–₹520
SL below ₹512
Target 1: ₹555
Target 2: ₹585
Target 3: ₹612+
📌 Conclusion
RAMKY INFRA is breaking out of a strong inverse head and shoulders pattern with bullish volume and RSI confirmation. Watch for a potential retest near ₹512 for a high-probability entry. Targets lie ahead at ₹555, ₹585, and ₹612.
🛑 Disclaimer:
This analysis is for educational purposes only. Not investment advice. Always DYOR or consult your financial advisor.
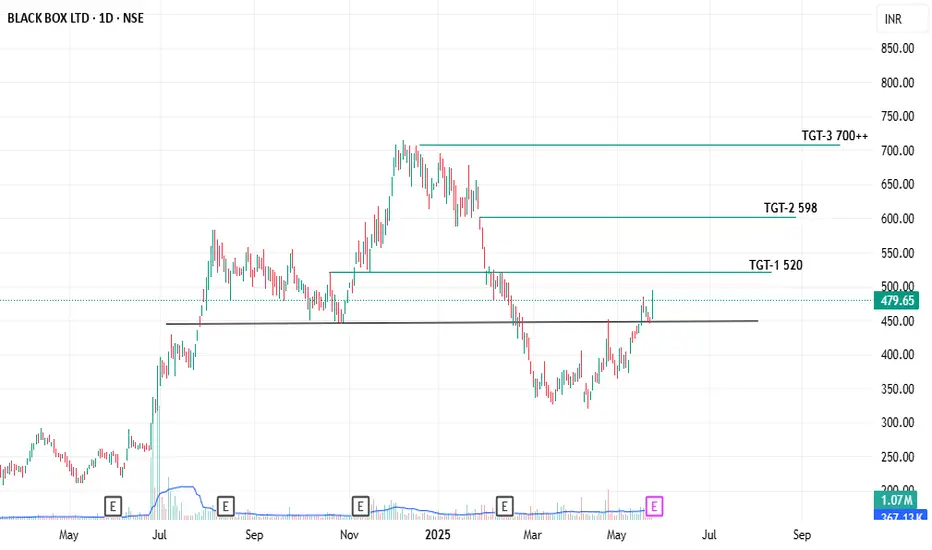
SWING/POSITIONAL PICKTechnical View
Stock Has Effectively Broken Previous Support. Support Acts As Resistance And Gives Breakout With Retest. Buy At CMP 480. TGT 520/598/700+++. SL Below 450 Closing Basis.
Fundamental
EBITDA Highest In History. PAT Is Also Highest In History. Positive Cashflow. FII And DII Increase Stake By Last Qtr.
I Am Not SEBI Registered Research Analyst. It Is Giving Only Educational Purpose. Trade In BBOX After Discussing With Your Financial Advisor.
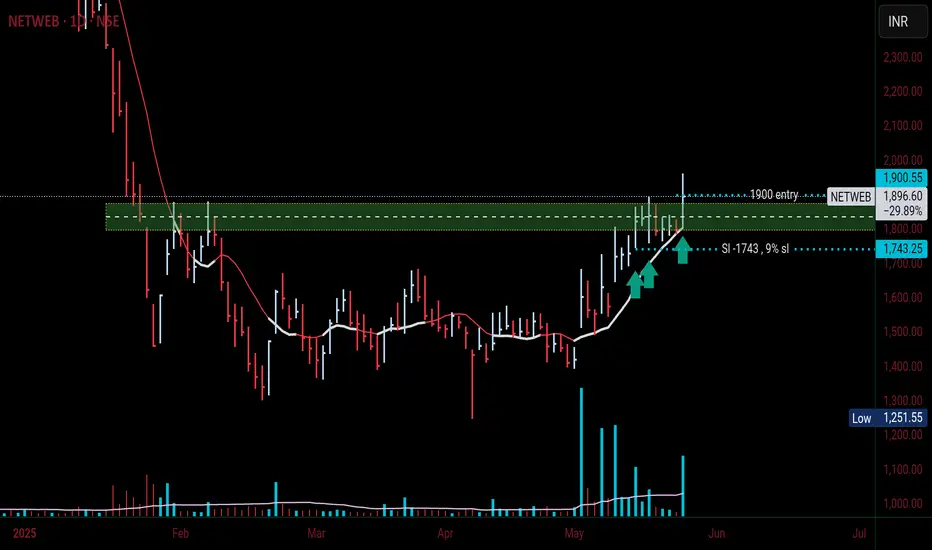
NetwebGood volume ✓
Tight range ✓
Break out with volume ✓
Previous buyer respected ✓
9 % sl why here put my sl , because previous buyer seen here. Target 20% half book half trailing with sma10
Why i consider this?
- it break out previous resistance
- it respected previous buyer candle
Yah, that it