Intraday Trading vs. Swing Trading: A Detailed Comparison1. What Is Intraday Trading?
Intraday trading, also known as day trading, involves buying and selling financial instruments within the same trading session. All positions are closed before the market closes, and no trades are carried overnight.
Intraday traders profit from small price fluctuations using high volume, leverage, and precise timing. The focus is on short-term momentum, liquidity, and volatility.
Key Characteristics of Intraday Trading
Trades last from a few seconds to a few hours
No overnight risk
High frequency of trades
Requires continuous screen monitoring
Strong dependence on technical indicators
Sensitive to news and market sentiment
2. What Is Swing Trading?
Swing trading aims to capture short- to medium-term price swings over several days to a few weeks. Positions are held overnight and sometimes across market cycles.
Swing traders rely on trend analysis, support and resistance levels, and market structure rather than minute-to-minute price action.
Key Characteristics of Swing Trading
Trades last from 2 days to several weeks
Positions are held overnight
Lower trade frequency
Less screen time required
Combination of technical and fundamental analysis
Focus on broader market trends
3. Time Frame and Trade Duration
Intraday Trading
Time frames used: 1-minute, 5-minute, 15-minute charts
Trades aim to capture quick price movements
High pressure due to fast decision-making
Traders must act instantly on signals
Swing Trading
Time frames used: Daily, 4-hour, and weekly charts
Trades allow time for trends to develop
More patience required
Decisions can be planned after market hours
4. Capital Requirement and Leverage
Intraday Trading
Often requires higher capital
Leverage is commonly used
Brokers offer margin benefits for intraday trades
Small adverse moves can cause quick losses
Swing Trading
Lower leverage compared to intraday
Less dependence on margin
Suitable for traders with moderate capital
Lower risk of forced liquidation
5. Risk Exposure and Volatility
Intraday Trading Risks
Sudden price spikes
Slippage during high volatility
Emotional stress due to rapid price movement
Overtrading risk
Swing Trading Risks
Overnight gap risk
News and earnings impact
Broader market risk
Requires wider stop-losses
Despite overnight risk, swing trading often has better risk-to-reward ratios than intraday trading.
6. Profit Potential and Consistency
Intraday Trading
Smaller profits per trade
Requires many successful trades for consistency
High transaction costs (brokerage, taxes)
Suitable for traders seeking daily income
Swing Trading
Larger profit targets
Fewer trades, higher quality setups
Lower transaction costs
Better suited for wealth building
7. Technical Analysis Tools Used
Common Intraday Indicators
VWAP (Volume Weighted Average Price)
Moving Averages (9, 20 EMA)
RSI (short-period)
MACD (fast settings)
Order flow and volume profile
Common Swing Trading Indicators
Support and resistance
Fibonacci retracement
Trendlines and channels
RSI (14-period)
Moving averages (50, 100, 200)
Swing traders rely more on price action and structure, while intraday traders focus on speed and momentum.
8. Psychological Demands
Intraday Trading Psychology
High stress and pressure
Requires emotional discipline
Fear and greed act faster
Quick recovery from losses is essential
Swing Trading Psychology
Requires patience and trust in analysis
Managing uncertainty overnight
Avoiding panic due to short-term noise
More suitable for calm personalities
Psychology often determines success more than strategy.
9. Lifestyle and Time Commitment
Intraday Trading
Full-time commitment
Requires presence during market hours
Not suitable for working professionals
Highly demanding mentally
Swing Trading
Part-time friendly
Ideal for professionals and students
Analysis can be done after market hours
Better work-life balance
10. Market Conditions Suitability
Intraday Trading Works Best When:
Market is highly volatile
Strong intraday trends exist
Liquidity is high
News-driven moves occur
Swing Trading Works Best When:
Clear trends are present
Markets are stable
Volatility is moderate
Broader market direction is defined
11. Taxation and Costs (General View)
Intraday trading usually attracts higher taxes and transaction costs
Frequent trading increases brokerage expenses
Swing trading is more tax-efficient due to lower turnover
(Tax rules vary by country and should be checked locally.)
12. Who Should Choose Intraday Trading?
Intraday trading is suitable for traders who:
Can dedicate full market hours
Handle high stress and fast decisions
Have strong discipline and execution skills
Prefer daily profit opportunities
13. Who Should Choose Swing Trading?
Swing trading is suitable for traders who:
Prefer planned trades
Have limited time during market hours
Aim for higher risk-reward trades
Want consistent growth with lower stress
14. Intraday vs. Swing Trading: Key Differences Summary
Aspect Intraday Trading Swing Trading
Holding Period Same day Days to weeks
Risk High, fast Moderate
Screen Time Very high Low
Leverage High Low
Stress Level High Moderate
Suitable For Full-time traders Part-time traders
Conclusion
Both intraday trading and swing trading are effective trading styles when practiced with discipline, proper risk management, and a clear strategy. Intraday trading offers faster feedback and daily opportunities but comes with higher stress and execution risk. Swing trading provides more flexibility, better risk-reward potential, and a balanced lifestyle but requires patience and the ability to handle overnight uncertainty.
There is no universally superior trading style. The best approach is the one that matches your personality, capital, time availability, and psychological comfort. Many successful traders even combine both styles, using intraday trades for short-term opportunities and swing trades for broader market moves.
Swingtradingsetup

Swing Buy Setup - BAJAJAUTO || Weekly ChartNSE:BAJAJ_AUTO
Price is holding above rising channel support and showing rejection from EMA + trendline confluence — classic continuation structure.
🔹 Buy Zone: Sustained move above ₹9,230
🔹 Stop Loss: Below breakout candle low (~₹8,970)
🔹 Targets:
🎯 T1: ₹9,480
🎯 T2: ₹9,880
🧠 Logic
Higher-high, higher-low structure intact
EMA acting as dynamic support
Tight risk for a clean upside expansion
No prediction. Only execution if price confirms.
Breakout holds → stay with trend. Breakout fails → exit fast.
Keep Learning,
Happy Trading.

Swing Trading Secrets1. The Secret of Trend Recognition
The biggest secret of profitable swing trading is identifying the dominant trend of the market. Most novices try to pick tops and bottoms, but professionals follow the path of least resistance. Trend recognition means:
Uptrend: Higher highs (HH) + higher lows (HL)
Downtrend: Lower highs (LH) + lower lows (LL)
Range: Price oscillates between support and resistance
Swing traders do not predict; they react. They align trades with the existing trend.
For example:
In an uptrend, they wait for pullbacks to key levels.
In a downtrend, they short the rallies.
In a range, they buy at support and sell at resistance.
Knowing the trend keeps traders on the right side of probability.
2. The Secret of Patience and Timing
Effective swing traders don’t enter randomly. They wait for specific conditions:
A. The market must be near a key level
Trendline touch
Moving average support (e.g., 20-EMA, 50-EMA)
Fibonacci retracement (38.2%, 50%, 61.8%)
Previous swing high/low
Volume clusters
B. Price must confirm the reversal or continuation
Patience allows the market to “show its hand” before entering.
The secret: wait for the candle close, not the candle forming.
Many traders lose because they enter too early. Timing matters more than direction.
3. The Secret of Multi-Timeframe Confluence
Professional swing traders use multiple timeframes:
Higher timeframe (HTF): 1-week or 1-day → Trend direction
Trading timeframe (TTF): 4-hour or 1-day → Entry zones
Lower timeframe (LTF): 1-hour or 15-min → Entry trigger refinement
This is called top-down analysis.
If the weekly chart shows an uptrend, the daily chart shows a pullback, and the 4-hour chart shows a bullish reversal pattern, the probability of success becomes extremely strong.
Multi-timeframe alignment is a powerful edge.
4. The Secret of High-Probability Patterns
Swing traders rely on chart patterns—not lots of patterns, just a handful of powerful ones that repeat reliably.
A. Continuation Patterns
Bull flag
Bear flag
Ascending triangle
Descending channel
These indicate that the trend is likely to continue.
B. Reversal Patterns
Double top / double bottom
Head and shoulders
Morning star / evening star
Hammer / shooting star
C. Breakout Patterns
Cup and handle
Range breakout
Consolidation breakout
Professional traders focus on clean patterns. If the pattern is messy, overlapping, or unclear, they move on.
5. The Secret of Volume Analysis
Price shows direction; volume shows conviction.
High-probability swing trades usually show:
High volume on breakouts
Low volume on pullbacks
High volume on reversal candles
Volume spikes at support/resistance
Volume acts like a lie detector. If a breakout happens on weak volume, it is often a trap.
Understanding volume helps traders avoid false signals.
6. The Secret of Risk Management
Most swing traders fail not because their strategy is bad but because their risk management is weak.
Professionals follow these golden rules:
Risk only 1–2% of capital per trade
Always place a stop-loss
Size positions based on volatility
Avoid overtrading
Never increase lot size after a loss
The greatest secret:
Protecting capital is more important than making profits.
A trader who avoids major losses can survive long enough to catch big winning swings.
7. The Secret of Support & Resistance Mastery
Swing traders obsess over support and resistance levels.
These levels act as price magnets and turning zones.
Key levels include:
Previous swing highs/lows
Daily, weekly, and monthly levels
Psychological numbers (100, 500, 1000)
Fibonacci retracement levels
Supply and demand zones
Swing traders wait for price reactions at these levels and only trade when confirmation appears.
8. The Secret of Using Indicators the Right Way
Professional swing traders use indicators as confirmation, not decision-making tools.
Popular indicator combinations:
A. Trend + Momentum
50-EMA or 200-EMA + RSI
20-EMA + MACD
B. Pullback Identification
Bollinger Bands
Stochastic RSI
C. Breakout Confirmation
Volume + MACD
RSI breakout
The secret:
Use indicators sparingly—2 or 3 maximum.
Clear charts produce clearer decisions.
9. The Secret of Trading Psychology
Swing trading rewards emotional control.
Professionals master:
A. Discipline
Follow the plan strictly.
B. Patience
Wait for the best setups.
C. Emotional Detachment
React to charts, not feelings.
D. Consistency
A few high-quality trades outperform dozens of random trades.
The less emotionally involved a trader is, the better they perform.
10. The Secret of Journaling Every Trade
This is one of the most underrated secrets.
A trade journal includes:
Entry and exit
Stop loss
Chart screenshots
Reason for trade
Mistakes
Market context
Journaling forces self-reflection and dramatically improves discipline and performance.
11. The Secret of Avoiding News-Based Noise
Swing traders avoid making decisions during:
Major economic announcements
Earnings reports
Policy changes
High volatility events
News can create unpredictable spikes that damage swing positions.
Professionals stay defensive during such periods.
12. The Secret of Letting Winners Run
One of the greatest swing trading secrets is knowing when not to exit early.
Successful traders:
Trail their stop-loss
Add positions in trend continuation
Hold until target zones are met
Small losses and big wins create long-term profitability.
Conclusion
Swing trading appears simple but demands mastery of multiple elements—trend recognition, timing, patience, volume interpretation, chart patterns, risk management, and psychology. The real secrets lie not in magical indicators but in disciplined execution and consistent behavior. When traders combine technical analysis with emotional control, they unlock the ability to capture market swings with confidence and accuracy.
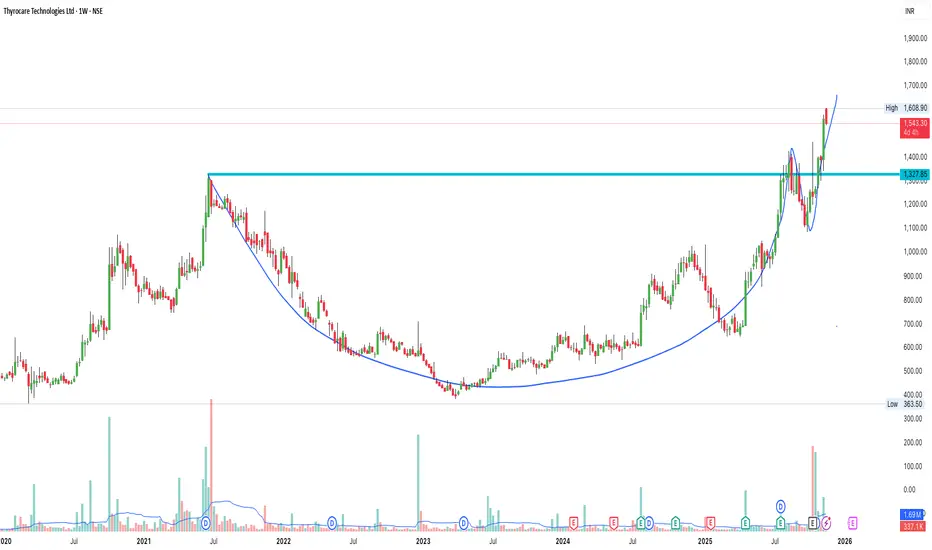
Thyrocare Technologies – Weekly Chart Breakout AnalysisCup & Handle pattern breakout visible on higher timeframe (1W).
Price has retested the breakout zone around ₹1325 and given a strong bounce with volume.
Key Points:
🔹 Multi-year Cup & Handle formation
🔹 Breakout + successful retest
🔹 Strong momentum candles after retest
🔹 Next potential zone: ₹1650 – ₹1750 (if momentum continues)
Support : ₹1325
Short-term trend : Bullish
Structure : Higher highs – Higher lows
Not a recommendation. Just sharing my chart study.
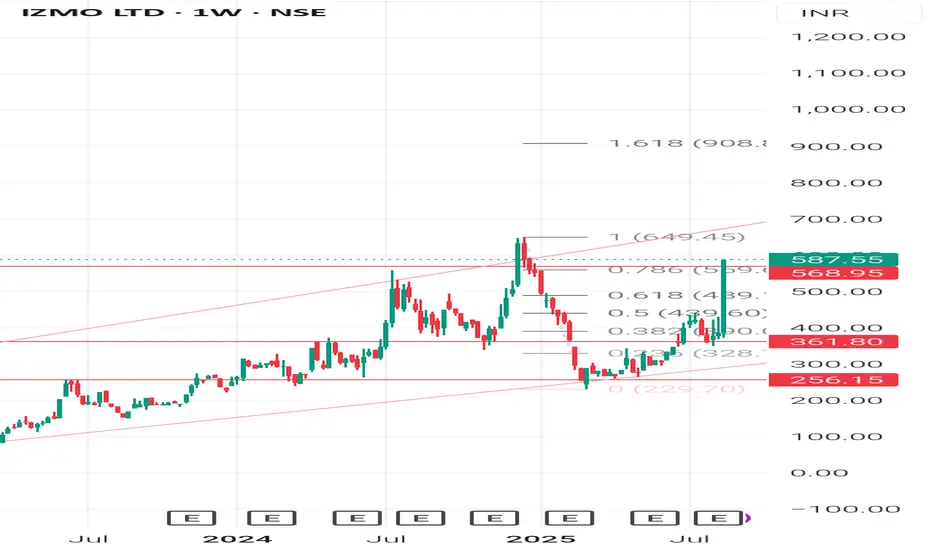
Stock Analysis: IZMO Ltd. based on the chart and fundamentalsStock Analysis: IZMO Ltd. based on the chart and fundamentals:
Technical & Chart Pattern Analysis (Weekly Chart)
Current Price: 587.55 (+19.99% last move - strong momentum).
Fibonacci Levels (retracement from high):
0.382 - 390 (past support, now strong base).
0.5 - 439 (intermediate support).
0.618 - 499 (recent breakout level).
0.786 - 559 (crossed successfully).
1.0 - 649 (major resistance).
1.618 - 908 (next extended target).
Support Levels: 499 - 439 - 390.
Resistance Levels: 649 - 750 - 908.
Candlestick Pattern: Recent weekly candle is a strong bullish marubozu (no wick, full green), indicating aggressive buying and potential continuation of trend.
Swing Analysis: Stock bounced strongly from 256 (swing low) and has reclaimed key retracement levels, showing a trend reversal with momentum.
Chart Pattern:
Broke out of falling consolidation with volume.
Trading inside a long-term upward channel.
Target zones: 649 (supply zone) - If broken, 900 becomes visible.
Fundamental Snapshot - IZMO vs Competitors
Ratio / Metric IZMO Ltd. KPIT Tech Tata Elxsi
P/E (TTM) -23x -45x -65x
ROE -17% -20% -28%
Debt-to-Equity Low (<0.2) Low Low
Revenue Growth (YoY) Strong double-digit Moderate Stable
Market Cap -Small-cap Mid-cap Mid-cap/Large-cap
Learning: IZMO trades at a lower P/E compared to KPIT/Tata Elxsi, indicating undervaluation relative to peers if growth sustains. However, liquidity and volatility risk is higher since IZMO is a small-cap.
🎓 Student Learnings from This Chart
1. Fibonacci Retracement works well in identifying support/resistance during upswings.
2. Volume + bullish marubozu candles = trend confirmation.
3. Small-cap IT/auto-tech companies can give sharp rallies but also sharp corrections - risk management is critical.
4. Always compare fundamentals with peers - Lower P/E can mean undervaluation OR slower growth.
5. Invest gradually (SIP style) instead of chasing a rally after 20%+ up moves.
👉Disclaimer
This analysis is for educational purposes only. It is not investment advice. Stock markets are subject to risks. Please consult your financial advisor before investing.
#StockMarketIndia #TechnicalAnalysis #FundamentalAnalysis #SwingTrading #ChartPatterns #CandlestickPatterns #StudentInvestors #LongTermWealth #SmallCapStocks #InvestingBasics
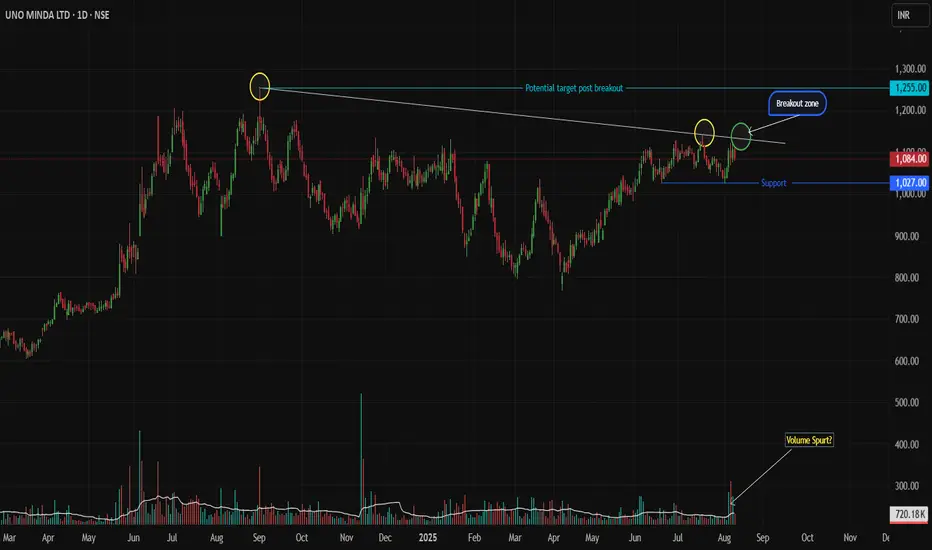
Uno Minda: Triple Trendline Test - Breakout or Pullback Setup Uno Minda Price Action Setup
(Daily Timeframe | Pure Price Action + Volume)
Key Structure
Resistance Trendline: Tested twice (02-Sep-2024 & 17-Jul-2025). Price now approaches it for the 3rd attempt.
Support Zone: Strong base at 1027 (recent swing low).
Long-Term Trend: Bullish (higher highs/lows).
Trade Scenarios
SCENARIO 1 : Trendline Breakout
Trigger:
Daily breakout candle closes above the resistance trendline.
Candle must be strong bullish (full-bodied green) with volume > 20-day average.
Entry: On confirmation of breakout (next candle open/close above breakout candle’s high).
Stop Loss: Low of the breakout candle.
Targets:
First: 1255 (take partial profits).
Trail balance with trailing SL (e.g., below recent swing lows).
SCENARIO 2 : Pullback to Support
Trigger:
Price retests 1027 support, followed by a strong bullish reversal candle (e.g., Bullish Engulfing/Hammer) with rising volume.
Entry: After reversal candle closes (confirmation).
Stop Loss: Below the low of the reversal candle.
Targets:
First: 1130 (take partial profits).
Trail balance aggressively.
Risk Management
Position Size: Risk ≤ 1% capital per trade.
Avoid chasing: Enter only on confirmed triggers.
Invalidation: Exit if price closes below SL levels.
Disclaimer
This idea is educational only. Not financial advice. Trading carries high risk. Past performance doesn’t guarantee future results. Always test strategies in a demo account. Consult a financial advisor before trading.
Boost 👍 if helpful! Comment below for other stocks you want analyzed.
Keep it price-driven. Trade safe! 💡
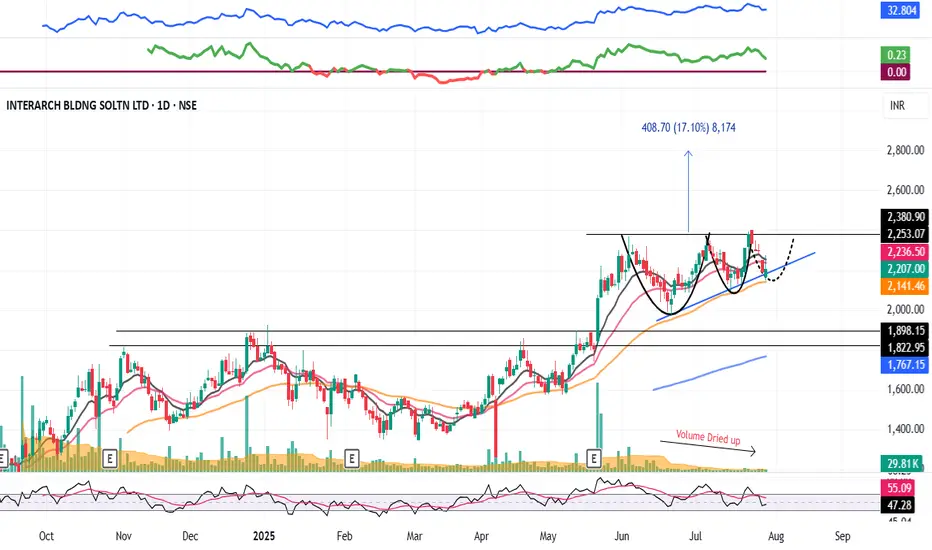
INTERARCH : Swing Pick (1-3 Months)#INTERARCH #vcppattern #chartpattern #ascendingtrianglepattern #breakoutstock #patterntrading #Swingtrading
INTERARCH : This will test Patience
>> VCP formation in process
>> Ascending Triangle forming
>> Breakout candidate
>> Good Strength & Volumes Dried up
>> Trending Stock in consolidation
Swing Traders can lock profits at 10% & Keep Trailing
Pls Comment , Boost and Follow for more such Analysis
Disc : Charts shared are for Learning Purpose and not a Trade recommendation, Consult your Financial advisor or a SEBI Registered Advisor before taking position in it.
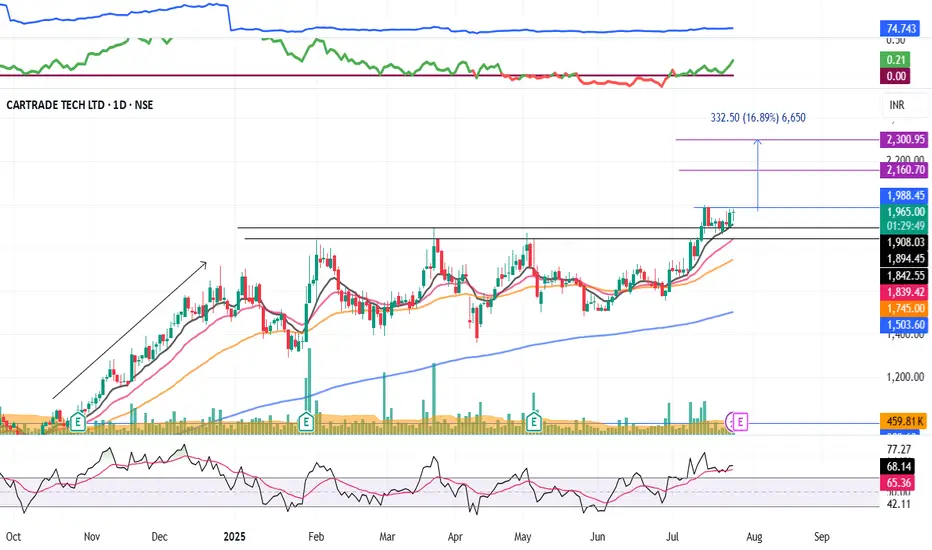
CARTRADE : Momentum pick#CARTRADE #swingtrade #momentumstock #breakoutstock #basingpattern
CARTRADE : Swing Trade
>> Good Base formation
>> Breakout + Retest done
>> Good Strength & Volume dried up
>> Trending setup
Swing Traders can lock profit at 10% and keep trailing
Pls boost, comment and follow us for more such analysis
Disc : Charts shared are for Learning purpose and not a Trade recommendation. consult a SEBI Registered Advisor before taking position in it.
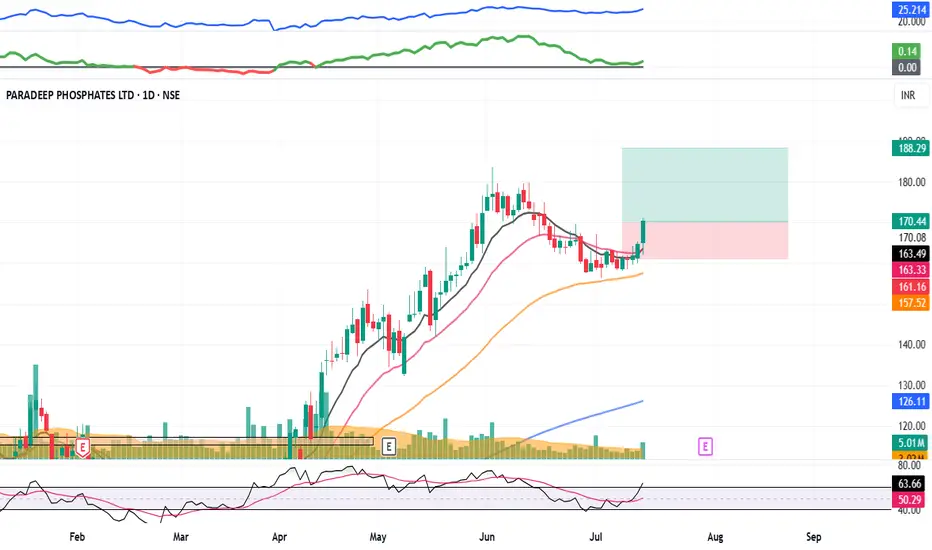
PARADEEP : Momentum Pick#PARADEEP #swingtrade #trendingstock #momentumtrade
PARADEEP : Swing Trade
>> Low PE Stock
>> Good Retracement and consoldation
>> Stock Ready for next leg of Rally
>> Good Strength & Volume
>> Risk Reward Favourable
Swing Traders can lock profit at 10% and keep Trailing
Please Boost, comment and follow us for more Learnings
Disc : Charts shared are for learning purpose only, not a Trade recommendation. Do your own research and consult your financial advisor before taking any position.
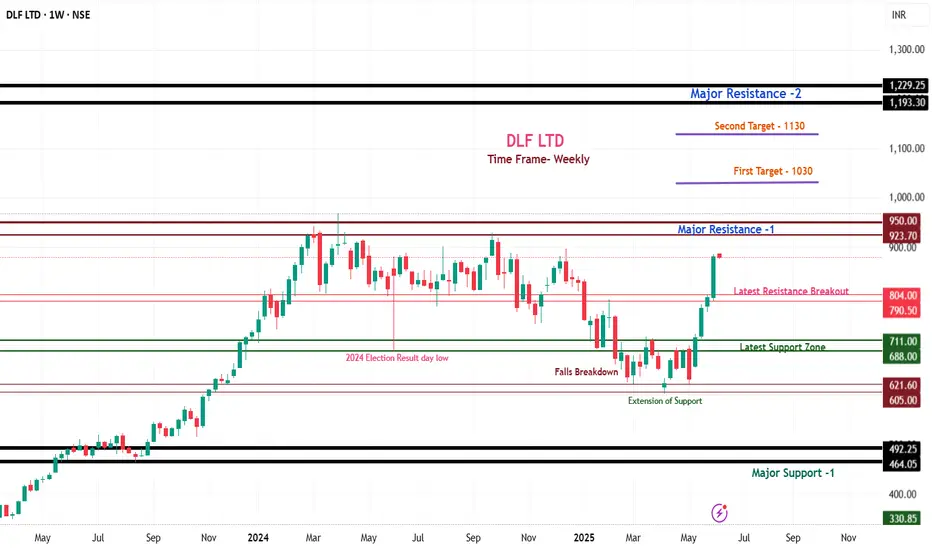
DLF Limited Technical Analysis & Trading Strategy DLF Limited – Weekly Chart Analysis (Technical View)
Company Background:
Founded in 1946, DLF Limited is India’s largest real estate developer, renowned for its premium residential and commercial projects.
With iconic developments and vast land holdings across Delhi-NCR, Mumbai, and Bengaluru, DLF is a dominant player in high-end real estate.
Core Business Segments
Commercial Properties: IT Parks, retail malls (e.g., DLF CyberHub, DLF Emporio), Grade-A offices.
Residential: Luxurious apartments, gated communities in prime locations.
Land Bank: Extensive holdings in urban growth centers.
Leasing & Rentals: Strong recurring income from office and retail leasing.
This analysis is based on the weekly time frame, offering a medium- to long-term outlook for positional and swing traders.
Chart Structure Overview:
1. DLF is currently trading around ₹878 and has shown a strong recovery after retesting its breakout zone of ₹804–₹790. The structure indicates bullish momentum.
2. But a major resistance zone lies between ₹923 and ₹950. Price action near this zone will be crucial in determining the next directional move.
Bullish Scenario – If ₹950 Breaks with Volume:
The zone of ₹923 to ₹950 is a major hurdle, acting as a resistance ceiling.
A weekly close & sustain above ₹950 will confirm a strong breakout.
After that:
First Target: ₹1,030
Second Target: ₹1,130 to ₹1,180
🔽 Bearish Scenario – If Price Fails Near ₹950
The immediate support zone lies at ₹804–₹790, which earlier acted as resistance.
If the price fails to hold this level:
Next support seen at ₹711 to ₹688
A breakdown below ₹688 could lead to a deeper fall towards ₹605 to ₹621
If ₹605 breaks decisively, further downside could extend toward ₹492–₹464, which is a **major long-term support on the chart
Conclusion:
1. This is a weekly chart-based analysis, ideal for swing or positional trades. The ₹950 level is the key breakout zone for the next bull leg.
2. As long as the price remains above ₹804, the structure remains positive.
Below ₹688, trend may weaken significantly.
💬 Found this chart breakdown helpful?
👍 Like | 💭 Comment | ➕ Follow for more weekly chart analysis and breakout setups!
Published on TradingView – DLF Limited | Weekly Analysis
ACME SOLAR HOLDINGS LTDACME Solar Holdings Ltd. is currently showing strong bullish momentum, supported by key technical indicators that suggest a positive trend.
Trading volume has been notable at approximately 774,891 shares, indicating increased investor interest. This recent performance, along with the commissioning of their 26.4 MW wind power project in Gujarat, appears to have positively influenced market sentiment.
Investors may want to closely monitor the stock's behavior around the immediate resistance level of 258. If the stock can maintain levels above this point, it could potentially move upwards towards 295.

Tata Teleservices (Maharashtra) Big breakout alert!Big Breakout Alert!
Price has convincingly broken out of a long-term descending trendline with high volume interest visible on the volume profile — signaling a potential change in trend.
🔹 CMP: ₹65.88 (▲ +13.14%)
🔹 Resistance levels: ₹79.00 → ₹104.00
🔹 Support zone: ₹54.10 (Volume Node & Horizontal Structure)
🔍 Technical Insights:
Volume Profile Analysis
🔸 High volume node between ₹54–₹66 suggests strong accumulation.
🔸 Sharp price rejection below ₹54 confirms it as a demand zone.
Descending Trendline Break
🔸 Price finally broke out after multiple rejections since August 2023.
🔸 Breakout has occurred with aggressive bullish momentum.
Roadmap Projection (Blue Path)
1. Possible retest near ₹62–₹64
2. Push toward ₹79 zone
3. Consolidation before breakout toward ₹92–₹104 (previous POC & supply zone)
🧠 Takeaway:
This breakout, backed by volume and structure, hints at a trend reversal. If price holds above ₹62–₹64 on a retest, the stock could enter a new bullish phase targeting ₹100+.
“The longer the base, the stronger the breakout.”
#TataTeleservices #TTML #BreakoutStock #VolumeProfile #TrendlineBreak #SwingTrading #ChartAnalysis #StockMarketIndia #PriceAction #TechnicalAnalysis

NIFTYAfter a meaningful descending triangle, an open expanding triangle has been detected. For Nifty to continue moving up, at least one support is required on this triangle, and this dip will be called as The TRUMP Effect. in.tradingview.com

3M India (3MINDIA) - Double Top Confirmed3M India (3MINDIA) weekly chart analysis reveals a confirmed double top pattern and a breakdown below the trendline and 200-week EMA. This suggests a potential move down to the key support zone around 16,000-18,000. I've highlighted the key levels to watch. A short trade opportunity may arise on a pullback. Let me know your thoughts in the comments!
Also long term investors, could deploy their capital in trenches till the support zone or wait for the reversal to invest at once.
Disclaimer: This analysis is for informational and educational purposes only. It is not financial advice. Trading involves risk, and you could lose money. Past performance is not indicative of future results. Always do your own research and consult with a qualified financial advisor before making any investment decisions.

Axis Bank : Swing Trade Pick#axisbank #swingtrade #momentumtrade #trendingstock
Axis Bank : Swing Trade
>> Low PE Stock
>> Banking Sector Theme, most likely to perform
>> Trending stock
>> Low Risk Trade
Swing Traders can lock profit at 10% and keep Trailing
Please Boost, comment and follow us for more Learnings.
Note : Markets are still Tricky and can go either ways so don't be over aggressive while choosing & planning your Trades, Calculate your Position sizing as per the Risk Reward you se and most importantly don't go all in
Disc : Charts shared are for learning purpose only, not a Trade recommendation. Do your own research and consult your financial advisor before taking any position.

HIMADRI SPECIALITY CHEM LTD TRADING IDEA!📊 Analysis:
HSCL is trading above its key EMAs (20, 50, and 200), indicating a strong bullish trend.
The stock has broken a critical resistance level at ₹590, supported by rising volumes, signaling potential for further upside.
The price structure reflects bullish continuation with solid support below ₹565.
📈 Trading Plan:
Entry Point: ₹595 (enter on a breakout confirmation with good volume).
Target 1 (T1): ₹620
Target 2 (T2): ₹650
Stop Loss (SL): ₹565
🛑 Risk-to-Reward Ratio: Approximately 1:2

MANKIND PHARMA : Trending Stock#MANKIND #swingtrading #breakout #trendingsetup #momentumtrade
MANKIND : Swing Trade
>> Trending setup
>> Breakout & Retest done
>> Momentum Trade setup
>> Good Strength & Volume Dry Setup
>> Low Risk High Reward Trade
Swing Traders can lock profit at 10% and keep trailing
Pls Boost, follow & Comment for more Learnings
Disc : Charts shared are for Learning purpose, not a trade recommendation.
Consult your financial advisor and do your own research before buying

Lupin Stock Analysis: Strong Fundamentals & Bullish setup.FUNDAMENTALS & TECHNICAL ANALYSIS
⬇️⬇️
Fundamental Analysis:
1. Earnings per Share (EPS):
• Q3 2024 EPS estimate is 17.29 INR, and the reported values for the prior quarters (Q4 ’23, Q1 ’24, Q2 ’24) have consistently beaten estimates with surprises ranging from 11.08% to 41.55%.
• This indicates strong financial performance and the company’s ability to exceed market expectations.
2. Revenue:
• Reported revenue for Q1 ’24 and Q2 ’24 surpassed estimates with 5.37% and 2.38% surprises, respectively.
• The company is expected to generate 56.45B INR in revenue for Q3 ’24. This suggests consistent growth, which is a positive indicator for long-term investors.
3. Conclusion from Fundamentals:
• Strong EPS growth and consistent revenue beats show that the company is performing well financially.
• With upcoming reports due in February 2025, further positive earnings surprises could lead to upward momentum.
Technical Analysis
1. Current Price Action:
• The stock is trading near 2,140 INR, approaching key fair value gaps (FVG) at 2,150 INR (1D FVG) and 2,273.45 INR (higher target zone).
2. Support & Resistance:
• Major support zone is near 1,985.90 INR (Daily Low).
• Resistance zones lie at 2,218.30 INR, 2,273.45 INR, and the Daily High of 2,313.20 INR.
3. Market Structure:
• There is a change of character (Choch) on the chart, suggesting potential bullishness if it sustains above 2,150 INR.
• The stock may consolidate slightly before moving towards the higher resistance zones.
4. Short-term Prediction:
• Likely to test 2,273.45 INR in the near term if the bullish structure holds.
• A break below 1,985.90 INR would invalidate the bullish setup.
Conclusion:
• Investment Decision:
• Buy: Based on strong fundamentals (earnings and revenue growth) and a bullish technical structure, the stock looks promising for swing trading or medium-term investing.
• Entry Point: Around 2,140-2,150 INR, aligning with the technical FVG and support zones.
• Target: 2,273.45 INR (short-term) and 2,313.20 INR (medium-term).
• Stop Loss: Below 1,985.90 INR to manage risk in case the bullish structure fails.
DISCLAIMER ▶️ THIS IS FOR EDUCATIONAL PURPOSES ONLY. PLEASE DO YOUR OWN RESEARCH BEFORE INVESTING

Jyoti CNC Automation: Strong Growth, Expensive Valuation AheadJyoti CNC Automation has seen significant growth, reflected in its market cap of ₹32,690 Cr. and a current price of ₹1,436, near its 52-week high of ₹1,463. The stock’s remarkable rise from a low of ₹368 highlights strong investor interest. Key profitability metrics such as ROCE at 21.2% and ROE at 20.8% indicate efficient capital utilization and strong returns for shareholders.
However, the stock’s P/E ratio of 119 is notably high, suggesting an expensive valuation relative to earnings. Additionally, with a book value of ₹65.7, the stock trades at a significant premium, raising concerns about overvaluation. The absence of a dividend yield (0.00%) indicates the company is reinvesting profits for growth, making it appealing for growth-focused investors.
Overall, while Jyoti CNC Automation demonstrates strong fundamentals and growth potential, the premium valuation demands caution, especially for risk-averse investors.
Now talking about the Technical analysis of chart, we can observe that
- Stock is trading above its 20 EMA and 50 EMA
- Stock price has taken the liquidity above the previous weekly high price
- We have 2 FVG that could act as a potential buy are for smart money
- For buy our setup would be sweet as cake, we wait for any Fvg to be filled and a good bullish candle indicating strong participation.
- We mostly trade on Engulfing candles, Morning stars & Pinbars
Note this is for educational purpose only. Please do your own research before investing.

TATA POWER SWING TRADE | DAILY CHARTTATA POWER SWING TRADE
Hi trade this is chennel breakout and retest at level 420-415 in green candle
i will take entry with green candle low SL.
target 485,520
Note - Only for education purpose..
GIVE LIKE SHARE AND FOLLOW

Crisil: The Credit Rating Agency is Set for Significant Growth!
The price is currently on an upward trajectory, characterized by a series of higher highs and higher lows.
After hitting resistance around the 3,740 level, the stock price pulled back but found strong support near the 2,700 level.
It then bounced back and surpassed its previous resistance.
This breakout was significant, as it emerged from the Rounding Bottom pattern that had formed during the consolidation phase.
Following the breakout, the stock price stabilized just above the breakout zone for a while.
Then, with a dramatic surge, the stock reached an all-time high of ₹6200.
However, a wave of selling pressure caused the price to drop back to its trendline support.
At present, the stock price is steadily climbing, indicating promising growth potential.

Swing1.Current Price: The stock is trading at ₹307.35, up ₹9.45 (3.17%) for the day.
Trendline Breakout:
A downward sloping trendline (orange line) connecting recent lower highs was broken on the upside. This indicates a potential trend reversal to the upside.
Resistance and Support:
Resistance: The stock has crossed the immediate resistance level of ₹302 (blue line). Sustaining above this level could signal further bullishness.
Support: A key support zone is visible at ₹266.65 (orange horizontal line), which acted as a strong floor during pullbacks.
2. Volume Analysis
The volume at the bottom of the chart indicates significant participation during the breakout. Increased volume during an upward move confirms the strength of the breakout.
3. Candlestick Pattern
Recent bullish candles with higher closes and increased volumes signal strong buying interest.
There is no major bearish candlestick that would currently negate the breakout.
4. Possible Scenarios
Bullish Case:
If the stock sustains above ₹302, it can aim for higher targets, with next resistances possibly in the ₹320-330 range based on past price levels.
Positive sentiment in the defense sector, along with Bharat Electronics' leadership in electronic and defense equipment manufacturing, supports the bullish case.
Bearish Case:
If the stock fails to sustain above ₹302, it could revisit support levels near ₹266, which is a critical level for bulls to defend.
5. Conclusion
This chart suggests that BEL has entered a bullish phase after breaking out of its consolidation and downtrend. The breakout above ₹302, supported by strong volumes, indicates a higher probability of an upward trend continuation. Short-term traders can watch for further confirmation of the breakout, while long-term investors might consider accumulating on dips given the company’s strong fundamentals in the defense sector.

AFCONS INFRA - NEWLY LISTED STOCK TO BUY FOR SWINGCan Enter at 510
Target - 580, 660
Disclaimer - All information on this page is for educational purposes only,
we are not SEBI Registered, Please consult a SEBI registered financial advisor for your financial matters before investing And taking any decision. We are not responsible for any profit/loss you made.
Request your support and engagement by liking and commenting & follow to provide encouragement
HAPPY TRADING 👍
