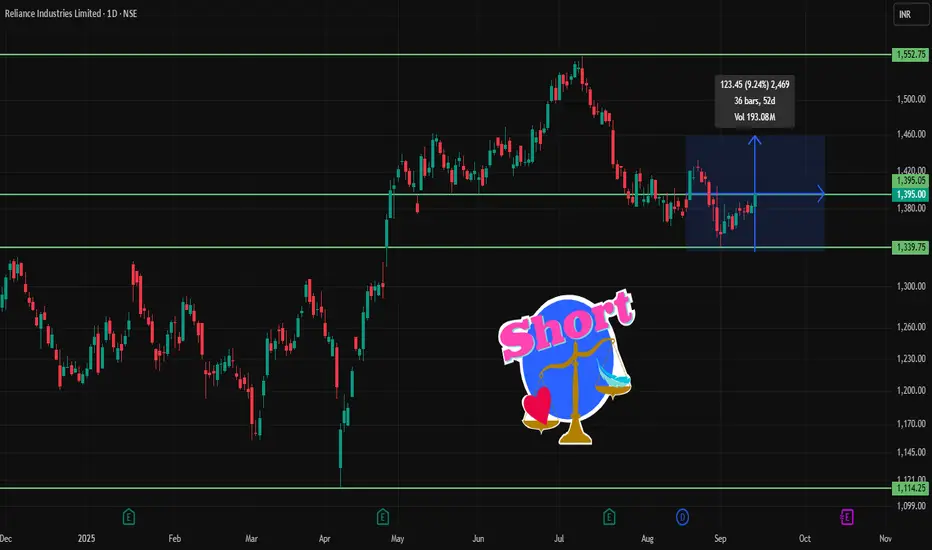
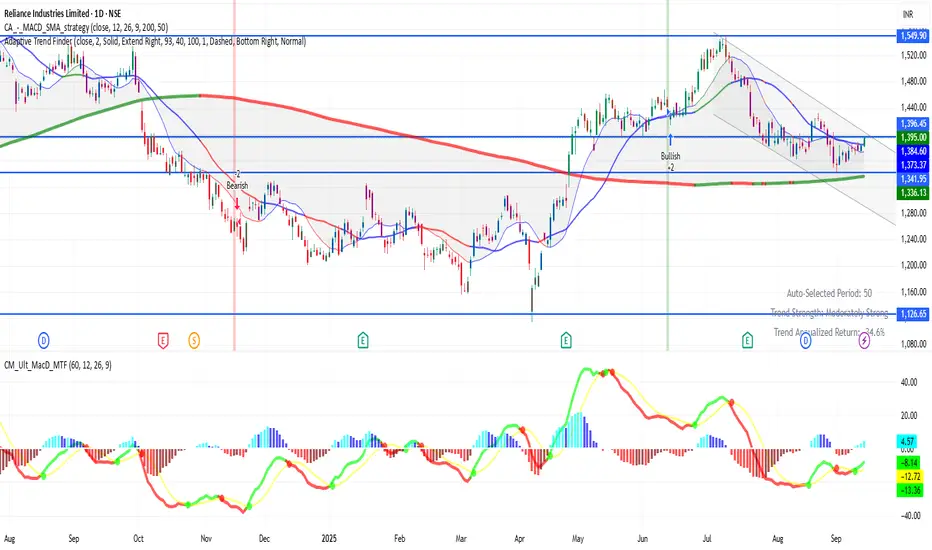
RELIANCE 1D Time frameCurrent Price & Trend
Trading around ₹1,395
Price is below many of its short- to medium-term moving averages (50-day, 100-day), suggesting resistance in that zone.
Indicators & Momentum
Relative Strength Index (RSI) is in mid-range → neither overbought nor oversold, leaning neutral.
MACD is weak to mildly bearish in daily view.
Volume has shown mixed behaviour; resistance zones are not being convincingly broken.
Trend strength indicators show some weakening or caution among buyers.
Tatamotors
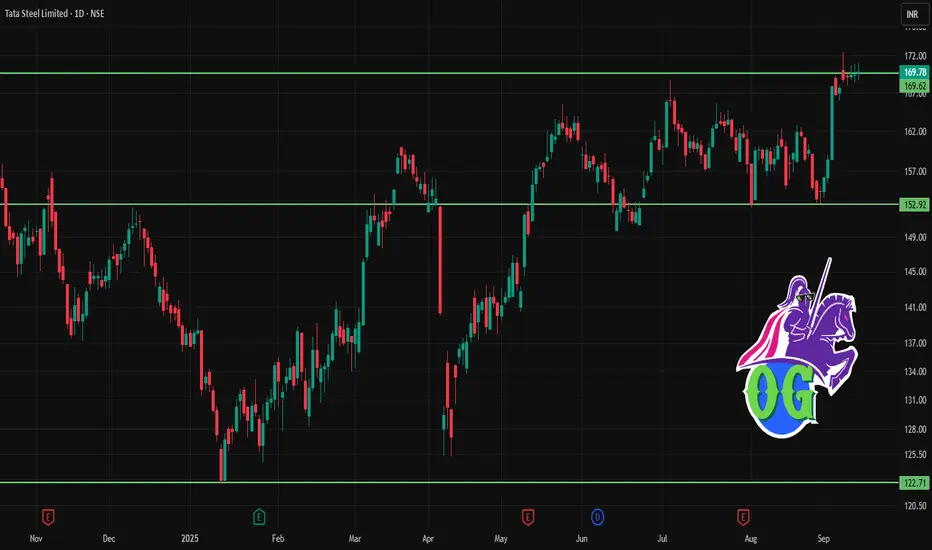
TATASTEEL 1D Time frameCurrent Price & Trend
Current Level: ₹169
Trend: Neutral to slightly bullish → stock is consolidating near support.
Momentum: Price is holding above strong support, but resistance is close.
RSI: Around 55 → neutral, leaning positive.
MACD: Flat to mildly bullish.
Moving Averages: Price is hovering around 20-day average; still above 50-day average → medium-term strength intact.
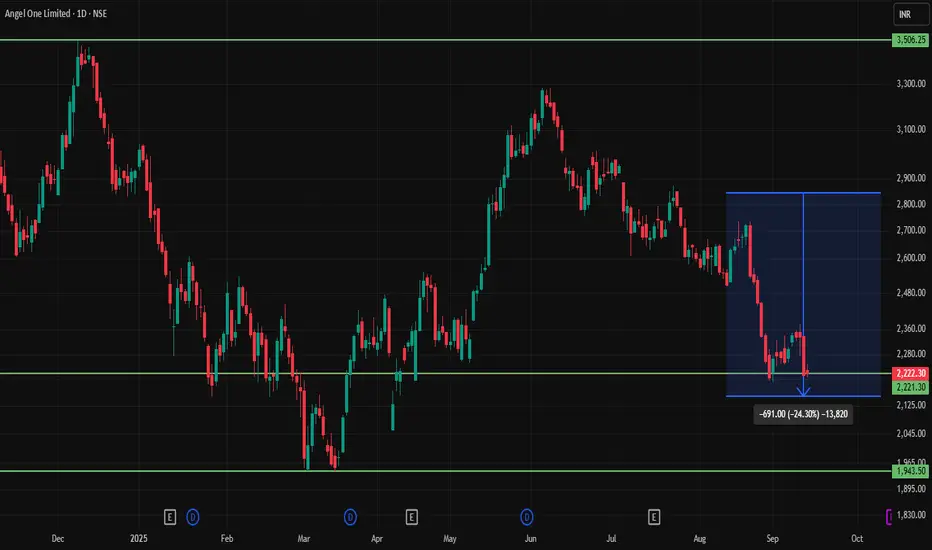
ANGELONE 1D Time frameCurrent Price & Trend
Current Level: ₹2,222
Trend: Neutral to weak → stock is under pressure, trading below many key moving averages.
Momentum: Lacks strong buying interest; near lower-mid range of recent price action.
Indicators
RSI: Around 40–45 → closer to oversold but still in neutral zone.
MACD: Bearish crossover → signals continued weakness.
Moving Averages: Price is below 20- & 50-day averages → selling pressure still present.
✅ Bullish Scenario
If price sustains above 2,250, it can move toward 2,350 – 2,400.
Breakout above 2,400 would indicate a stronger reversal.
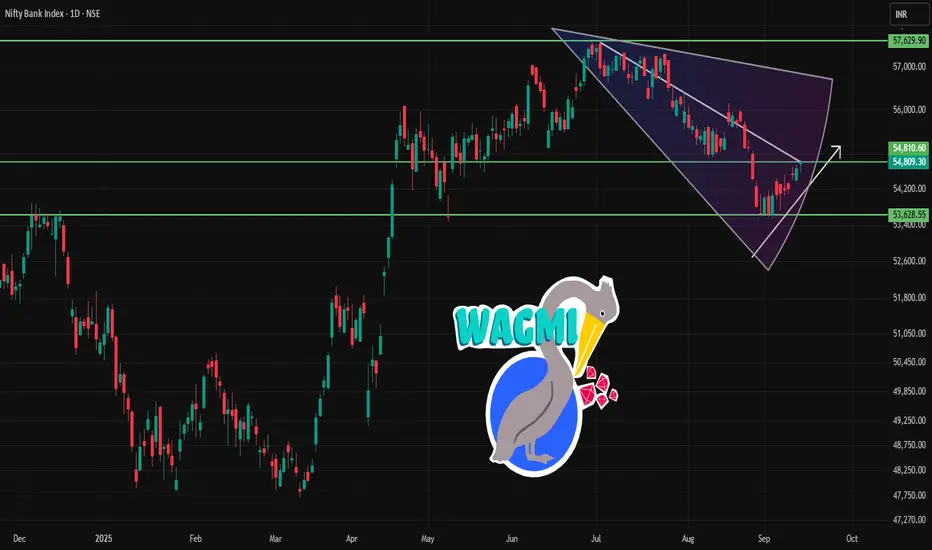
BANKNIFTY 1D Time frameCurrent Price & Trend
Current Level: 54,809
Trend: Neutral to mildly bullish
Range Context: Close to resistance zone, so movement here is crucial
Bullish Case
If Bank Nifty closes above 55,000–55,200, it can rally toward 55,500–55,700.
Sustained buying could push further toward 57,000 in coming sessions.
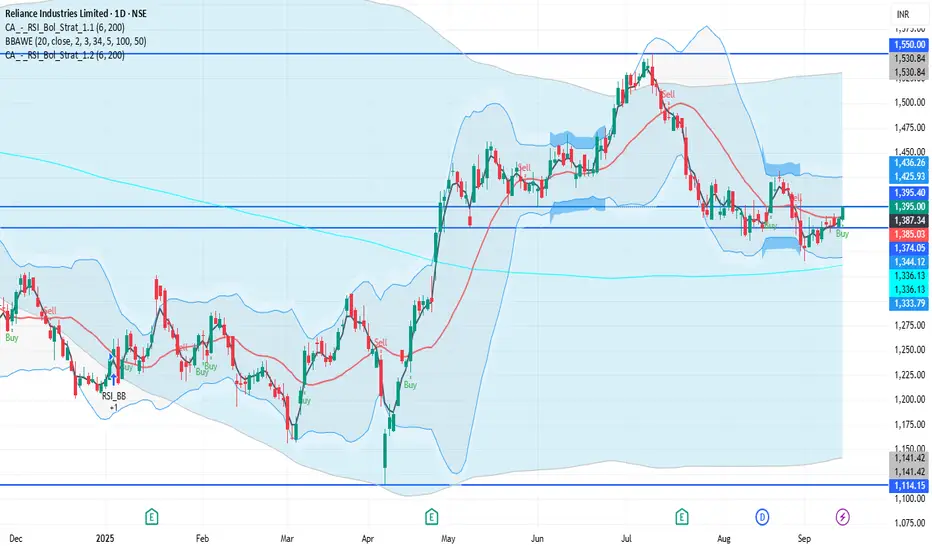
RELIANCE 1D Time frameCurrent Price & Trend
Price: ₹1,395.00
Trend: Neutral to mildly bullish; trading approximately 10.1% below its 52-week high of ₹1,551.00, achieved on July 9, 2025.
Momentum: Indicators suggest a neutral to slightly bullish outlook.
Bullish Scenario
Breakout Above ₹1,396: A sustained move above ₹1,396 could target ₹1,400 – ₹1,420 in the short term.
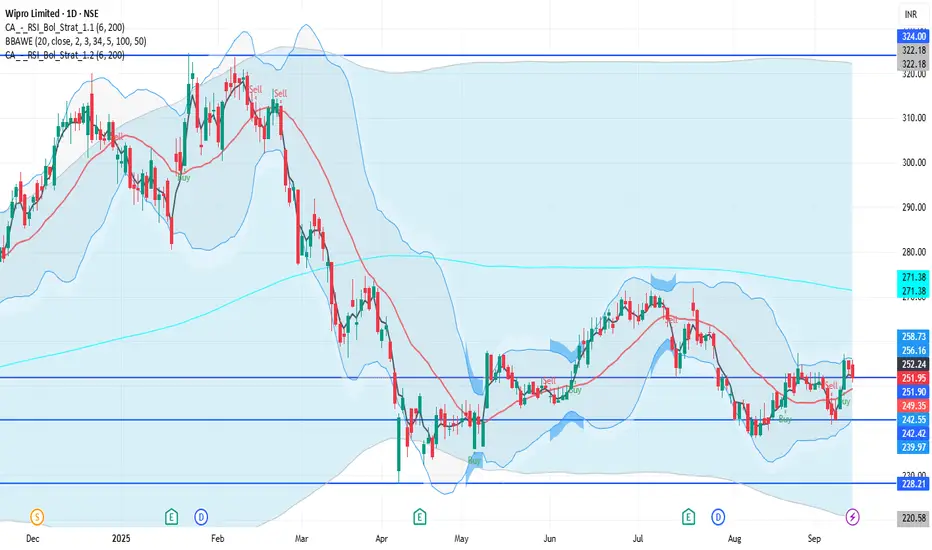
WIPRO 1D Time frameCurrent Price & Trend
Price: ₹251.95
Trend: Neutral; trading approximately 22.5% below its 52-week high of ₹324.60, reached on July 2, 2025.
Momentum: Indicators suggest a neutral to slightly bearish outlook.
Bullish Scenario
Breakout Above ₹257: A sustained move above ₹257 could target ₹265 – ₹270 in the short term.
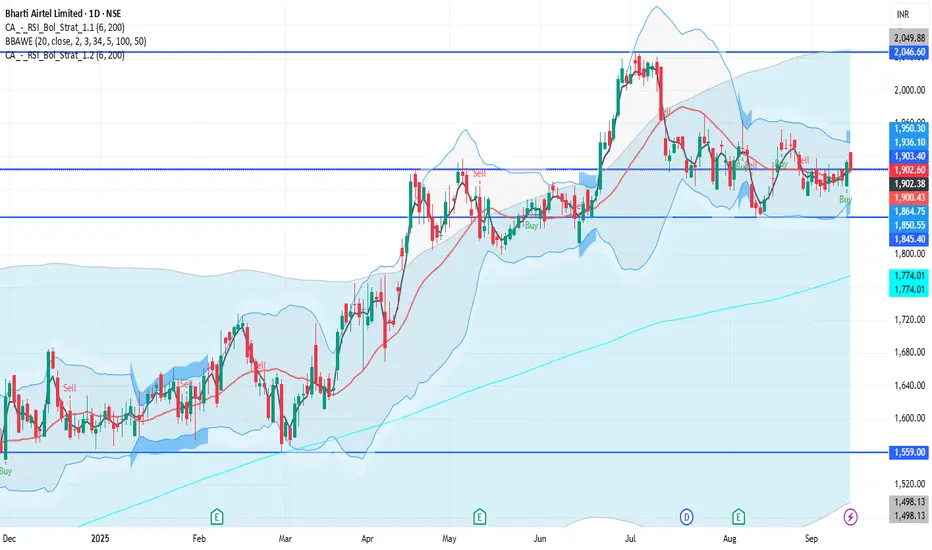
BHARTIARTL 1D Time frameCurrent Price & Trend
Price: ₹1,902.60
Trend: Neutral to mildly bullish; trading approximately 6.9% below its 52-week high of ₹2,045.50, achieved on July 2, 2025.
Momentum: Indicators suggest a neutral to slightly bullish outlook.
Bullish Scenario
Breakout Above ₹1,930: A sustained move above ₹1,930 could target ₹1,950 – ₹1,960 in the short term.
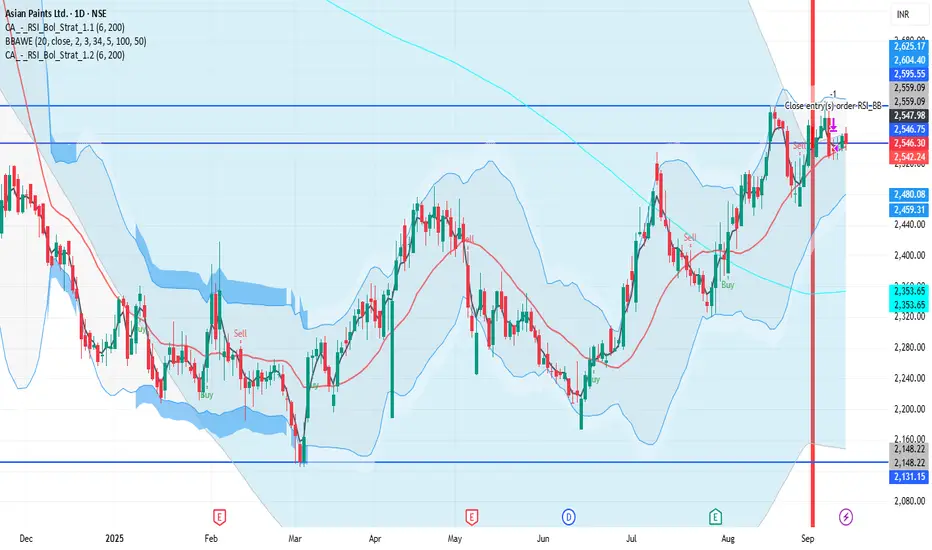
ASIANPAINT 1D Time frameCurrent Price & Trend
Price: ₹2,546.30
Trend: Consolidating near recent highs; trading approximately 25% below its 52-week high of ₹3,394.90.
Momentum: Indicators suggest a neutral to slightly bearish outlook.
Bullish Scenario
Breakout Above ₹2,580: A sustained move above ₹2,580 could target ₹2,600 – ₹2,620 in the short term.
⚠ Bearish Scenario
RELIANCE 1D Time frameCurrent Status
Price is around ₹715
The stock has been showing strength recently, with many of its moving averages (short- to long-term) supporting the rise.
Technical indicators like RSI, MACD, ADX etc. lean positive — buyers seem to have the upper hand.
There’s an inverted Head & Shoulders pattern forming, which is a bullish reversal signal if confirmed. Support zones are holding up so far.
Bullish Scenario
If Tata Motors stays above ₹700–705 support and breaks past ~₹720–725 with volume:
Possible upside to ~₹730-₹740
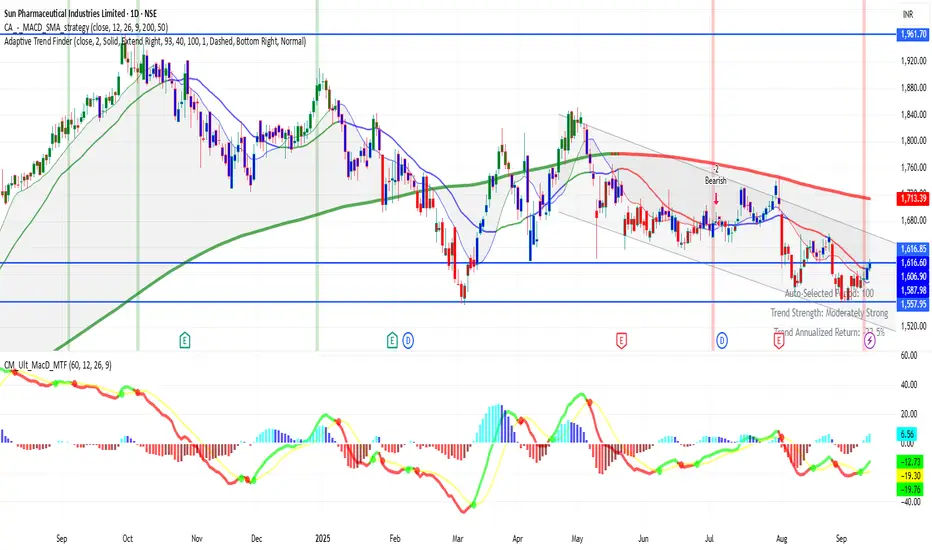
SUNPHARMA 1D Time frameCurrent Snapshot
Stock is around ₹1,616
52-week range: ~ ₹1,553 (low) up to ~ ₹1,960 (high)
Price is significantly below its 52-week peak, indicating past weakness or profit-taking from highs.
Bullish Scenario
If price can hold above the support (~₹1,590–₹1,600) and pushes above the immediate resistance (~₹1,620–₹1,630):
Could see a move toward ₹1,660–₹1,670.
If resistance is crossed with strength, next targets would be ~₹1,740-₹1,750 or more, depending on momentum.
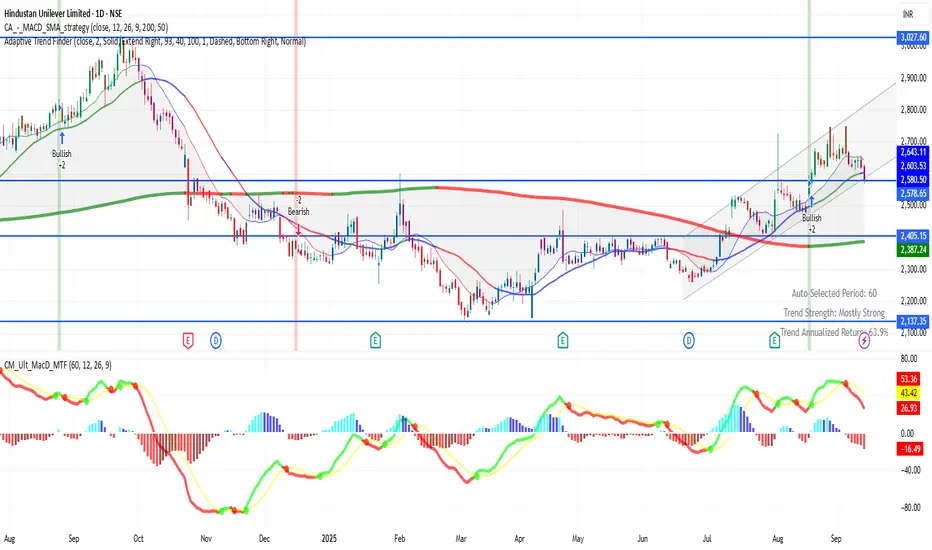
HINDUNILVR 1D Time frame General Status
Current Price: ~ ₹2,580
52-Week Range: Roughly from ₹2,136 (low) up to ~ ₹3,022 (high)
The stock has come down from its highs and is trading well below those peaks.
Bullish Scenario
If things turn favorable:
Holding above ₹2,550-₹2,500 is crucial. If that support holds, a bounce is possible toward ₹2,650-₹2,700.
If the stock breaks above that resistance cleanly, then targets in the ₹2,850-₹3,000 range could come into play.
SBIN 1D Time frameCurrent Price Action (Daily Chart)
Price Range: Stock is moving between ₹815 – ₹830 right now.
Trend: Consolidation with mild bullish bias.
Key Levels
Immediate Resistance: ₹830
Next Resistance: ₹840 – ₹850
Major Resistance: Around ₹875 (previous high)
Immediate Support: ₹815 – ₹820
Strong Support: ₹800 – ₹805
Critical Support: ₹785

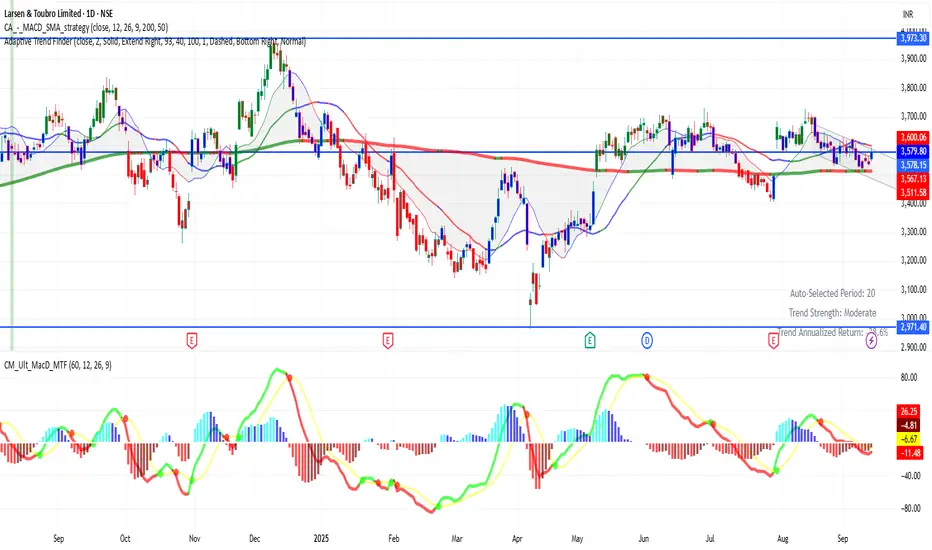
LT 1D Time frame LT — Daily (1D) Time Frame
Current Price: ₹3,579
Key Levels
Immediate Support: ₹3,540
Strong Support: ₹3,400
Immediate Resistance: ₹3,600
Major Resistance: ₹3,900
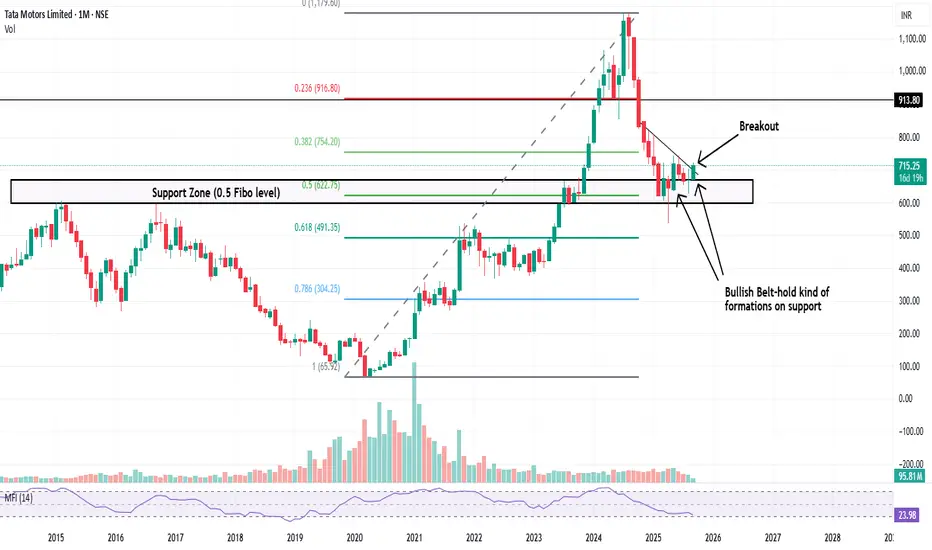
Bullish Setup in Tata Motors on 1M TFHello Everyone,
Here I have analysed the Tata Motors chart and it looks bullish for long term.
It has took Support on previous strong support.
And that zone is also 0.50 fibonacci level which is an healthly retracement considered in price action analysis.
Stock has also given breakout recently which looks good on 1W Timeframe.
So this stock looks good on 1M and 1W TF, hence this can be considered as bullish setup.
Disclaimer: This is just an a price action analysis of stock Tata Motors. Don't consider this as an stock tip or advice. Invest/Trade at your own risk.
HDFCBANK 1D Time frame📉 Current Market Snapshot
Closing Price: ₹967.80
Day's Range: ₹962.25 – ₹970.75
52-Week High: ₹1,018.85
52-Week Low: ₹806.50
Market Cap: ₹14,85,200 crore
P/E Ratio (TTM): 21.44
P/B Ratio: 3.38
Dividend Yield: 1.13%
EPS (TTM): ₹45.97
Book Value: ₹339.84
Face Value: ₹1.00
Volume: 14,363,519 shares
VWAP: ₹966.64

BAJFINANCE 1D Time frame📉 Current Market Snapshot
Current Price: ₹1,003.25
Previous Close: ₹970.25
Day's Range: ₹970.85 – ₹1,004.60
52-Week High: ₹1,004.60
52-Week Low: ₹645.10
Market Cap: ₹6,24,270 crore
P/E Ratio: 35.8
Book Value: ₹156
Dividend Yield: 0.44%
ROE: 19.2%
Debt-to-Equity Ratio: 3.74
Beta: 1.01
EPS (TTM): ₹28.00
Face Value: ₹1.00

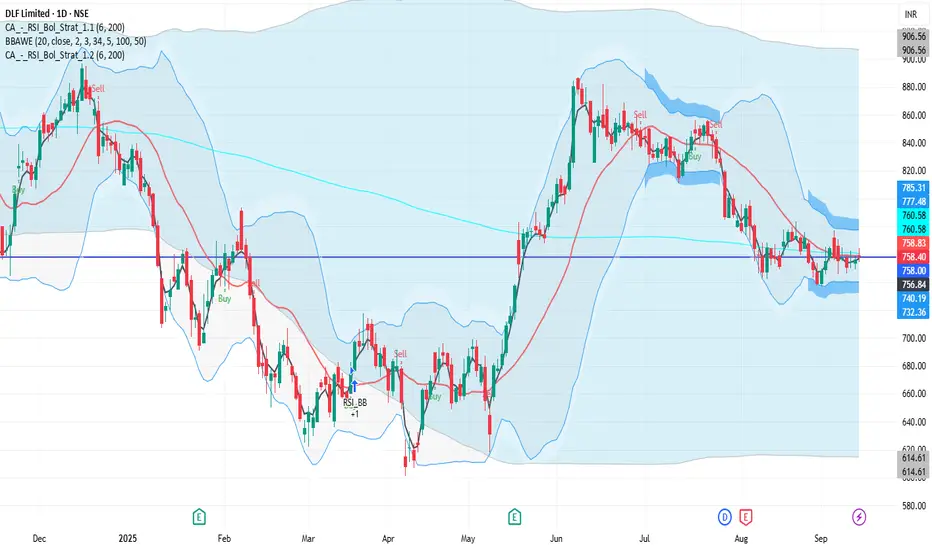
DLF 1D Time frame📉 Current Market Snapshot
Current Price: ₹758.40
Previous Close: ₹756.35
Day's Range: ₹754.20 – ₹764.40
52-Week High: ₹929.00
52-Week Low: ₹601.20
Market Cap: ₹1.87 lakh crore
P/E Ratio: 41.85
Dividend Yield: 0.79%
ROE: 10.76%
Debt-to-Equity Ratio: 0.10
Beta: 1.78
EPS (TTM): ₹18.12
Book Value: ₹172.51
Face Value: ₹2.00
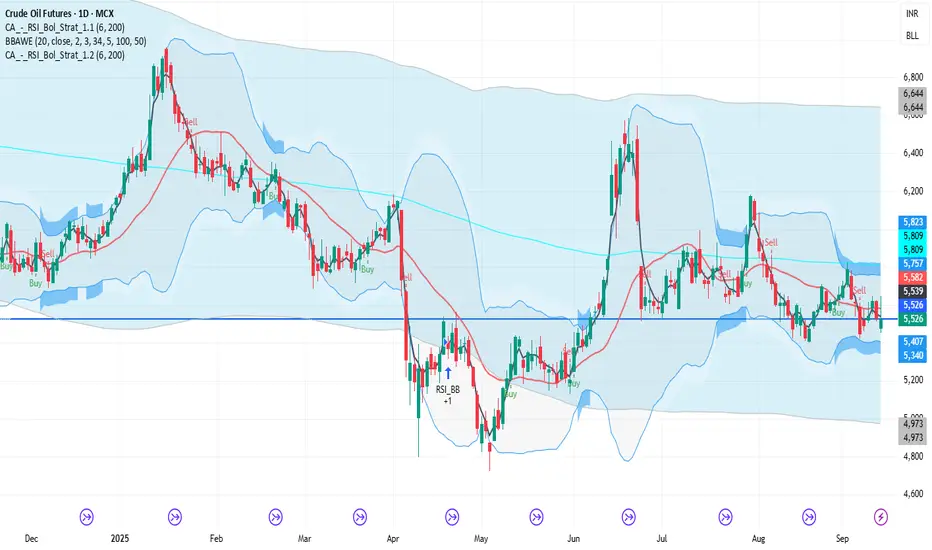
CRUDEOIL1! 1D Time frame📉 Current Market Snapshot (as of September 13, 2025)
Previous Close: ₹5,526
Day's Range: ₹5,454 – ₹5,647
Open: ₹5,480
Close: ₹5,530
📊 Key Levels
Support: ₹5,495, ₹5,442
Resistance: ₹5,663, ₹5,800, ₹5,865
NIFTY 1D Time frame📍 Current Level
25,114.00 (closing value)
Short-Term Outlook
Bullish Scenario: A sustained move above ₹25,200 could lead to a test of the 52-week high around ₹26,277.35.
Bearish Scenario: A drop below ₹25,000 may signal a potential pullback toward ₹24,800.

BPCL 1D Time frame📍 Current Price
₹318.00 (closing price)
Short-Term Outlook
Bullish Scenario: A sustained move above ₹322.65 could lead to a test of the 52-week high around ₹376.00.
Bearish Scenario: A drop below ₹312.30 may signal a potential pullback toward ₹300.00.

TATAMOTORS 1D Time frame📍 Current Price
₹715.25 (closing price)
Short-Term Outlook
Bullish Scenario: A sustained move above ₹731.00 could lead to a test of the 52-week high around ₹1,006.00.
Bearish Scenario: A drop below ₹690.00 may signal a potential pullback toward ₹680.00.

ICICIBANK 1D Time frame📍 Current Price
₹1,417.70 (closing price)
Short-Term Outlook
Bullish Scenario: A sustained move above ₹1,430 could lead to a test of the 52-week high around ₹1,500.
Bearish Scenario: A drop below ₹1,390 may signal a potential pullback toward ₹1,350.

HINDUNILVR 1D Time frame📍 Current Price
₹2,580.50 (down 1.58% from previous close)
Short-Term Outlook
Bullish Scenario: Sustained move above ₹2,650 could lead to a test of ₹2,700.
Bearish Scenario: Break below ₹2,553.70 may signal a deeper pullback toward ₹2,500.
