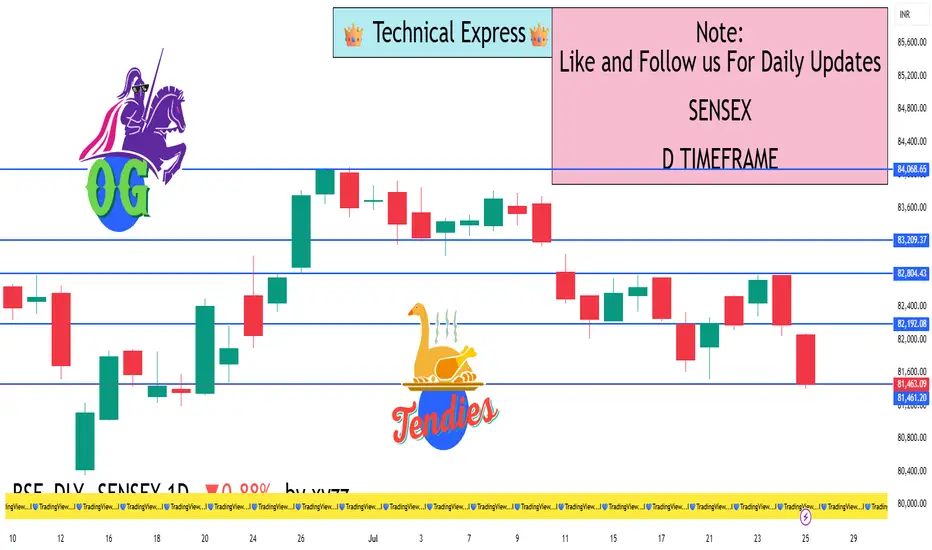
SENSEX 1D TimeframeClosing Value: 81,463.09
Net Change: −721.08 points (−0.88%)
Opening Level: 82,065.76
Day’s High: 82,069.51
Day’s Low: 81,397.69
Trend: Bearish
📊 Technical Analysis:
✅ Candle Type:
Large bearish candle with a close near the day’s low.
Indicates strong selling pressure throughout the session.
🔻 Support Levels:
81,400 – Immediate support (Friday’s low)
81,000 – Critical psychological and technical level
80,700 – Medium-term support zone
🔺 Resistance Levels:
82,070 – Intraday high and near-term resistance
82,300 – Minor resistance
82,500 – Strong resistance zone
📈 Indicator Summary:
RSI (Relative Strength Index): Likely below 50 – shows weakening buying strength
MACD: Bearish crossover – confirms ongoing downtrend
Volume: Higher than average – selling was broad-based and strong
🧠 Market Sentiment:
Bearish sentiment due to pressure in Auto, Banking, Energy, and IT sectors
Major stocks pulling down the index: Reliance, HDFC Bank, Infosys, Tech Mahindra, and Bajaj Finance
Investors showed caution amid FII selling, weak global signals, and earnings season pressure
✅ Conclusion:
Sensex is in a short-term downtrend
A breakdown below 81,000 could trigger a move toward 80,700 or lower
Bulls must reclaim 82,000–82,300 levels to regain positive momentum
TATAPOWER
Institutional Option Trading🏛️ Institutional Option Trading
Institutional Option Trading refers to how large financial institutions like hedge funds 📊, investment banks 🏦, insurance firms 🧾, and asset managers 💼 use options contracts strategically to hedge risks, generate income, or make large, leveraged bets with controlled risk.
These institutions trade options using:
🧠 Advanced analytics & algorithms
📉 Volatility-based strategies (like straddles, condors, and spreads)
📊 Risk-neutral positioning using Greeks (Delta, Vega, Theta, etc.)
🛡️ Portfolio hedging & macroeconomic plays
💼 Multi-million dollar contracts with custom structures
Their trading is not based on emotions, but on probabilities, risk-reward analysis, and long-term objectives.
📌 In simple words:
Institutional Option Trading is how big players use options smartly to manage risk and extract value — with precision, scale, and professional tools. 💼⚙️📈

Trading Master Class With Experts🎓 Trading Master Class With Experts
The Trading Master Class With Experts is a premium learning experience designed to take your trading skills to the next level by learning directly from market professionals – traders who’ve been in the game, seen the cycles, and built real strategies that work. 💼📈
In this expert-led masterclass, you will:
📊 Learn From Real Market Experts
🧠 Gain insights from institutional traders, analysts, and full-time professionals
🔍 Watch live trading sessions, analysis, and decision-making
🎯 Understand the logic behind high-probability trades
🔄 See how pros adapt to changing markets in real time
🔧 Master Advanced Trading Skills
📉 Deep dive into technical and fundamental analysis
💹 Learn options, futures, and multi-asset strategies
📍 Build a risk-managed trading system from scratch
⚙️ Use institutional tools: order flow, volume profiles, and price action
🛡️ Get Mentorship & Community
👥 Join a private trading community
💬 Get answers in live Q&A sessions
📈 Share progress, refine skills, and grow with a pro network
📌 In simple words:
The Trading Master Class With Experts is where serious traders learn the real rules of the game — directly from those who play it at the highest level.

Zero-Day Options (0DTE)🔍 What Are Zero-Day Options (0DTE)?
The term “0DTE” stands for Zero Days to Expiration. These are options contracts that expire on the same day you buy or sell them.
In simple words, if today is Thursday and you’re trading a weekly Nifty or BankNifty option that expires today — you're trading a 0DTE option.
This type of option:
Has no time left beyond today.
Is highly sensitive to price movement.
Is extremely risky and extremely rewarding.
Earlier, we only had Thursday expiry for weekly options. But now, due to growing popularity, exchanges have introduced:
Nifty 50 expiry: Monday to Friday (Daily)
Bank Nifty expiry: Tuesdays and Thursdays
Fin Nifty expiry: Tuesdays
Sensex expiry: Fridays
This means 0DTE trading can now happen almost every day!
📈 Why 0DTE Trading Has Become So Popular
Zero-Day Options are now one of the most actively traded instruments — both by retail and institutional traders. Here’s why:
1. Small Premiums, Big Potential
Since the option expires today, its price (premium) is very low — sometimes just ₹5 or ₹10. If the market moves in your favor, that ₹10 option can quickly become ₹50 or ₹100.
That’s a 5x to 10x return, sometimes in just 15-30 minutes.
2. No Overnight Risk
You’re in and out the same day. No gap-ups, no global tension ruining your position overnight.
3. Scalping Friendly
Perfect for intraday traders who don’t want to hold positions for long.
4. Lots of Movement Near Expiry
Prices jump fast because time is running out. This gives more opportunities — but also more chances to get trapped.
5. Better Tools & Platforms
With modern brokers offering real-time data, scalping tools, and fast execution — more traders are trying 0DTE.
💼 How Do 0DTE Options Work?
Let’s take a simple example:
Today is Thursday, and Nifty is trading around 22,000.
You think it will rise, so you buy a 22,100 Call Option (CE) at 11 AM for ₹15.
If Nifty rises 50 points in the next 30 minutes, your option may become ₹45.
That’s 200% return.
But… if Nifty remains flat or falls, your option may go to ₹0 by the end of the day.
What Makes Them Move So Fast?
There are 3 reasons:
Time Decay (Theta): Since it's the last day, every minute that passes reduces the option's value if there's no movement.
Volatility: Even small market moves can cause big percentage changes in premium.
Greeks Sensitivity: Delta, Gamma, and Vega — all move faster near expiry.
🔁 Most Common 0DTE Strategies
1. Directional Option Buying
Buy a Call or Put based on price action.
Works best when there's momentum or breakout.
Example: Buy 22,100 CE at ₹10 → Nifty moves up → Exit at ₹50.
👍 High reward
👎 High risk (can go to zero)
2. Straddle/Strangle Selling (Non-Directional)
Sell both Call and Put at the same or nearby strikes.
You win if the market stays in range.
Example: Sell 22,000 CE and 22,000 PE → Market closes at 22,000 → Both go to zero.
👍 Profit from time decay
👎 If market breaks out in any direction, huge loss
3. Iron Condor
Sell OTM Call and Put spreads to capture decay in a defined range.
Lower risk, but also lower return.
👍 Safer than naked straddle
👎 Limited reward
4. Scalping with 1-2 Candle Momentum
Monitor breakouts on 1-min or 3-min chart.
Take quick entries and exits with small quantities.
👍 Quick gains
👎 Requires sharp execution and discipline
🏦 Who Uses 0DTE — Institutions or Retail?
🔹 Institutions:
Use algos to sell options in range.
Make profit from premium decay.
Use 0DTE to hedge portfolios or capture intraday IV changes.
🔹 Retail Traders:
Use for quick profits or gambling.
Often go for cheap out-of-the-money options.
Tend to overtrade without understanding risk.
⚠️ Risks Involved in 0DTE Trading
Let’s be honest — 0DTE options are not safe for everyone.
Here are the major dangers:
1. Time Decay (Theta Burn)
Every minute, the option loses value unless the market moves.
2. Fast Premium Erosion
Flat markets = quick loss. A ₹10 option can go to ₹0 in 15 minutes.
3. No Margin for Error
You need to be right on direction, timing, AND speed. All three.
4. Emotional Stress
Prices jump fast. Without discipline, you’ll end up revenge trading.
5. Overtrading
Traders often re-enter after loss without a plan — increasing risk.
🎯 Real-World Example of a 0DTE Trade
Let’s say it's Tuesday, and you’re trading BankNifty (expires today).
10:00 AM: BankNifty at 47,200
You buy 47,300 CE at ₹12
10:30 AM: BankNifty jumps 80 points
Your CE becomes ₹42
You exit — 250% return
But…
If BankNifty remained flat or dropped, that ₹12 option may go to ₹3 or even ₹0.
Same day. Same strike. Two opposite outcomes.
💡 Tips for Beginners to Trade 0DTE Safely
Start with Small Capital
Never risk your full capital on one trade.
Set Hard Stop-Loss
Exit if your option loses 40-50%. No second thoughts.
Trade in Breakout Zones
Avoid choppy ranges — they kill premiums.
Watch Open Interest + Price Action
See where the buyers/sellers are active.
Trade First Hour or Last Hour
That’s when you get big movements and clear setups.
Avoid Trading Just for Fun
0DTE is not for boredom. It’s for precision and skill.
Do Not Hold Till 3:30 PM
If you’re an option buyer, premiums usually die in the last 15 minutes.
🧠 Should You Trade 0DTE Options?
✅ YES — if:
You have solid technical analysis
You understand risk management
You can stick to a strict plan
You are okay with losing 100% on a bad trade
❌ NO — if:
You are emotionally reactive
You don’t track charts closely
You trade with borrowed or large capital
You don’t know how option Greeks work
🏁 Final Words
Zero-Day Options are not just another strategy. They are a whole new mindset of trading.
If used with the right knowledge, strict rules, and patience, they can become a powerful weapon in your trading toolbox. But if misused, they are the fastest way to drain your account.
Respect the instrument. Learn the rules. Start small. Scale with confidence.
Divergence Secrets📌 What is Divergence?
Divergence occurs when the price action of a security moves in the opposite direction of a technical indicator or momentum oscillator.
There are two main types:
Regular Divergence – Signals potential reversal
Hidden Divergence – Signals trend continuation
🔍 1. Regular Divergence (Reversal Signal)
Occurs when:
Price makes a higher high, but the indicator makes a lower high (bearish divergence)
Price makes a lower low, but the indicator makes a higher low (bullish divergence)
✳️ Example:
Bearish divergence: Price is rising, but RSI is falling → Possible upcoming downtrend.
Bullish divergence: Price is falling, but MACD is rising → Possible upcoming uptrend.
This tells you the momentum is weakening, even though price appears strong.
🔍 2. Hidden Divergence (Trend Continuation)
Occurs when:
Price makes a higher low, but the indicator makes a lower low → Bullish hidden divergence
Price makes a lower high, but the indicator makes a higher high → Bearish hidden divergence
Hidden divergence shows that momentum is aligning with trend direction and suggests continuation.
📈 Indicators to Spot Divergence
RSI (Relative Strength Index)
Best for spotting overbought/oversold and divergences.
MACD (Moving Average Convergence Divergence)
Great for visualizing momentum divergence.
Stochastic Oscillator
Good for short-term divergence.
On-Balance Volume (OBV)
Helps spot divergence using volume behavior.
CCI (Commodity Channel Index)
🔐 Institutional Secret: Volume Divergence
Institutions look for divergence between price and volume:
Price making higher highs but volume falling? Institutions might be distributing (smart money exiting).
Price making lower lows but volume rising? Could be accumulation.
This is often missed by retail traders!
✅ How to Trade Divergence (Checklist)
🔸 Entry Strategy:
Wait for divergence confirmation on a strong indicator (RSI/MACD)
Use candlestick reversal patterns near divergence zones
Align with support/resistance or trendlines
🔸 Stop-Loss:
Always place below/above recent swing low/high (depending on long or short)
🔸 Take-Profit:
Use Fibonacci levels, previous structure, or trend-based targets
⚠️ Common Mistakes
Trading divergence without price confirmation
Forcing divergence on weak or flat trends
Ignoring higher timeframe context
Using only one indicator
Always confirm with price structure, volume, and multi-timeframe analysis.
🎯 Pro Tip: Combine with Institutional Tools
Use Order Blocks + Divergence = Strong reversal signal
Combine Liquidity Zones + Divergence = Catch smart money traps
Divergence + Imbalance zones = Laser-precise entries.

Master Institutional Trading🔷 What is “Master Institutional Trading”?
Master Institutional Trading refers to mastering the art and science of how big players (institutions) operate in the financial markets—especially in equities, derivatives, and futures. This includes understanding how they think, trade, manage risk, and move money.
Institutions include:
Hedge Funds
Mutual Funds
Foreign Institutional Investors (FIIs)
Domestic Institutional Investors (DIIs)
Proprietary Trading Desks
Investment Banks
These players account for over 80% of the market volume, so understanding how they trade is crucial if you want to trade profitably. Mastering institutional trading means not following retail patterns or lagging indicators—it means learning how to track smart money and align your trades with theirs.
🔶 Why is Mastering Institutional Trading Important?
Most retail traders:
Trade based on tips or indicators
Use small capital with high risk
Get trapped by smart money moves (fake breakouts, stop loss hunts)
Lose because they don’t understand the real forces behind price movement
But once you learn institutional trading:
✅ You stop chasing trades
✅ You avoid retail traps
✅ You begin to trade with the trend and understand liquidity behavior
✅ You align your entries with where institutions enter/exit
This is the difference between being a random trader and a skilled, consistently profitable trader.
🔷 Key Institutional Trading Concepts You Must Master
📊 1. Market Structure (Not Just Candles)
Institutions don’t rely on RSI or MACD. They follow market structure, which includes:
Higher Highs & Higher Lows (uptrend)
Lower Highs & Lower Lows (downtrend)
Range & Consolidation Zones
Break of Structure (BOS) – signals direction shift
Change of Character (ChoCH) – where market flips direction
They wait for market structure to align before placing trades. If you don’t understand structure, you’re trading blind.
🔍 2. Liquidity & Smart Money Concepts (SMC)
Institutions need liquidity to place massive orders. But liquidity is created through:
✅ Retail Stop-Loss Orders
✅ Fake Breakouts
✅ News-Based FOMO entries
Institutions purposely trigger these levels to enter or exit quietly.
Key smart money concepts:
Order Blocks – where institutions enter bulk orders
Liquidity Pools – areas where retail stop-losses sit
Imbalance / Fair Value Gaps (FVG) – price moves too fast, returns later
Mitigation Blocks – previous institutional entries revisited
🎯 Learn these areas to enter with institutions, not against them.
📈 3. Volume & Order Flow Analysis
Institutions move in and out using volume. Retail traders don’t understand volume deeply.
Mastering institutional trading means tracking:
Volume Spikes near key zones
Footprint Charts (Volume per candle)
Delta Volume (Buy vs Sell pressure)
Also important: Volume Profile—it shows where the most trading happened, and that’s often where institutions are active.
⚖️ 5. Risk Management Like Institutions
Institutions don’t risk their capital blindly. They:
✅ Use fixed % risk per trade (like 0.5% or 1%)
✅ Use multi-layer hedging techniques
✅ Track correlation between sectors
✅ Don’t overtrade—they wait for high-probability setups
You need to build the same habit:
Never risk more than 1–2% per trade
Define entry, stop loss, target clearly
Avoid overleveraging, especially in options
📉 6. Institutional Options & Derivatives Tactics
Institutions use options for:
Hedging large equity positions
Generating income (selling options)
Directional bets with limited risk
Creating synthetic long/short positions
You’ll learn:
Open Interest Analysis
Option Greeks (Delta, Theta, Gamma, Vega)
Institutional options setups (Short Straddle, Ratio Spread)
Volume-OI Divergence (when data doesn't match the price)
These help you follow institutional footprints in options chain.
📚 7. Economic and Macro Analysis
Institutions also look at:
Interest rates (RBI/FED policies)
Inflation, GDP, Unemployment data
Sector rotation based on economic trends
Mastering institutional trading means learning macro context to know:
Which sectors will rise/fall
Which events move volatility
How FIIs/DIIs flow capital across sectors
🔧 8. Tools Used in Institutional Trading
You won’t find institutions using free websites for trading.
They use:
Bloomberg Terminal / Reuters
Institutional platforms like MetaStock, CQG, NinjaTrader
Order Flow Tools (e.g., Bookmap, Sierra Chart)
Algo + Automation Tools
High-speed execution setups
Retail traders can still mimic them using:
TradingView + Volume Profile tools
Option Analytics tools (Sensibull, Opstra)
Volume/Delta-based indicators
📅 9. Intraday vs Positional – Institutional Styles
Institutions use both styles:
✅ Intraday:
High-frequency strategies
Scalping based on liquidity
Options intraday decay selling
✅ Positional:
Sector rotation plays
Accumulation of stocks over weeks/months
Event-driven strategies (earnings, budget, rate hikes)
You need to choose what style suits your capital, time, and personality.
👣 10. Following Institutional Footprints
You can track them through:
🟩 Bulk Deal & Block Deal Data (NSE site)
🟩 FIIs & DIIs Buying/Selling Activity
🟩 Option Chain + OI shifts
🟩 Price rejection from key supply-demand levels
🟩 Volume spikes with no news
🎯 These are the breadcrumbs smart money leaves behind.
🎓 How to Master Institutional Trading – Step-by-Step Roadmap
Step 1: Master Market Structure
Learn BOS, CHoCH, HH-LL analysis
Study smart money patterns
Step 2: Study Order Blocks & Liquidity Zones
Mark order blocks, gaps, imbalance zones
Use TradingView to practice
Step 3: Learn Volume + OI Analysis
Understand OI buildup, unwinding
Track volume spikes, exhaustion points
Step 4: Study Options Data
Learn options chain interpretation
Practice on Bank Nifty/Nifty with OI analysis
Step 5: Develop Strategy
Build high RRR strategies (minimum 1:2)
Include entry, stop loss, target rules
Step 6: Practice With Real Charts
Use market replay tools
Analyze previous days—“what did institutions do?”
Step 7: Journal Everything
Log trades, reasons, emotions, outcomes
Focus on learning, not just profit
📌 Final Thoughts
Mastering Institutional Trading isn’t about learning 100 strategies.
It’s about learning:
How markets actually move
Why smart money creates traps
How to follow institutional zones
How to manage risk like a professional
You’ll no longer be confused by breakouts or false news.
You’ll start seeing behind the candles—where the real action is happening.

Institutional Objectives in Options Trading🔷 What Are Institutions in the Market?
Before diving into their objectives, let’s first understand who institutions are:
Institutions are large, professional organizations that trade in the financial markets using massive amounts of capital. These include:
Mutual Funds
Hedge Funds
Pension Funds
Insurance Companies
Investment Banks
FIIs (Foreign Institutional Investors)
Proprietary Trading Firms
These players account for over 80-90% of daily turnover in options markets like NSE’s Bank Nifty and Nifty. Unlike retail traders, they don’t trade emotionally or randomly. Every move they make has a calculated reason behind it.
🎯 Why Do Institutions Use Options?
Options are powerful tools. Institutions don’t just trade them for direction; they use options to achieve multiple objectives:
✅ 1. Hedging Portfolios
🔍 Objective:
To protect their large equity/futures holdings from adverse market movements.
Institutions have huge long-term positions in stocks or indices. If the market falls sharply, these positions can suffer big losses. So, they use PUT options to hedge.
📈 Example:
A pension fund holds ₹500 crore worth of Nifty 50 stocks.
It buys Nifty 50 PUT Options at 22,000 strike.
If market crashes, the loss in stocks is offset by profit in PUTs.
📌 Result: Limited downside, peace of mind, capital protection.
✅ 2. Generating Additional Income (Option Writing)
🔍 Objective:
To generate consistent income from existing holdings through Covered Calls, Cash-secured Puts, or Iron Condors.
Institutions write options (sell) to earn premium—especially in sideways markets.
💡 Examples:
Covered Call: Own Reliance shares + Sell OTM Call option to earn income.
Short Strangles: Sell far OTM Put and Call if volatility is high.
Iron Condor: Sell call/put spreads to profit from time decay.
📌 Result: Generates passive income with controlled risk.
✅ 3. Arbitrage and Spread Trading
🔍 Objective:
To lock in risk-free or low-risk profits through price inefficiencies.
Institutions use Calendar Spreads, Box Spreads, or Volatility Arbitrage to exploit inefficiencies in option pricing.
🔧 Example:
Calendar Spread: Buy Nifty 22500 CE in August, sell Nifty 22500 CE in July.
Profit from IV differences or time decay.
📌 Result: Non-directional trading, but consistent profits with high capital.
✅ 4. Taking Directional Bets With Defined Risk
🔍 Objective:
To take high-conviction trades without exposing entire capital like futures.
Institutions use Debit Spreads, Straddles, or Long Options for directional views with limited risk.
💡 Example:
If expecting a bullish breakout, they might:
Buy 22000 CE
Sell 22200 CE
It caps both risk and profit. Perfect for risk-managed directional exposure.
📌 Result: Risk-defined entry into market trends without using futures.
✅ 5. Volatility Trading (Not Price Trading)
Institutions often trade volatility, not just price direction. They use Straddles, Strangles, Calendar Spreads to play IV.
💡 Example:
If implied volatility is low and an event is coming (like RBI policy):
Buy Straddle (ATM Call + Put)
Expect IV spike or a big move
📌 Result: Profit from volatility expansion or collapse, even if price stays in a range.
✅ 6. Managing Fund Exposure / Risk Neutralizing
Large funds have multiple exposures—options help them balance and adjust their overall risk (Delta-neutral, Vega-neutral, etc.).
They regularly:
Adjust positions using Gamma scalping
Balance portfolio Delta using options
Reduce Vega risk in high IV periods
📌 Result: A smooth, hedged, and controlled portfolio with minimal exposure to wild market moves.
✅ 7. Creating Synthetic Positions
Sometimes, instead of using equity or futures, institutions use options to replicate or create synthetic trades.
💡 Example:
Buy Call + Sell Put = Synthetic Long Future
Sell Call + Buy Put = Synthetic Short
This helps institutions:
Avoid STT, slippage
Better margin use
Higher flexibility with position sizing
📌 Result: Capital efficiency and strategic execution
📈 How to Spot Institutional Activity in Options?
You can decode institutional movement using these tools:
🔸 1. Open Interest (OI) Analysis
Spike in OI with price action = smart money at work
Build-up of OI near a strike = possible resistance/support zone
Use tools like Sensibull, Opstra
🔸 2. Volume + Price Movement
Sudden spike in volume in far OTM options = Institutional hedging or setup
Buy-Sell flow data shows positioning
🔸 3. Put-Call Ratio (PCR)
Used to detect market sentiment and institutional net positioning
🔸 4. IV Charts / Skew
Institutional volatility strategies are visible through steep IV skew or unusual IV changes
🔐 Final Thoughts
Institutional trading in options is not speculation. It is a scientific approach to manage:
Capital exposure
Risk control
Income generation
Volatility protection
Their objectives are not just to win trades, but to:
Protect capital
Optimize returns
Stay profitable in all market conditions

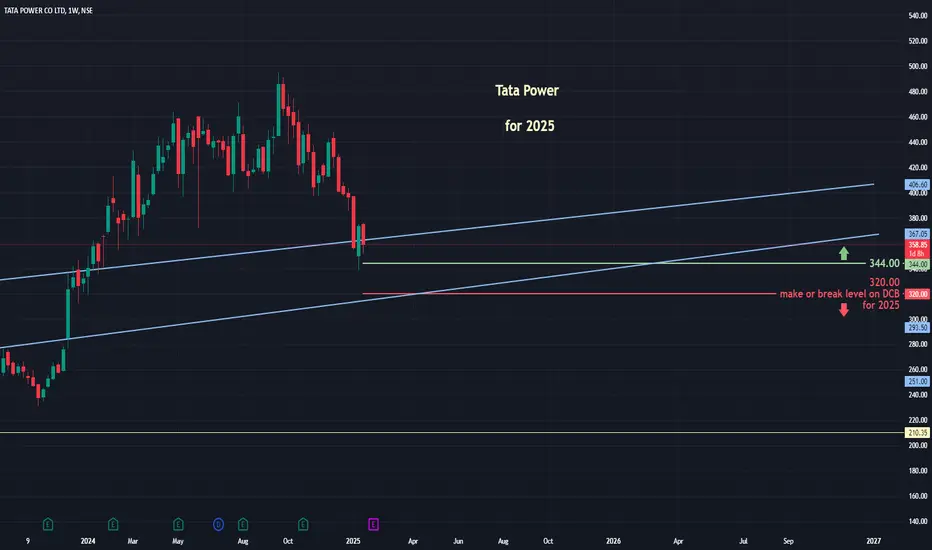
TatapowerTata Power
One of the most favorite stock of traders and investors...
What a down fall from 490 odd levels to 330 odd levels
for investments i think you can start doing SIP from 160 odd levels....
Above 405 on EOD closing basis more fire works...
important levels marked for planning entry and exits....
Like... Share... and Comment....

Tata Power...One of the most liked stock in power sector is Tata Power.
Almost down 25%+ from high of 495 in Sep 2024
made a low of 338 from 495
Fundamentally Strong
I have marked some important make or break levels on chart....
Happy Trading
Like.... Share and Subscribe
TATA POWER - Short & Long Term View- Wave AnalysisTATA POWER CMP: 428.45; RSI: 50.05
TATA Power in Primary bull cycle & in mid of impulse wave-3 in weekly chart basis. This, Primary Impulse wave-3, should take the price to levels of 646 (1.618x) in next 8-10 month of time frame. While wave within the wave, on shorter time frame, on daily chart frame, its middle of intermediate corrective wave-4, which may retrace the price till 365 to 330 levels in coming 3-4 months.
Value Buy level : 330-365;
Accumulation zone: 330-390;
Mid term target (Q1 FY: 25-26): 600-650
Long Term Target ( 3-4 Yrs): 850-900

TatapowerTatapower is on the verge of breaking near term first swing low.
this may initiated bearish dow theory on daily time frame.
watchout the bear for next 3 months

TATA POWER SWING TRADE | DAILY CHARTTATA POWER SWING TRADE
Hi trade this is chennel breakout and retest at level 420-415 in green candle
i will take entry with green candle low SL.
target 485,520
Note - Only for education purpose..
GIVE LIKE SHARE AND FOLLOW

#TORNTPOWER 1668 TGT 15% 1940+ NSE:TORNTPOWER
Target 1940 15% upside
NSE:TORNTPOWER CPM 1668
TGT 1940+ (15%)
SL 1550
TF < 6M
If you like my work KINDLY LIKE SHARE & FOLLOW this page for free Stock Recommendations. With 💚 from Rachit Sethia

A Good Bounce Can be Seen from the recent support zone.A Good Bounce Can be Seen from the recent support zone and the price has also broken above the resistance trendline with some good bullish momentum, and sighting the current changing market condition this can be the just right time to buy tata power in my opinion and we might see the resistance being broken this time after several failed retests.

Tata Motors breakout from parallel channel looking goodTata motors breakout from parallel channel
and also nifty50 looking good now i think from now short covering is coming
to near upside levels marked on chart
breakout and sustaining out side of channel
anybody can clearly see the break off structure in 15 Min chart
but be cautious with strict SL
:- do your own research before investing and this is not a buy/sell call
am not a sebi registered

PTC India for 100%+ gainsDate: 25 Nov’24
Symbol: PTC
Timeframe: Weekly
Seems like, Wave 4 is finally over in PTC India (in my 15th Sept post, I mentioned it as already over but the Wave was a complex one) and it will soon resume its up move in Wave 5 for the destination of 370-80. Some interesting facts to know why it can still double up from its current price of 168?
a. Healthy sales growth and debt reduction (lower interest cost) resulting in better balance sheet
b. Trading at very low Market Cap to Sales ratio of 0.30 and below book value
c. On charts, the stock is currently trading at price lower than December 2007 (it made a high of 201 in 2007)
This is not a prediction but a possible wave count. This is also not a recommendation to trade or invest. Please do your own analysis.
Aakhirkaar PTC India mein Wave 4 khatam hota dikh raha hai (mere 15 September ke post mein, maine kaha tha Wave 4 lagta hai end ho gaya hai par usne complex roop leliya) aur yah jald hee 370-80 ke lakshya ke lie Wave 5 mein apanee upmove phir se shuroo kar dega. Yah stock 168 se current price se kyon double ho sakta hai, neeche padhe.
a. Achi sales growth aur debt mein kamee (kam interest payments) ke kaaran ab balance sheet better hogayi hai
b. 0.30 ke bahut kam market cap to sales ratio aur aaj ka price book value se bhi kam hona
c. Chart par, stock abhi bhi December 2007 se bhi kam price par trade kar raha hai (2007 mein isne 201 ka high banaaya tha)

Tata Power - Near Strong Support412-410 Temporary support
402-400 Strong support
Expecting stock to come near 400 levels before turning around and turning bullish
Stock may pause a little before turning
Any close below 398 will negate the view
Expect at least 450+ as 1st target and 490 second if plays around well
Trade cautiously

TATAPOWER 1D TFNSE:TATAPOWER broke a trend line and is moving around a demand zone. The market need strength to break this demand zone hence waiting for the entry is good. If the market breaks the demand zone with a good candle or if a retracement occurs the entry could be taken.
We have discussed this more on our previous post. You can view the previous post by clicking the attachment below this post.
Disclaimer:- This analysis is only for educational purpose. Please always do your own analysis or consult with your financial advisor before taking any kind of trades

TATA POWER#TATAPOWER Potential 10% upside
Swing Trade candidate
CMP 451
Target 495
Risk Reward 1:2
Strong RSI and good fundamental company

Adani Power for 70% gainsDate: 01 Nov’24
Symbol: ADANIPOWER
Timeframe: Daily
The Big Question is - if Wave IV in Adani Power is now over? A higher high after a close above 675 will make it official. Is 570 a strong enough support? Looks like it. As seen in the chart, a circle has been marked as an accumulation zone. Wave V is likely to head to 1050 levels (70% from current price of 600); more clarity on target will emerge as it moves above 750.
Sept quarter results at operational levels were descent but because of lower other income and higher tax; Sept quarter of last FY looks stronger.
This is not a trade recommendation. Please do your own analysis.
HINGLISH VERSION
Bada savaal yah hai ki kya Adani Power mein Wave IV ab khatm ho gaya hai? 675 se upar band hone ke baad ek uchchatar oonchaee ise aadhikaarik bana degi. Kya 570 paryaapt majaboot support level hai? Aisa lagta hai. Jaisa ki chart mein dekha gaya hai, ek sarkal ko accumulation zone ke roop mein chihnit kiya gaya hai. Wave V ke 1050 ke star (600 kee maujooda keemat se 70%) tak pahunchane kee sambhaavana hai, jaise hi yah 750 se upar jaega, target par adhik spashtata saamane aaegee.
Operational star par September quarter ke nateeje achhe the. Lekin other income kam hone aur adhik tax ke kaaran; pichhale financial year ka September timaahee majaboot dikh raha hai.
Yah koi trade lene ki salah nahi hai. Kripya apana vishleshan svayan karein.

Tata Power for 20% gainsDate: 27 Sept’24
Stock: Tata Power
Timeframe: Daily chart
Tata Power seems to be in Wave V of 5 which is heading towards 580 levels (20% from current price of 485) as seen in the chart. It is then likely to go into a longer consolidation (a larger timeframe Wave 4) which I will analyse in due course. Likely to achieve this target by end of this year? (Yes, I would like to think so).
This is not a trade recommendation. Please do your own due diligence.

TATAPOWER There's a GAP pending below at 435
So chances are high it could fill within 21st Oct 2024
Disclaimer:
It's a personal view not a financial advice and I assume no responsibility and liability whatever outcome arises

TATA POWERAll important points are marked.
𝐃𝐢𝐬𝐜𝐥𝐚𝐢𝐦𝐞𝐫: 𝐈𝐧𝐯𝐞𝐬𝐭𝐦𝐞𝐧𝐭 𝐢𝐧 𝐬𝐞𝐜𝐮𝐫𝐢𝐭𝐢𝐞𝐬 𝐦𝐚𝐫𝐤𝐞𝐭 𝐚𝐫𝐞 𝐬𝐮𝐛𝐣𝐞𝐜𝐭 𝐭𝐨 𝐦𝐚𝐫𝐤𝐞𝐭 𝐫𝐢𝐬𝐤𝐬, 𝐫𝐞𝐚𝐝 𝐚𝐥𝐥 𝐭𝐡𝐞 𝐫𝐞𝐥𝐚𝐭𝐞𝐝 𝐝𝐨𝐜𝐮𝐦𝐞𝐧𝐭𝐬 𝐜𝐚𝐫𝐞𝐟𝐮𝐥𝐥𝐲 𝐛𝐞𝐟𝐨𝐫𝐞 𝐢𝐧𝐯𝐞𝐬𝐭𝐢𝐧𝐠. 𝐒𝐭𝐨𝐜𝐤𝐬 𝐬𝐮𝐠𝐠𝐞𝐬𝐭𝐞𝐝 𝐢𝐧 𝐭𝐡𝐢𝐬 𝐠𝐫𝐨𝐮𝐩 𝐚𝐫𝐞 𝐟𝐨𝐫 𝐞𝐝𝐮𝐜𝐚𝐭𝐢𝐨𝐧 𝐩𝐮𝐫𝐩𝐨𝐬𝐞. 𝐖𝐞 𝐝𝐨𝐧𝐭 𝐦𝐚𝐤𝐞 𝐚𝐧𝐲 𝐩𝐫𝐨𝐟𝐢𝐭𝐬 𝐟𝐫𝐨𝐦 𝐭𝐡𝐢𝐬 𝐫𝐞𝐜𝐨𝐦𝐦𝐞𝐧𝐝𝐚𝐭𝐢𝐨𝐧𝐬 𝐞𝐯𝐞𝐫𝐲𝐭𝐡𝐢𝐧𝐠 𝐬𝐡𝐚𝐫𝐞𝐝 𝐡𝐞𝐫𝐞 𝐚𝐫𝐞 𝐜𝐨𝐦𝐩𝐥𝐞𝐭𝐞𝐥𝐲 𝐨𝐟 𝐟𝐫𝐞𝐞 𝐨𝐟 𝐜𝐨𝐬𝐭.
