Explanation of RSIThe Relative Strength Index (RSI) is a momentum indicator used in technical analysis to assess the speed and magnitude of price changes. It helps traders identify potential overbought and oversold conditions in a financial instrument, suggesting when an asset might be nearing a trend reversal. RSI values range from 0 to 100, with readings below 30 often indicating oversold conditions and readings above 70 suggesting overbought conditions.
Techncal

Pidilite Industries
PIDILITE Industries is forming a Head and shoulders pattern on 4 Hour Time frame, although the chart is looking bullish and the price is also at a round number
support i.e., 3000, but as this indication is on 4 hour we cannot ignore it.
We will wait for the price to breakdown and let the first 30 min candle close below the neckline and do a retest or give us some confirmation candles.
We will also keep a eye, how price is rejecting from 3000 if it gives us some concrete confluences we will looking for long trades only, trend priority

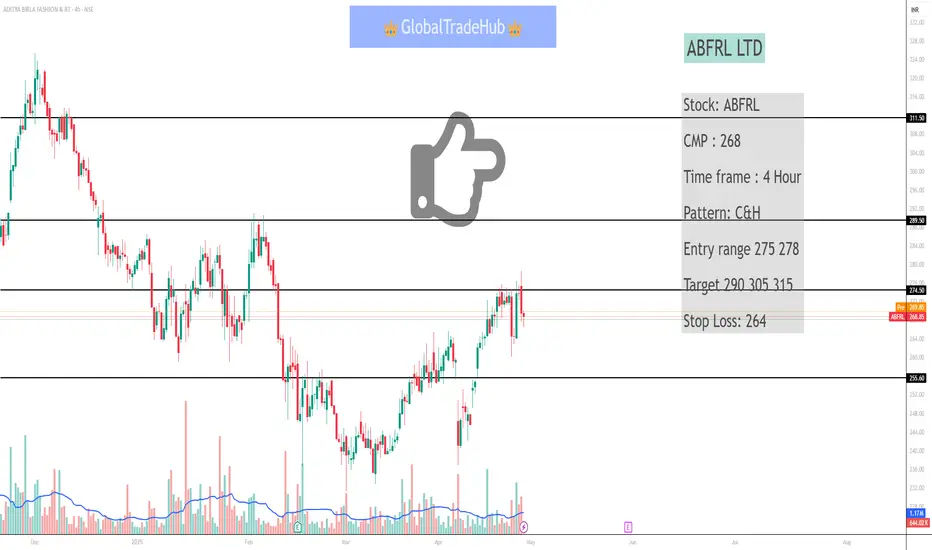
ABFRL LTDABFRL LTD
I'm not a SEBI - Registered advisor. All the information provided is for educational and information purposes only.
Note- This is not buy/sell recommendation, before investing discuss with your financial adviser
Stock: ABFRL
CMP : 268
Time frame : 4 Hour
Pattern: C&H
Entry range 275 278
Target 290 305 315
Stop Loss: 264
#ABFRL
Option Chain AnalysisAn option chain is a comprehensive list of all available option contracts for a specific underlying asset, typically a stock, index, or commodity. It's organized by strike price and expiration date, displaying both call and put options. Traders use this information to understand market sentiment, develop trading strategies, and manage risk.

USDCADUSDCAD LOOKING LIKE BULLISH IN MARKET BUT O TOP THERE IS RESISTANCE AND RESISTANCE ZONE WHEN IT BREAK RESISTANCE ZONE IT MAY HAVE STRONG BULLISH MARKET .... BUT MAX CHANCES IS MAY MAY BE BEARISH.
#VSGROUPS #VAMSHICHICHU #USDCAD
