Gold Breaks Falling Resistance– Structure Shift Signals PossibleGold has finally broken above the falling resistance trendline, and more importantly, the market structure has flipped. This is the key reason why breakout trades start working better after long corrections.
Earlier, price was respecting the falling trendline, but once sellers failed to push it lower, buyers stepped in with strength. The breakout candle shows a clear momentum shift, and price is now holding above the previous resistance area.
This zone is important. As long as price stays above it, the bias remains bullish, and the upside continuation zone becomes active. Pullbacks into this area are not weakness, they are retests.
However, if price fails to hold below the marked risk zone, the breakout idea gets invalidated. Until then, the structure favors buyers.
Strong trends don’t reverse instantly, they pause, flip structure, and then continue.
What I’m Watching now on chart:
Breakout Level: Falling resistance trendline
Bullish Sign: Strong close and hold above breakout
Upside Zone: Green highlighted area
Risk Area: Below the red zone
Rahul’s Insight:
Most traders chase breakouts too early. The real edge comes when structure flips and holds, not just when a line breaks.
Disclaimer :This analysis is for educational purposes only and should not be considered financial advice. Markets involve risk. Please do your own analysis and manage risk properly before taking any trade.
Technical Analysis

NIFTY 50 – 2H TF ANALYSIS FOR 10.02.26NIFTY currently trading around the 0.7 Fibonacci retracement (~25,838) which is acting as an immediate decision level.
📊 Market Structure:
• Overall structure still corrective (range bound after displacement)
• Sharp rejection candle near highs = possible distribution wick
• Price approaching higher timeframe supply
🧠 Key Levels:
🔼 Strong Supply Zone: 25,993 – 26,173
If price reaches this zone → look for bearish confirmation
🔽 Support Levels:
25,838 – Intraday decision level
25,477 – Major support (0.5 level)
24,573 – Swing low (liquidity pool)
📍 Trading Plan:
Bullish above 25,838 with continuation towards supply zone 25993-26173
Bearish only after rejection inside supply zone
Wait for confirmation (BOS / CHoCH / liquidity grab) — no blind entries.
Note: I am not a SEBI registered research analyst. Hence, this post is for Educational Purpose only.
Regards
Bull Man

When Price Respects Structure: MTFAThis post is not a forecast and not a trade idea.
It’s simply a visual study of how price behaves when multiple higher-timeframe elements overlap.
Using historical price action only, this chart highlights:
-Monthly Fair Value Gap (Green Zone)
Showing how price reacts, respects, and rebalances inefficiencies over time.
-Monthly Supply Zone (Red Zone)
Clearly defining areas where price historically showed strong selling interest.
-Higher Timeframe Symmetrical Triangle (Green Lines)
Drawn from a broader weekly structure, showcasing compression and balance in price.
-Internal Counter Trend Line (White Line)
Capturing the internal rhythm and reactions within the larger structure.
What stands out is how price continuously respects these elements:
-Multiple reactions at the fair value gap
-Clean interaction with supply
-Price oscillating within structure rather than moving randomly
Disclaimer:
This post is strictly for educational and illustrative purposes only.
It does not represent any buy/sell recommendation, forecast, or financial advice.
All markings are based on historical price data to demonstrate price action behavior.

USDCHF Is Not Weak – It’s Testing Support!USD/CHF is currently trading inside a well-defined rising channel, and the recent move lower looks more like a pullback into trend support rather than a breakdown.
For me, this is typical behavior in trending markets. Strong moves don’t continue in a straight line, price pulls back, tests support, and then decides the next direction based on reaction.
As long as the rising support holds, the broader structure remains intact. The next move will depend on how price behaves from this zone, not on short-term volatility.
This is a structure observation, not a prediction.
Disclaimer: This analysis is for educational purposes only and does not constitute financial advice. Trading involves risk.

XAUUSD (Gold) | Technical Levels | 9th Feb'2026XAU/USD Technical Update – 9 Feb 2026
Gold is trading at $5,017.73, showing strong bullish momentum across multiple timeframes. Key support is at $4,987–$5,016, while resistance lies near $5,035–$5,064. In a bullish scenario, buying dips near support can target $5,035 and $5,064 with a stop loss at $4,980. In a bearish case, selling near resistance can target $5,016 and $4,987 with a stop at $5,070. Overall, the trend favors buying on dips, but overbought conditions may trigger short-term corrections.
Key Levels:
Support: $4,987 – $5,016
Resistance: $5,035 – $5,064
Bullish Scenario:
Buy dips near $4,987–$5,016
Targets: $5,035 / $5,064
Stop Loss: $4,980
Bearish Scenario:
Sell near $5,035–$5,064
Targets: $5,016 / $4,987
Stop Loss: $5,070
Strategy: Follow trend; buy on dips, sell near resistance. Overbought indicators may trigger short corrections.
Disclaimer: For informational purposes only. Trading involves risk.

#BANKNIFTY PE & CE Levels(06/02/2026)Bank Nifty is expected to open flat, indicating a continuation of the ongoing consolidation phase. Price action over the last few sessions shows that the index is trading within a tight range, reflecting indecision among participants. There is no strong gap or momentum bias visible at the open, so the first half of the session may remain range-bound with false breakouts possible around key levels.
On the upside, the 60050–60100 zone is the immediate resistance and trigger area. A sustained move above this zone with acceptance can open the door for upside targets at 60250, 60350, and 60450+. This level has acted as a supply zone earlier, so only a clean breakout with volume should be considered for fresh long positions. Until that happens, upside moves may face selling pressure near resistance.
On the downside, 59950 is the key support to watch. If Bank Nifty breaks and sustains below 59950, selling pressure can increase, leading to downside targets at 59750, 59650, and 59550, where the next demand zone is placed. This lower zone is expected to attract buyers, so aggressive shorts should be cautious near those levels and consider booking profits.
Overall, the structure clearly favors a range-trading approach for the day. Traders should avoid positional bias and focus on trading confirmation at levels rather than predicting direction. Scalping or short-term trades near support and resistance with strict stop-losses will be more effective until Bank Nifty gives a decisive breakout or breakdown from this consolidation range.

Bearish continuation for BTCUSD📍 Primary Plan — Short the Pullback
✅ Entry Zone (Sell)
69,800 – 70,800
Reason:
Previous breakdown area
Intraday supply
Likely retest zone after bounce
🛑 Stop Loss
Above 71,300
Why:
Above last lower-high cluster
Above pullback structure
If price gets here → bearish idea weakens
🎯 Targets
Target Level Logic
T1 68,000 intraday support
T2 66,500 recent sweep zone
T3 65,000 next liquidity pocket
T4 60,000 Final stoppage
Scale out — don’t hold full size to last target.
🚀 Alternate Plan — Breakout Long (Only If Structure Shifts)
Right now this is counter-trend — so only trade if confirmed.
✅ Breakout Confirmation (Must Have)
15m candle close + hold above 71,000–71,200
Not just a wick — a body close + small pullback hold.
📍 Long Entry Zone
On retest of 71,000–71,200 after breakout
🛑 Stop Loss (Long)
Below 70,200
🎯 Long Targets
Target Level
T1 72,300
T2 73,100
T3 74,200
⚠️ Quick Reality Check (Important)
Right now:
Momentum = bearish
Structure = lower highs / lower lows
Best edge = short pullbacks, not blind longs
Breakout longs only after reclaim — no anticipation trades here 😄

BNBUSDT – Daily Timeframe AnalysisBNB is reacting from a strong support zone around 770 after a sharp sell-off. I’m looking for a bounce from this demand area for a possible short-term recovery.
Plan:
📍 Entry zone: 770–780
🎯 Target: 950–1000 (previous resistance area)
🛑 Stop-loss: Below 700
Bias: Cautious bullish while price holds above support.
If support fails, bearish continuation toward lower levels is possible.
Not financial advice. Trade with proper risk management.

Updater Services (UDS) – Wave (B) Exhaustion | Wave (C) Counter-Timeframe: Weekly
Market: NSE
Method: Elliott Wave + Fibonacci Projection
Updater Services appears to be completing a higher-degree corrective Wave (B) after a full ABC advance into 438.
The entire decline from the top has been overlapping, channelized, and time-consuming, confirming a corrective structure rather than an impulse.
Wave Structure Overview
Wave (A): Corrective rise into ~438
Wave (B): a–b–c decline, now near the lower boundary of the long-term falling channel
Wave (C): Expected counter-trend rally once Wave (B) exhaustion confirms
🎯 Wave (C) Target Zones (Projected Using Wave A)
Targets are derived using Trend-Based Fibonacci Extension
(Start of A → End of A → End of B)
0.382 Fib: ~225–230 → First reaction / partial booking
0.618 Fib: ~270–280 → Normal Wave (C)
1.0 Fib: ~330–360 → Only if price turns impulsive
⚠️ This is a corrective Wave (C), not a trend reversal unless momentum and structure confirm.
🛑 Invalidation
A sustained weekly close below the Wave (B) low (~145–150) invalidates the Wave (C) thesis.

Chumtrades XAUUSD Has Wave B finished?GOLD – DAILY PLAN
Has Wave B finished?
→ No confirmation yet.
Macro & Market Sentiment
US–Iran negotiations have been cancelled. Geopolitical risks remain, but not strong enough to trigger a new bullish wave.
Gold experienced a relatively calm trading session, failed to break above the key level around 5,100, and saw a moderate pullback during the US session.
The Daily candle formed a Spinning Top, indicating market indecision and consolidation, with a lack of momentum for a breakout.
👉 Macro factors are supporting prices, but not pushing the market into an immediate uptrend.
Technical Structure & Outlook
Price is still moving within a descending price channel.
On the H1 timeframe, price has broken above the 4,888 key level, showing a technical rebound.
However, the higher timeframe structure remains bearish, with no confirmed trend reversal.
→ Therefore, current rebounds are considered pullbacks within a downtrend.
Key Levels
Support: 4,810 | 4,830 | 4,700–4,750 | 4,650–4,624
Resistance: 4,950–5,000 | 5,100
Trading Scenarios
Primary strategy: Sell the rallies within the descending channel.
Look for SELL setups near resistance zones, targeting lower lows.
Momentum SELL may be considered if price clearly breaks below 4,882–4,890, with confirmation on H2 or H4, targeting around 4,810.
No BUY positions while price remains inside the descending channel.
👉 Only if price breaks and holds above 5,100, will we start reassessing a trend-following BUY scenario.
👉 Deeper pullbacks are viewed as potential zones for swing BUY opportunities, not short-term buys at this stage.
Note: The market is in a “confidence-testing” phase. Focus on zone-based trading, trend alignment, reduced position size, and avoid FOMO.

Ascending triangle formation in sundaram financeA sign of good consolidation and a possible breakout in sundaram finance technical chart.
A clear breakout confirmation would only after the high of the weekly candle is crossed.
This can be a good investment opportunity based on technical pattern.
DISC: Please invest based on your financial advisor advice only. This is not a buy or sell recommendation.

XAUUSD (Gold) | BULLISH VS BEARISH LEVEL | 4th Feb'2026Gold remains bullish above 5,015–4,995, which is the major demand zone and key trend support. Intraday pullbacks toward 5,030–5,050 can offer buy-on-dips opportunities as long as price holds above this base.
On the upside, 5,090–5,100 is the immediate supply zone. A sustained breakout above 5,100 can accelerate momentum toward 5,125–5,160 and further to 5,200. Only a decisive hourly close below 4,995 would weaken the bullish structure and open downside toward 4,960–4,920.
Market Bias: Bullish above 5,015 | Neutral 5,015–5,050 | Bearish below 4,995

USDJPY Pullback Explained: Trend Support in Focus!For me, USDJPY is still behaving like a healthy uptrend, not a market that is rolling over. Price has been respecting a clear rising channel structure, with buyers consistently defending higher lows.
The recent move lower looks more like a pullback into major trend support rather than a sign of weakness. This is exactly how strong trends usually behave, they pause, retrace, and then decide the next leg based on support reaction.
From a broader perspective:
On the fundamental side, currencies are currently adjusting to shifting rate expectations and global risk sentiment. In such phases, trends rarely reverse immediately. Instead, price often retraces into key levels before continuing or changing structure.
What I’m watching now:
As long as the rising channel and demand zone hold, the overall structure remains intact. The next move will largely depend on how price reacts at this support, not on short-term volatility.
This is not a trade call, it’s an observation of market behavior and structure.
Disclaimer: This analysis is for educational purposes only and does not constitute financial advice. Trading involves risk.

XAUUSD – H2 Technical AnalysisXAUUSD – H2 Technical Outlook: Bullish Structure Rebuild as Precious Metals Surge | Lana ✨
Precious metals are back in focus as silver surges sharply, adding momentum to the broader metals complex. In this context, gold is showing signs of structure rebuilding after a healthy correction, setting the stage for potential continuation.
📈 Market Structure & Technical Context
After a strong impulsive drop, gold successfully defended the 4,420–4,450 strong support zone, where buyers stepped in decisively. Since then, price has been forming higher lows along an ascending trendline, signalling a shift from distribution into recovery.
The current price action suggests this move is corrective-to-bullish, not just a short-lived bounce.
🔍 Key Levels to Watch
Strong Support: 4,420 – 4,450
This zone remains the structural base. As long as price holds above it, bullish scenarios stay valid.
Mid Resistance / Reaction Zone: ~5,050 – 5,080
Price is currently consolidating here, absorbing supply after the rebound.
Next Resistance: ~5,135
A clean break and acceptance above this level would confirm continuation strength.
Upper Targets: ~5,300 – 5,350
Aligned with Fibonacci extensions and prior supply zones.
Higher Objective: ~5,580
Only in play if bullish momentum accelerates across the metals market.
🎯 Bullish Scenarios
If gold continues to respect the upper trendline and holds above the 5,000 psychological level:
A brief pullback into 5,000–5,050 could offer structure for continuation.
Acceptance above 5,135 opens the path toward 5,300+.
Strong momentum, supported by silver’s breakout, could extend moves toward 5,580.
Any pullbacks toward support are currently viewed as constructive corrections, not weakness.
🌍 Intermarket Insight
Silver’s sharp rally highlights renewed demand across precious metals, often acting as a leading signal for broader sector strength. This backdrop supports the idea that gold’s recent correction was a reset, not a reversal.
🧠 Lana’s View
Gold is rebuilding its bullish structure step by step. The focus is not on chasing price, but on how price reacts at key levels. As long as structure and momentum remain aligned, the broader trend stays constructive.
✨ Stay patient, respect the zones, and let the market confirm the next expansion.

XAUUSD (H3) – Liam PlanXAUUSD (H3) – Liam Plan
Safe-haven bid is back, but structure is still corrective | Trade the zones, not the headlines
Quick summary
Gold is up for a second day as US–Iran tensions revive safe-haven demand. At the same time, expectations for Fed rate cuts keep the USD on the defensive, which typically supports non-yielding assets like gold. However, with ADP and ISM Services PMI ahead, short-term volatility can spike fast — and that’s exactly where gold tends to run liquidity before choosing direction.
My approach: respect the macro tailwind, but execute based on structure.
Macro context
Gold usually benefits when:
geopolitical risk rises (risk-off flows),
rate-cut expectations increase (lower real yields),
the USD weakens or struggles to sustain a bounce.
That said, pre-data sessions often produce fake moves. The market will likely “test” both sides before committing.
Technical view (H3 – based on the chart)
Price rebounded sharply from the recent low, but the overall swing structure is still in a correction / rebalancing phase after a major impulse down.
Key zones on the chart:
Major supply / premium target: 5570 – 5580 This is the clear “sell reaction” zone if price expands higher.
Current decision area: around 5050 – 5100 Price is pushing back into a key mid-range level — where continuation must prove acceptance.
Deep demand / liquidity base: 4408, then 4329 If the market fails to hold higher supports, these are the next magnets for sell-side liquidity.
This is a classic: bounce → retest → decide environment.
Trading scenarios (Liam style: trade the level) Scenario A: Continuation bounce
If price holds above the current base and continues to reclaim levels:
Upside rotation can extend toward 5200 → 5400 → 5570–5580
Expect reactions near each resistance band, especially approaching premium.
Logic: safe-haven flows + softer USD can fuel continuation, but only if price accepts above the mid-range.
Scenario B: Rejection and rotation lower
If price fails to hold above 5050–5100 and prints rejection:
Expect a pullback back into prior demand
Deeper continuation opens toward 4408, then 4329
Logic: corrective rallies often redistribute before the next leg lower, especially around major data.
Execution notes
With ADP + ISM ahead, avoid chasing candles.
Wait for price to tag the zone and show a clear reaction.
Trade smaller if spreads widen.
My focus: If price accepts above the mid-range, I’ll respect the bounce. If it rejects, I’ll treat the move as a corrective rally and look for rotation lower. Either way, I’m trading levels — not headlines.
— Liam

SILVER1! : Volatility Contraction & Mean Reversion Analysis1. Context & Review (Linking the Past) In our previous analysis Silver Futures: Parabolic Breakdown , we correctly identified the "Bearish Liquidation" event that led to a -17% correction. As predicted, the parabolic arc was violated, and price sought liquidity lower.
2. Current Market Structure: The Snap-Back We are witnessing the aftermath. The market stabilized at the ~265k zone and is reacting with a strong +5% bounce. This aligns with standard Mean Reversion mechanics:
Oversold Conditions: The selling intensity stretched price too far from the average ("rubber band" effect).
Short Covering: Early bears are booking profits, fueling the initial bounce.
3. Technical Roadmap (The "New" Path)
The Gap Fill: The rapid drop left a liquidity void (Fair Value Gap) between 290k - 300k. Price naturally gravitates toward this magnet to "repair" inefficient price action.
The 0.382 Test: As mentioned in our previous "Dead Cat Bounce" scenario, we are watching the Fibonacci retracement levels. The current move is approaching the 0.382 resistance.
4. Technical Setup (Visible on Chart)
The "Orange Box" (Supply Zone): We have highlighted the 290k-300k zone as the "Line in the Sand."
Bullish Case: A daily close above 300k suggests this is more than just a dead cat bounce and opens the door to the Golden Pocket (0.618).
Bearish Case: Rejection at this Orange Box confirms the "Lower High" thesis, likely inviting a second leg down.
5. Volatility Analysis (TradeX View) Historical data confirms that after a >15% crash, volatility remains elevated for 2-3 weeks. We expect wide trading ranges rather than a straight V-shape recovery.
Strategy: Fade the extremes. Buy deep supports, sell the rip into resistance.
6. Conclusion The panic phase is over; the "reconstruction" phase has begun. We are currently neutral-bullish for a tactical bounce to the ~300,000 resistance area, but we remain cautious of the macro trend until that level is reclaimed.

BTCUSD ready for an upmoveWe noticed an order block in BTC and if the price comes back in the marked fair value gap we can plan a good buy trade.

BITCOIN at High-Timeframe Demand: Reaction Zone in Play!When I look at this chart, I’m not seeing fear or structural damage.
I’m seeing price doing exactly what it should do after a distribution phase , revisiting demand and slowing down.
Bitcoin has come back into a clearly marked high-timeframe demand / reaction zone . This is not a random level. This is an area where price has previously flipped structure and attracted strong participation.
What stands out to me on the chart:
Price is holding above a major high-timeframe support , not slicing through it. That tells me sellers are no longer aggressive at these levels.
The current zone is labeled as a planned accumulation area (not FOMO) . Price is reacting here instead of accelerating lower, that’s important.
Downside risk is clearly defined with a structure invalidation level below demand. As long as that level holds, structure remains intact.
Upside targets are logical and sequential , starting from a reaction high, followed by range expansion, and then higher-timeframe resistance.
The psychology behind this phase:
This is the part of the market where most people feel uncomfortable.
Price isn’t exciting. It’s not trending fast. It’s just… sitting.
But that’s usually how strong moves begin.
If Bitcoin were truly weak, it wouldn’t pause here, it would break cleanly below demand.
So far, it hasn’t.
That tells me the market is evaluating value , not panicking.
My approach here is simple:
I don’t chase price away from demand.
I don’t panic inside support.
I observe how price behaves at this zone and let the market show its hand.
As long as price holds above the demand zone, reactions from here remain valid.
Only a clean acceptance below the invalidation level would change this view.
Until then, this is a patience zone .
And patience, more often than prediction, is what gets paid in this market.
Disclaimer:
This analysis is for educational purposes only. Not financial advice. Always manage risk and trade according to your own plan.

XAUUSD (Gold) | TECAHNICAL LEVEL | 3rd FEB'2026Gold trades near 4,930, up +5.8%, with higher timeframes maintaining a bullish structure. Price is holding above the 100 & 200 EMA, while elevated volatility keeps intraday moves sharp. The 4,940–5,000 zone remains a key decision area.
Key Levels
Resistance: 4,990 | 5,080
Support: 4,840 | 4,700
Volatility Zones: Above 4,990 (expansion) | Below 4,840 (pressure)
USD data, Fed commentary, and bond yields remain the primary drivers today.
⚠️ Disclaimer: Educational content only. Markets are risky—manage risk wisely.

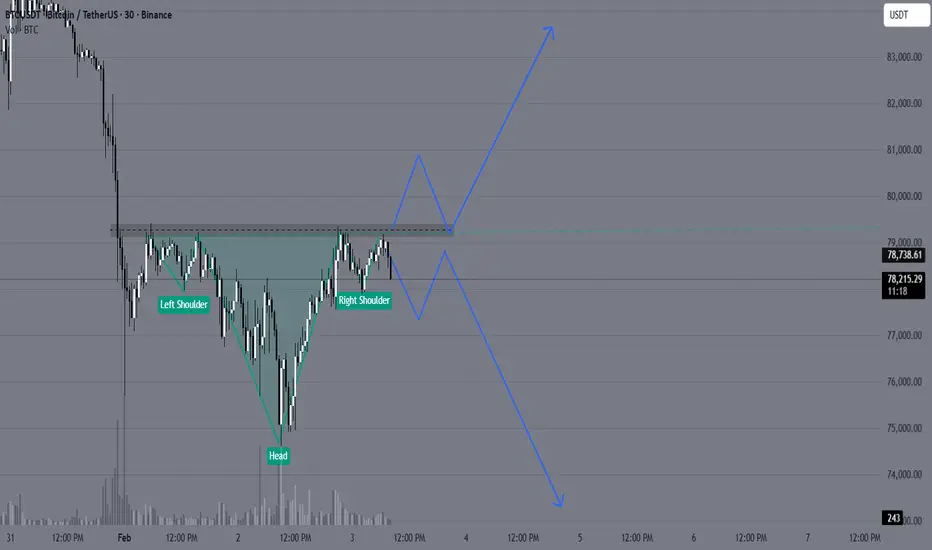
BTCUSD might give Structure Shift Now✅ Pattern: Potential Inverse Head & Shoulders
Look closely:
Left dip → around 76.8k
Deep dip (Head) → around 75k
Right dip → higher low near 76.5k
Now price is pushing back up
This is a classic reversal structure.
✅ Important Level: Neckline Resistance
The dotted zone you marked around:
79,000–79,200
That is the neckline / supply cap.
Price is repeatedly testing it.
📌 Until this breaks, structure is still “building.”
✅ Structure Type: Higher Low Creation
This is the most important:
Previous low = 75k
New low = ~76.2k
That means:
Higher Low → Early Bullish Shift
This is how reversals begin.
🚦What’s Needed for Confirmation?
Bullish Confirmation = Break + Close Above 79.2k
If BTC closes above that zone:
✅ Structure break
✅ Trend reversal likely
✅ Next targets:
80.5k
82k
84.4k (major resistance)
⚠️ Bearish Risk
If price rejects again and breaks below:
76.5k support
Then structure fails and BTC can revisit:
75k
73.8k
📌 Conclusion
BTC is creating a structure:
✅ Base + Range
✅ Higher Low
✅ Possible Inverse H&S
⏳ Waiting for neckline breakout
ETHUSD at a crucial support Forming Head and shoulder pattern✅ Pattern Forming: Inverse Head & Shoulders (Early Stage)
Look closely:
Left Shoulder → ~2300
Head (lowest point) → ~2180–2200
Right Shoulder → ~2250–2270
Price now pushing upward again
This is a classic bullish reversal structure.
✅ Key Resistance / Neckline Zone
Marked level around:
2380–2400
Price is currently struggling below this.
That is the neckline / supply barrier.
✅ Bullish Structure Confirmation
Breakout Confirmation = 1H Close Above 2400
If ETH closes above 2400 with volume:
✅ Structure break
✅ Trend shift begins
✅ Upside continuation likely
🎯 Targets After Breakout
Once breakout happens, next targets:
Target Level
Target 1 2494
Target 2 2600
Target 3 2700
🛑 Invalidation / Stop Loss Area
If ETH drops below:
2250 support
Then structure fails and price can revisit:
2200
2100 zone

Continuation of the Liquidity Grab concept I make educational content videos for trading, this will be a continuation of what happens after a liquidity grab in the markets
No Bias - No predications - only telling concepts and information on general trends of index

Symmetrical Triangle Masterpiece : Multi-Layout W,DtfStep into this dynamic multi-layout window opened right in front of you—a split-screen showcase of pure price action artistry.
Left Side: Weekly Timeframe
Here, a symmetrical triangle (a classic continuation or reversal pattern formed by two converging trendlines of equal slope) takes center stage. Framing it are a green uptrend line (connecting higher lows for bullish structure) and a red downtrend line (linking lower highs for bearish pressure), creating a tightening coil of market indecision. A subtle white counter-trend line (acting as dynamic support/resistance opposing the main trend) adds layers of geometric elegance, hinting at its heightened significance when viewed on lower timeframes.
Right Side: Daily Timeframe
Flipping to the daily chart reveals how this white line shines as a pivotal counter-trend barrier, interacting seamlessly with intraday swings. Multi-timeframe analysis (comparing higher timeframe structure with lower timeframe details for confluence) illustrates the fractal beauty......how weekly patterns cascade perfectly into daily price action without a single forecast or bias.
This is markets at their most poetic: old-school chart patterns and trendlines weaving symmetry across scales. No predictions, just appreciation for the elegance.
Disclaimer: This post is for educational and illustrative purposes only, highlighting historical price action and chart patterns. It does not constitute financial advice, trading recommendations, or predictions of future market movement. Always conduct your own research and consult a professional advisor
