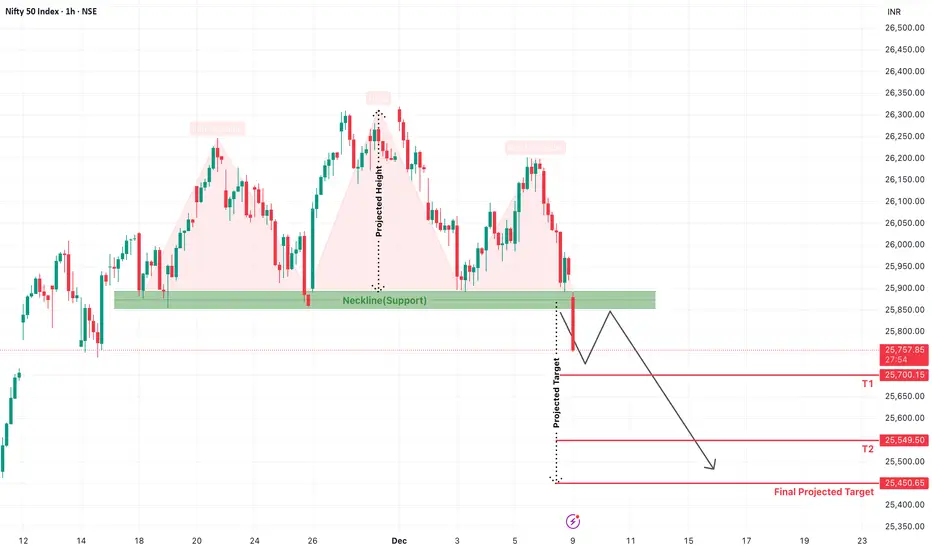
Nifty 50 Forms a Bearish Head & Shoulders PatternThe Nifty 50 index has officially broken below a crucial support zone, completing a classic Head & Shoulders reversal pattern on the 1-hour chart. This bearish structure normally appears at the top of an uptrend and indicates a potential trend reversal — and that’s exactly what the current setup suggests.
Key Technical Highlights
The Left Shoulder, Head, and Right Shoulder are clearly visible.
Nifty attempted multiple bounces from the Neckline support zone (around 25,850–25,900) but failed to sustain.
Today’s clean breakdown below this neckline confirms the reversal pattern.
According to the projected height method, Nifty may extend its decline towards the following levels:
Downside Targets
T1: 25,700
T2: 25,549
Final Projected Target: 25,450
What to Expect Next?
A short pullback or retest of the neckline is possible, which may attract sellers again. As long as Nifty trades below the neckline zone, the bias stays bearish and deeper corrections remain likely.
Technical Analysis
#NIFTY Intraday Support and Resistance Levels - 09/12/2025Nifty is expected to open slightly gap-down today, indicating mild selling pressure at the start of the session as the index continues to trade near the lower end of its consolidation range. A slightly gap-down opening suggests that the market sentiment remains cautious, with sellers still showing strength around resistance zones. If the index slips below 25950 after opening, the short setup becomes active with downside targets of 25850, 25800, and 25750-. A breakdown below 25750 may further extend weakness, potentially dragging Nifty toward deeper support levels, especially if global cues remain negative.
On the upside, any recovery from lower levels will need to sustain above 26050 to activate the long setup, with upside targets of 26150, 26200, and 26250+. A stable move above this zone will indicate that buyers are attempting to reclaim control and push the index out of the consolidation zone. However, until a breakout above 26050 occurs, the momentum is likely to stay muted or choppy.
Overall, with a slightly gap-down opening expected, the early bias remains mildly negative. The first hour will be crucial in deciding whether Nifty extends its downward momentum or attempts a pullback from the lower support band. Traders should monitor the breakout and breakdown levels closely, as a decisive move beyond these zones will determine the intraday trend.

[INTRADAY] #BANKNIFTY PE & CE Levels(09/12/2025)Bank Nifty is expected to open with a gap-down today, indicating early selling pressure and a continuation of the weakness seen in the previous session. A gap-down near the lower support zone suggests that bears may attempt to drive prices further down if immediate recovery does not appear. If the index slips below 58950 after opening, the selling setup gets activated with downside targets of 58800, 58700, and 58550-. A sustained break below 58450 could lead to deeper weakness, pushing the index toward the next major support zone around 58050.
On the upside, any recovery attempt will only gain momentum if Bank Nifty moves above the 59050–59100 range, where the buying setup becomes active with upside targets of 59250, 59350, and 59450+. Stronger bullishness will come only if the index crosses and sustains above 59550, opening further targets at 59750, 59850, and 59950+. This would indicate that buyers have absorbed the gap-down weakness and regained short-term control.
Until then, the bias remains slightly negative due to the expected gap-down opening, and price action around the first support levels will determine whether the day develops into a trend-continuation decline or a reversal attempt. Traders should watch the opening candle carefully, as volatility may be elevated during the initial minutes.

Maruti - Compression Setup Near Resistance💹 Maruti Suzuki India Ltd (NSE: MARUTI)
Sector: Automobiles | CMP: 16187 | View: Compression Setup Near Resistance
STWP Support & Resistance – MARUTI
Resistances: 16264 | 16311 | 16426
Supports: 16102 | 16017 | 15940
While the above levels highlight the nearest technical markers, the chart shows that the broader resistance band between 16264–16426 is relatively weak, marked by shallow rejection wicks and limited seller follow-through, suggesting only mild supply overhead. On the downside, the support pockets around 16102–16017 and the deeper zone near 15940 appear structurally stronger, backed by prior accumulation and repeated stabilization attempts that show institutional interest absorbing dips. This configuration reflects a market in compression near resistance, where buyers are defending declines but have yet to demonstrate strong breakout conviction; sustained movement above 16264 may improve momentum, while failure to hold 16017 could shift short-term control back to sellers.
STWP Volume & Technical Setup – MARUTI
MARUTI continues to display a tightly coiled structure, reflecting clear price compression and controlled volatility as the stock trades within a contracting range after a series of higher-lows and overlapping candles. The volume profile remains within normal distribution, with no abnormal spikes, signalling that institutional participation has been steady but not aggressive. Momentum indicators show a mixed landscape — RSI stabilizing in the mid-zones, MACD maintaining a neutral-to-slightly positive crossover profile, and CCI oscillating around its mean — collectively suggesting that the stock is preparing for a decisive move rather than trending with strength. Compression metrics, such as narrow-body candles and tightening ranges, indicate that liquidity is positioning but not yet committed, while the BB bands remain moderately tightened, hinting at a potential volatility expansion trigger. Despite this consolidation, the broader structural undertone leans mildly bullish, supported by the trend strength seen in prior legs and the stock’s ability to hold above key support pockets even after intraday profit-booking phases. Overall, MARUTI’s setup resembles a pre-breakout equilibrium phase where buyers and sellers are evenly matched, and a clean breakout or breakdown candle will determine the next directional impulse.
STWP Summary View
Final Outlook: Momentum: Developing|Trend: Mildly Bullish|Risk: Moderate|Volume: Normal
The overall MARUTI derivatives landscape reflects a broadly bearish environment observed across intraday, short-term swing, volatility, buildup, ATM structure, strategy alignment, smart-money behaviour and straddle characteristics, where the prevailing trend remains down and sentiment stays negative, with an STWP Edge Score of 6.4/10 indicating a moderate yet structured setup that requires disciplined sizing rather than aggressive positioning. The frequently referenced strike throughout the analysis is the 16200 level, where the PUT (delta -0.46) recorded an LTP of 229.15 after a 19.63% gain, supported by volume expansion of 15.5% to 6363 contracts and a mild IV rise to 16.2%, while open interest dropped sharply by 26.5% (-24,450 contracts), creating a short-covering signature that often reflects trapped participants exiting positions as prices shift. These dynamics form part of a broader mixed-to-moderate structural zone where the option behaves closer to futures because of its delta profile, giving smoother directional sensitivity with controlled convexity. The intraday and swing illustrations revolve around defined levels such as the entry around 229.15, a protective threshold at 194.78 and reference targets near 280.71 and 297.89, used purely to demonstrate risk structuring and reward modelling practices in an academic context. Volatility sits in a balanced band, with average IV near 15.65%, a high of 18.69% at the 15000 PUT and a low of 13.97% at the 16000 CALL, creating an environment where different option structures behave differently depending on how implied volatility evolves. The buildup distribution further reinforces the bearish tilt seen in derivatives behaviour: the CALL side held moderate short build-up and long unwinding, whereas the PUT side displayed strong short-covering activity supported by minor long additions, highlighting pressure points and exhaustion pockets in the flow. The ATM strike at 16200 acts as the central sensitivity zone with the CE at 253.75 (delta 0.55, IV 14.31%) and the PE at 229.15 (delta -0.46, IV 16.22%), helping market participants understand how gamma, delta shifts and volatility behaviour influence intraday reactions. Broader strategy illustration shows how trend strength, call-side dominance in flows, a mid-range IV environment and a PCR of 0.66 combine to form a generalized bearish framework, while the Smart Money Heat assessment indicates about 36% bearish momentum derived from long build-up, short build-up, short-covering and unwinding activity across liquid strikes; liquidity metrics such as a median OI of 88750 and a median volume of 3380 provide context for depth and participation. The straddle analysis at the 16200 strike shows a combined premium of 2.98% against an expected move of 3.83%, an average IV band of 15.27%, a near-flat net delta of 0.09, a symbol-level PCR of 0.78 and a max pain level anchored at 16200, illustrating how volatility expectations, premium richness, delta neutrality and positioning pressures interact. Collectively, these elements present a comprehensive educational study of how trend, volatility, open interest behaviour, buildup distribution, gamma-zone dynamics, straddle structure and flow-based sentiment can be read together as part of an institutional-style analytical exercise, without forming any investment advice or trade recommendation of any kind.
⚠️ STWP Legal Disclaimer
This document is strictly for educational and informational purposes. All examples, charts, levels, and option structures discussed are illustrative and are not intended as buy, sell, or hold recommendations. STWP does not provide investment advice, trading tips, signals, or personalized financial guidance of any kind, nor is it a SEBI-registered intermediary or research analyst. The analyses, illustrations, and risk–reward structures included here are generic in nature and based on publicly available data and observed market behaviour, which may change without notice. Financial markets involve significant risk; derivatives in particular carry the potential for substantial losses. Option premiums, implied volatility, open interest, delta, and other market variables can fluctuate rapidly and unpredictably.
Readers are solely responsible for their trading decisions, capital management, and risk assessment. Before making any investment or trading decision, please consult a SEBI-registered investment advisor. STWP, its representatives, and affiliates shall not be liable for any direct or indirect loss arising from the use of this material. Historical patterns or past market behaviour do not guarantee future outcomes, nor should any part of this document be interpreted as a promise of performance, accuracy, or returns.
Position Status: No active position in this instrument at the time of analysis.
Data Source: TradingView & NSE India.
💬 Found this useful?
🔼 Boost this post to support structured learning
✍️ Share your thoughts or questions in the comments
🔁 Forward this to traders who value clean technical studies
👉 Follow for disciplined, structured, STWP-style analysis
🚀 Stay Calm. Stay Clean. Trade With Patience.
Trade Smart | Learn Zones | Be Self-Reliant 📊

Nifty 50 Price Structure Analysis [09/12/2025: Tuesday] Top-Down Nifty 50 price structure analysis for 09th December 2025. The day is Tuesday.
(1) Monthly Time Frame:
Red indecisive candle. Major resistance is at level 26100. Minor support is at level 25900. The view is indecisive to bearish.
(2) Weekly Time Frame:
First day of the week. Today's red candle confirms that last week's red paper umbrella was a hanging man. Clear sign of trend reversal. Major resistance is at level 26100. Minor support is at level 25900. The view is bearish.
(3) Daily Time Frame:
It's kind of a red morubozu with a minor 50 points lower wick. The candle engulfed the last 2 days of green candles. A major resistance zone is formed at the levels 26100 - 26000. Minor support is at level 25900. The view is bearish.
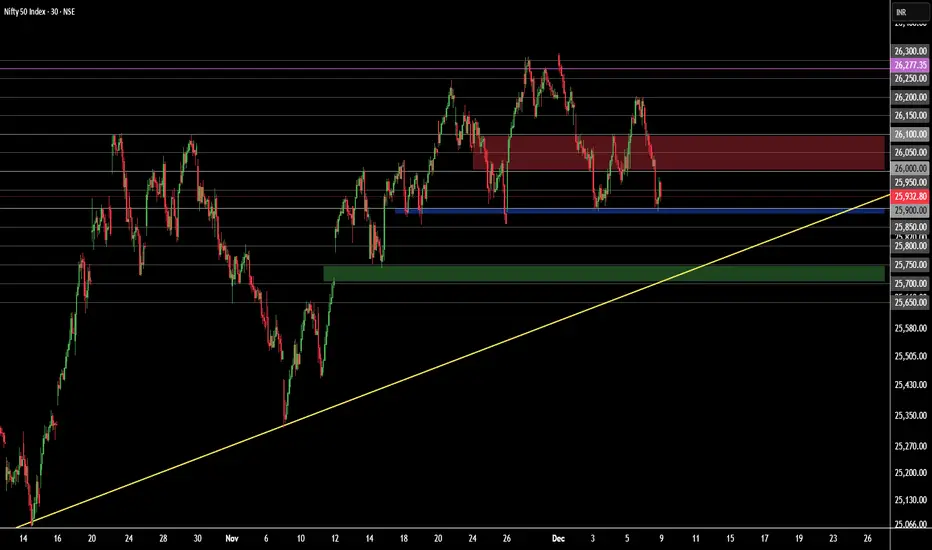
(4) 30-Minute Time Frame:
Two trend reversal patterns are observed. The first pattern is head & shoulder (H&S). The second pattern is a triple top. It's a clear sign of trend reversal. The neck of both the H&S and triple top is formed at the level 25900. A major resistance zone is formed at the zone 26100 - 26000. Minor support is at level 25900. Every up move should be doubted. The view is bearish.
Events:
Nifty 50 weekly expiry. No other high-impact event. However, a major event is on 12 December - the FED interest rate decision. Thus, volatility is expected.
Bullish Scenario Set-Up:
(i) Price sustains above the opening price.
(ii) Price sustains above the level 26100.
Bearish Scenario Set-Up:
(i) Price sustains below the opening price.
(ii) Price sustains below the level 25900 and shows promise of breaking below the level 25850.
(iii) Bearish target is in the zone (25750 - 25700)
Expectations (Hypothesis and Insights from the Trading Plan):
(i) Take a bearish position only. Price must break the level 25900 and show promise of trading below the level 25850.
(ii) Doubt every up move.
(iii) Take no bullish trade until the price starts to trade above the level 26000 - 26100.
(iv) There is a higher probability of breaking down (bearish trend continuation).
(v) After price breaks below the level 25850, there is a higher chance that the price will try to fill the gap in the zone 25750 - 25700.
(vi) Its expiry day. So, expect uncertain price movement in the second half.
(vii) It may happen that bulls might try to expire price above the level 26000 by the end of the day.
(viii) Trade only when bullish/ bearish conditions are fulfilled. Otherwise, don't trade. Protect your resources.
NOTE:
"Mark your points. Trade your points. Price is God. Anything can happen. Therefore, trade what you see, not what you believe."
Happy Trading!
Nifty 50 Price Structure Analysis [08/12/2025: Monday]Top-Down Nifty 50 Price Structure Analysis for 08th December 2025. The day is Monday.
(1) Monthly Time Frame:
Red paper umbrella candle. The body is smaller compared to the lower wick. So far, it is an indecisive market. The main trend is bullish, but the present scenario is indecisive. The major support zone is at 26100 and 26000. Major resistance is at 26300. The view is bullish to indecision.
(2) Weekly Time Frame:
Red paper umbrella candle. The body is smaller compared to the lower wick. There is no upper wick. Thus, there is good buyer participation. Looking at the combination of 3 candles, buyers (or bulls) are getting stronger. The lower wicks are getting longer every week. For the past 3 weeks, the price has been taking very good support at the zone (25850 - 25900). In the present scenario, levels 26100 and 26000 are major support zones. Major resistance is at 26300. Considering, past 8 weeks, the price is in the structure of higher highs and lower lows. Thus, bullishness is intact. Take no bearish trade until the price starts to trade below the zone of 26100 - 26050. Presently, the view is bullish to indecision. If the price keeps sustaining above the level 26200, then probably, the previous all-time high (ATH) will be breached.
(3) Daily Time Frame:
The past 2 days are green days. On 05th December price gave a 200-point bullish rally. However, price is still in the range of the bullish marubozu formed on 26th November (Wednesday). Price needs a stable movement above the level 26200. Presently, 3 levels have emerged as a strong support zone - 26100, 26050, and 26000. So, take no short position unless the price starts to trade below 26000. Any downward move should be doubted. The view is bullish to indecision as the previous ATH and level 26300 are very close.
(4) 30-Minute Time Frame:
The complex correction since 17th October 2025 continues. Presently, price is trying to trade in the upper zone of the rising channel. The direction of the complex correction is bullish but with high volatility and indecisive moves. A strong support zone is formed at the levels 26100 - 26000. A minor resistance is at 26200. Major resistance is at 26300 and the previous ATH (26277.35). Every down move should be doubted. Institutional bias is bullish. The view is bullish.
Event:
No expiries on Monday. No high-impact event. However, the U.S. Fed Interest Rate Decision is on 11th December (Thursday) - a high-impact event in the next week.
Bullish Scenario Set-Up:
(i) Price sustains above the opening price.
(ii) Price sustains above the level 26200 and shows promise of reaching levels 26277.35 (ATH) and level 26300.
Bearish Scenario Set-Up:
(i) Price sustains below the opening price.
(ii) Price starts to sustain below the level 26050 and starts to form a lower lows, lower highs structure below 26000.
No Trading Zone (NTZ): 26200 - 26100.
Expectations (Hypothesis and Insights from Trading Plan):
(i) Take bullish trades only. Price must start to trade above the level 26200.
(ii) Every down move should be doubted. Levels 26100 - 26050 are very strong support.
(iii) Be skeptical of executing trades in the first half of Monday, as level 26277.35 (previous ATH) and level 26300 are close. Also, in case of a gap up or a gap down, be very cautious. A clear price structure is needed for trend clarity.
(iv) Trade only when bullish/ bearish conditions are fulfilled. Otherwise, don't trade. Protect your resources.
NOTE:
"Mark your points. Trade your points. Price is God. Anything can happen. Therefore, trade what you see, not what you believe."
Happy Trading!

NIFTY 50 – Near All-Time High | Breakout or Pullback? Chart Analysis 📈 (Weekly + Daily Analysis)
Nifty50 is trading close to its All-Time High zone around 26,350–26,400, showing strong bullish structure visible clearly on the Weekly timeframe with consistent Higher Highs & Higher Lows. Trend remains intact with no signs of major reversal yet.
Weekly Key Levels
Major Resistance: 26,350 – 26,500
Immediate Support: 25,950 – 26,000
Key Swing Support: 25,600
Major Trend Support: 24,900 – 25,100
Daily Observation
Price is consolidating near the resistance zone.
Volume is slightly decreasing → indicating a possible momentum slowdown
If price breaks above 26,400 with volume, a fresh breakout can lead to a strong continuation rally.
Breakout & Downside Scenarios
🟢 Bullish Breakout Above 26,400
Target Levels: 27,200 / 27,500
🔻 Pullback Scenario
First support: 26,000
Deeper support: 25,600
Market View
Long-term trend remains bullish
Short-term consolidation or mild pullback possible
Watch price reaction around 26,350–26,400 zone for next move confirmation
Summary
Nifty is at a decision point. A breakout above 26,400 can trigger a strong upside continuation, while a rejection can bring a healthy correction towards 26,000–25,600. Trend remains positive as long as the index holds the weekly support of 25,600.

Nifty 50 Price Structure Analysis [05/12/2025: Friday] Top-Down Nifty 50 Price Structure Analysis for 05th of December 2025. The day is Friday.
(1) Monthly Time Frame:
Red inside candle. Highly indecisive market. Indecision is due to the price's nearness to the all-time high (ATH). Major resistance is at level 26300. Major support is in the zone (25900 - 25850). The view is indecision.
(2) Weekly Time Frame:
Red inside candle with minor buying support from the zone (25900 - 25850). Probably, level 26000 will also become a support if the price sustains far above 26000. The immediate resistance zone is (26150 - 26100). Price trading above the zone (26150 - 26100) will only be considered bullish sentiment this week. The view is indecision.
(3) Daily Time Frame:
A green spinning top is formed. The candle is inside the previous day. Taking into consideration the price, the structure is consolidating in the range of 26150 - 252900. However, the green spinning top is formed at the end of the 3-day fall. Maybe it is a sign of reversal. Bullish sentiment can be confirmed if the price starts to trade above the level of 26100. Presently, the major support zone is at (25900 - 25850), and the major resistance zone is (26150 - 26100). Also, the market is highly indecisive. The identified no trading zone (NTZ) is (26100 - 25900). The view is indecision.
(4) 30-Minute Time Frame:
The complex correction in the broader market range still continues. Today is a perfect non-directional and choppy day. Major support (or buying) zone is (25900 - 25850). The major resistance zone is (26150 - 26100). No trading zone (NTZ) is (26100 - 25900). The view is indecision.
HIGH IMPACT EVENT:
No expiries on Friday. However, there is a high-impact event - "RBI Interest Rate Decision" at 10:00 A.M. Also, it is the last day of the week.
Bullish Scenario Set-Up:
(i) Price sustains above the opening price.
(ii) Price starts to form a higher highs and higher lows structure above the level 26100.
Bearish Scenario Set-Up:
(i) Price sustains below the opening price.
(ii) Price starts to form a lower lows and lower highs structure below the level 25900.
No Trading Zone (NTZ): (26100 - 25900).
Expectations (Hypothesis and Insight from Trading Plan):
(i) Market structure is highly indecisive.
(ii) Do not execute trade in the identified NTZ (26100 - 25900).
(iii) Take bullish trade only when price starts to form a higher highs and higher lows structure above 26100. However, upside is also very difficult as there are multiple resistances above. Also, ATH and 26300 are above. The market needs a strong bullish force to sustain bullishness.
(iv) Take bearish trade only when price starts to form a lower lows and lower highs structure below the level 25900. In case, price breaks down the level 25850, then be prepared to heavily short the market.
(v) Think of trading only after 10:00 AM when the market has finally interpreted the RBI interest rate decision.
(vi) Trade only if conditions are fulfilled. Otherwise, avoid trading.
NOTE:
"Mark your points. Trade your points. Price is God. Anything can happen. Therefore, trade what you see, not what you believe."
Happy Trading!

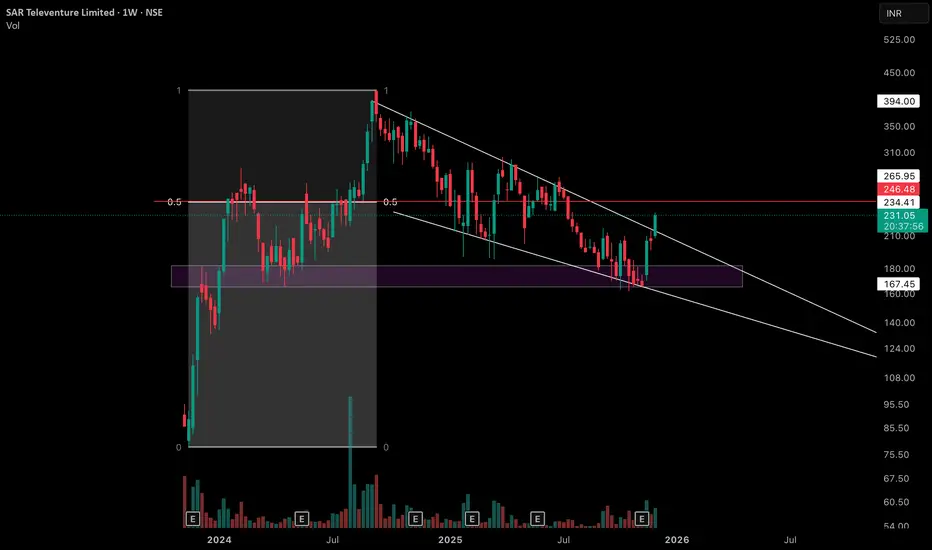
Weekly Equilibrium at Former Supply Zone with 4 observationsObservation 1 - On this weekly chart of SAR Televenture Limited, price has created an interesting equilibrium between the major swing low and the all‑time high swing high, with the 0.5 level highlighted by the red horizontal line as a key mid‑point reference.
Observation 2 - The purple zone marked on the chart was earlier a clear supply / resistance area but has now flipped into a support zone, getting respected multiple times over the past several weeks.
Observation 3 - After printing its all‑time high, price has moved into a sequence of lower highs and lower lows, but each leg has remained relatively controlled instead of showing any one‑sided, sharp liquidation move. This creates a broader consolidation structure where volatility is present yet contained.
Observation 4 - The white lines on the chart represent the upper and lower rejection boundaries of this consolidation channel, and most of the recent candles are developing within these two lines.
Disclaimer: This post is purely for educational and informational purposes, intended to study price structure and market behavior on the weekly timeframe. It is not investment advice or a recommendation to buy or sell any security; traders and investors should do their own research and consult a registered financial professional before making any decisions.
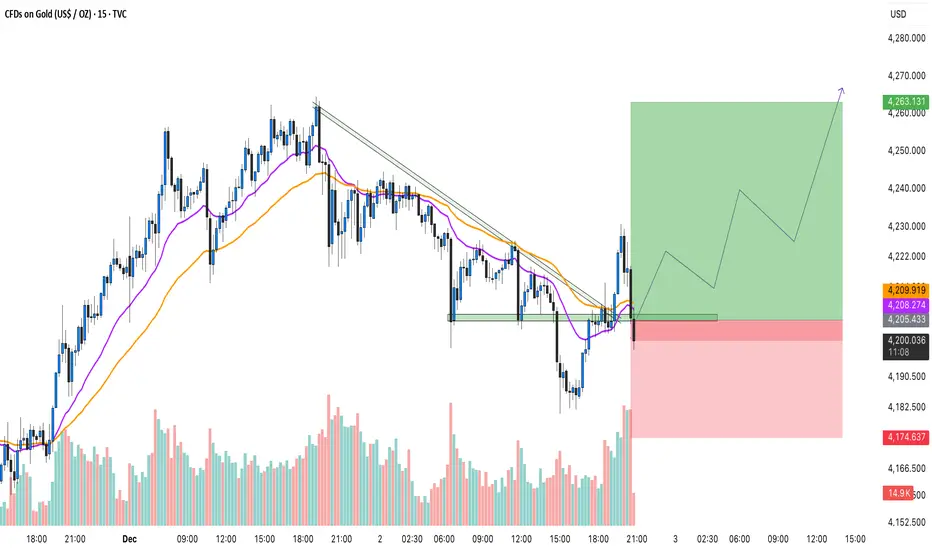
Gold Breaks Trendline – Bulls Back in Control!Hello Everyone let's analyse Gold as it has broken above its falling trendline resistance, signaling a possible shift from short-term weakness to bullish momentum. After several attempts, the price finally managed to close above the trendline with increasing volume, showing that buyers are stepping in again.
Currently, Gold is retesting the previous resistance turned support zone around $4200–$4205. As long as price holds above this level, the structure remains positive, and the next upside targets could be seen toward $4260–$4270.
Short-term traders can look for confirmation candles near support before entering. A clean retest followed by bullish continuation can offer a good risk–reward setup. On the other hand, if the price breaks back below $4190, momentum could slow down again.
Disclaimer: This analysis is for educational purposes only and should not be taken as financial advice. Please do your own research or consult your financial advisor before investing.
Analysis By @TraderRahulPal | More analysis & educational content on my profile.
If you found this helpful, don’t forget to like and follow for regular updates.
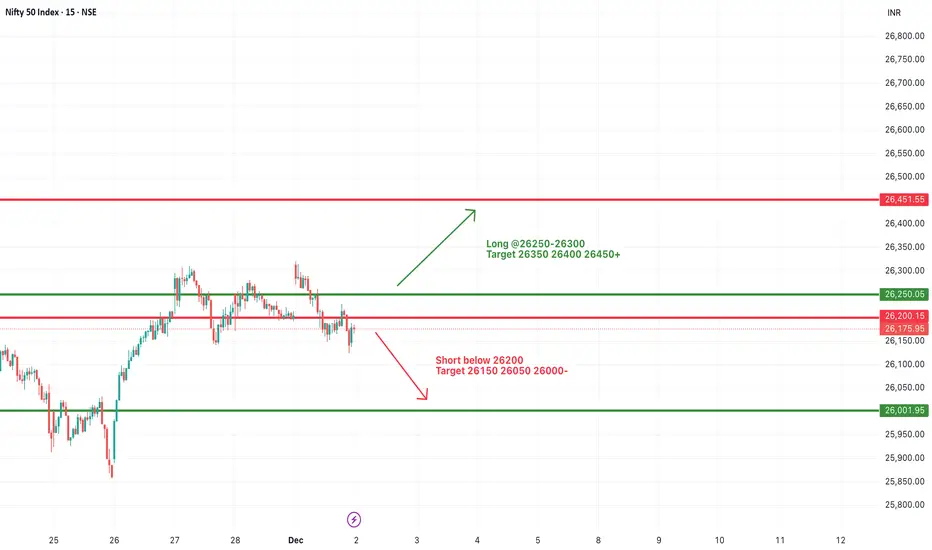
#NIFTY Intraday Support and Resistance Levels - 02/12/2025Nifty is expected to open flat today, indicating a neutral start as the index continues to move within a tight range after recent sideways sessions. A flat opening near the midpoint of the structure suggests that the market is waiting for a clear directional trigger before committing to a strong move. On the upside, if the index sustains above the 26250–26300 zone, the long setup becomes active with upside targets of 26350, 26400, and 26450+. A breakout above 26450 can further extend bullish momentum toward the next significant resistance at 26500 and potentially higher levels if the buying interest strengthens.
On the downside, immediate weakness will only be confirmed if Nifty breaks below the 26200 level, which activates the short setup with downside targets of 26150, 26050, and 26000-. A break below this zone would indicate a continuation of the selling pressure that has appeared near the top of the consolidation structure. If the index slips further toward the 26000 support band, lower levels may come into focus, especially if broader sentiment remains weak.
Overall, with a flat opening expected, the market may remain range-bound during the initial hour until a decisive breakout or breakdown occurs from the key levels. Traders should be cautious during the early session, as the market may show choppy movements before establishing a clear trend for the day.
[INTRADAY] #BANKNIFTY PE & CE Levels(02/12/2025)Bank Nifty is expected to open flat today, indicating a neutral and indecisive start as the index continues to trade inside a tight consolidation band. This flat opening reflects that the market is waiting for a clear trigger before making any strong directional move. If the index sustains above the 59550–59600 breakout zone after opening, bullish momentum may pick up, activating the buying setup with upside targets of 59750, 59850, and 59950+. A sustained move beyond 60050–60100 will be a stronger signal of trend continuation, opening the doors for higher targets at 60250, 60350, and 60450+. Such a breakout would confirm that buyers have regained control and are willing to push prices toward the upper zones.
On the downside, if Bank Nifty fails to hold above immediate support and slips below the 59950–59900 zone, it will signal early weakness and activate the selling opportunity with downside targets of 59750, 59650, and 59550-. A further decline below 59450–59400 would indicate deeper selling pressure, opening extended downside targets of 59250, 59150, and 59050-. This would also confirm that the consolidation breakdown has strengthened seller dominance.
Overall, with a flat opening, the first hour of price action will be crucial. The market is likely to remain range-bound unless a clear breakout or breakdown occurs. Intraday traders should watch the key trigger levels closely, as a decisive move above or below these zones will determine whether the market continues its sideways structure or transitions into a trending phase.

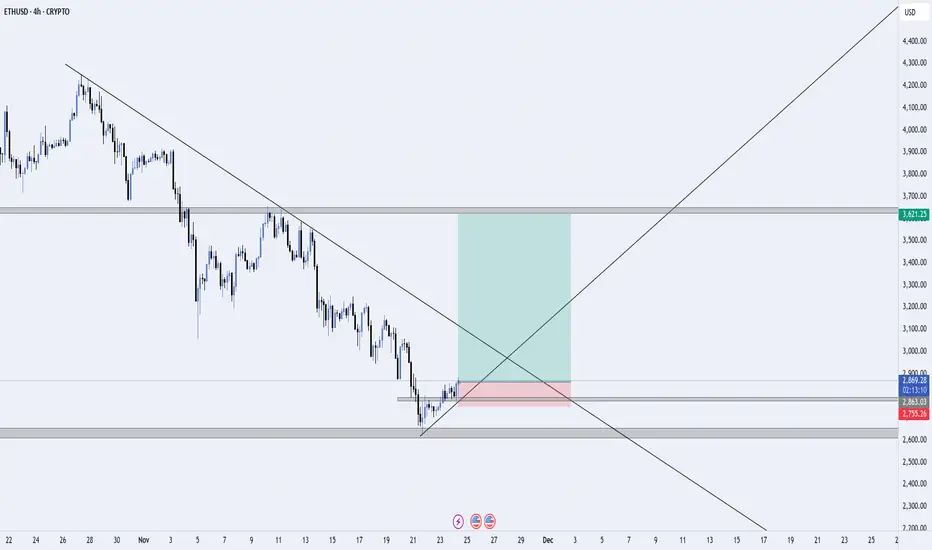
ETH/USD – Trendline Breakout Attempt from Higher-Timeframe DemanETH/USD is reacting strongly from a major 4H demand zone after an extended downtrend. Price has tapped into a high-volume area between $2,760–$2,800, showing the first signs of bullish strength with a clean internal structure shift.
📌 Setup Overview
Price respected a long-term descending trendline, but buyers stepped in strongly at the higher-timeframe demand zone.
A short-term structure break (BOS) suggests a potential reversal beginning to form.
Market is now retesting the broken structure + mini demand zone, where buyers are likely to defend.
🎯 Trade Plan
Entry: After the retest confirmation of the minor demand zone.
Stop-loss: Below the demand area to protect against liquidity sweeps.
Target: The next major supply zone around $3,600, aligning with the larger structure and trendline interaction.
📈 Bias
Bullish short-term — expecting continuation to the upside if price holds above the retest zone.
Structure suggests a potential mid-term trend reversal if buyers maintain control.
❌ Invalidation
Idea becomes invalid if price closes below the demand zone and breaks structure to the downside.
[INTRADAY] #BANKNIFTY PE & CE Levels(01/12/2025)Bank Nifty is expected to open with a gap-up today, indicating early bullish sentiment as the index holds firmly above its recent consolidation range. If the market sustains above the 59550–59600 zone after opening, the buying setup becomes active with targets of 59750, 59850, and 59950+. A continuation of strength above this level can push price toward the next major resistance around 60050–60100, where a fresh breakout may extend the rally toward 60250, 60350, and even 60450+.
On the downside, weakness will only be confirmed if the index slips below the 59950–59900 zone, opening the selling opportunity with targets at 59750, 59650, and 59550-. Further selling pressure will activate only if Bank Nifty breaks below 59450–59400, where deeper targets of 59250, 59150, and 59050- come into play. With a gap-up opening, the initial bias remains positive, but sustained momentum above the breakout zones will be crucial for a clean upside move.

M&M - Bullish Momentum Near Resistance💹 Mahindra & Mahindra Ltd (NSE: M&M)
Sector: Automobiles | CMP: 3757.30 | View: Bullish Momentum Near Resistance
Chart Pattern: Ascending Structure with Resistance Retest
Candlestick Pattern: Strong Bullish Candle
Swing High: 3781
Swing Low: 3393
STWP Trade Analysis:
Bullish Breakout Level: 3781
Stop Loss: 3661.70
Momentum: Strong
Volume: High, above-average participation
M&M has printed a strong bullish candle directly into the resistance zone near 3780, supported by above-average volume and a steady rise from the demand levels around 3400–3500. The structure reflects a clean ascending formation, where buyers have defended every dip and carried the stock back into the upper supply band. The latest candle shows a decisive shift in tone, with momentum favouring bulls as the stock attempts a breakout continuation.
Resistances:
3787.43 | 3817.57 | 3866.23
Supports:
3708.63 | 3659.97 | 3629.83
STWP Stock Analysis:
Final Outlook:
Momentum: Strong | Trend: Neutral-to-Bullish | Risk: Moderate | Volume: High
M&M is showing strong follow-through strength from the recent swing low, reflecting renewed buying interest. RSI is balanced and gradually rising, Stochastic is turning upward from mid-levels, and MACD histogram shows improving momentum — all pointing toward a possible continuation if price sustains above the 3700 support band.
The price structure also aligns with a VCP-style contraction, where volatility has gradually tightened after each pullback. Today’s bullish candle marks an attempt at the first expansion leg into the resistance zone.
Volume remains healthy, and EMA compression is visible, signalling potential for a momentum release if the stock pushes cleanly above 3780–3818. The underlying trend remains neutral but improving, supported by a broad base built over the past weeks.
Watch for dips:
Minor pullbacks toward 3708–3659 can act as healthy retest zones, offering secondary opportunities in case of a delayed breakout.
Overall, M&M stands as a potential swing candidate, backed by strong momentum, improving volume behaviour, and a well-defined breakout structure forming near its upper resistance zone.
⚠️ STWP Legal Disclaimer
This document is strictly for educational and informational purposes. All examples, charts, levels, and option structures discussed are illustrative and are not intended as buy, sell, or hold recommendations. STWP does not provide investment advice, trading tips, signals, or personalized financial guidance of any kind, nor is it a SEBI-registered intermediary or research analyst. The analyses, illustrations, and risk–reward structures included here are generic in nature and based on publicly available data and observed market behaviour, which may change without notice. Financial markets involve significant risk; derivatives in particular carry the potential for substantial losses. Option premiums, implied volatility, open interest, delta, and other market variables can fluctuate rapidly and unpredictably.
Readers are solely responsible for their trading decisions, capital management, and risk assessment. Before making any investment or trading decision, please consult a SEBI-registered investment advisor. STWP, its representatives, and affiliates shall not be liable for any direct or indirect loss arising from the use of this material. Historical patterns or past market behaviour do not guarantee future outcomes, nor should any part of this document be interpreted as a promise of performance, accuracy, or returns.
Position Status: No active position in this instrument at the time of analysis.
Data Source: TradingView & NSE India.
💬 Found this useful?
🔼 Boost this post to support structured learning
✍️ Share your thoughts or questions in the comments
🔁 Forward this to traders who value clean technical studies
👉 Follow for disciplined, structured, STWP-style analysis
🚀 Stay Calm. Stay Clean. Trade With Patience.
Trade Smart | Learn Zones | Be Self-Reliant 📊

Gold (XAUUSD)15-Min Chart Update | Support Zone Holding StronglyHello guys, Gold continues to respect its rising channel structure, moving between the rising support and resistance trendlines. After a minor correction, the price has once again bounced from the rising support trendline, showing strong buying interest near the lower boundary of the channel.
This area around $4145–$4150 is acting as a short-term support zone, and as long as price stays above it, the bias remains bullish. A continuation of this move could push Gold higher toward the upper channel resistance near $4180–$4185.
On the other hand, a clear breakdown below this support zone may trigger a quick pullback toward $4130–$4120, where fresh buying could appear again. Overall, the structure remains positive, and buyers are defending the support well.
Disclaimer: This analysis is for educational purposes only and should not be taken as financial advice. Please do your own research or consult your financial advisor before investing.
Analysis By @TraderRahulPal | More analysis & educational content on my profile.
If you found this helpful, don’t forget to like and follow for regular updates.

#NIFTY Intraday Support and Resistance Levels - 28/11/2025Nifty is expected to open with a slightly gap-up start today, reflecting a mild bullish tone as the market attempts to build on the recent recovery. The price is hovering near a crucial structure zone, and holding above the 26250–26300 range will be essential for sustaining upward momentum. If Nifty manages to remain stable above this breakout area after the opening, the long setup becomes active, targeting 26350, 26400, and 26450+. A strong continuation move above 26500 can further accelerate the upside, potentially pushing the index toward the higher targets of 26650, 26700, and even 26750+, especially if broader sentiment supports the move.
On the downside, any weakness will only be confirmed if the index faces rejection from the 26250–26200 zone, where a reversal short opportunity opens up. This downside structure carries immediate targets at 26150, 26050, and 26000-, indicating that sellers may try to reclaim short-term control if Nifty fails to hold the breakout region. Until then, the bias remains moderately positive due to the slightly gap-up opening, and intraday direction will largely depend on how price behaves around these key reaction levels.

[INTRADAY] #BANKNIFTY PE & CE Levels(28/11/2025)Bank Nifty is expected to open flat today, indicating a neutral start with no immediate directional push from buyers or sellers. If the index sustains above the 59550–59600 zone, the buying setup becomes active with upside targets of 59750, 59850, and 59950+. A further breakout above 60050–60100 can continue the bullish momentum toward 60250, 60350, and 60450+.
On the downside, any weakness will be confirmed only if Bank Nifty slips below the 59450–59400 level, which will activate the reversal setup with downside targets of 59250, 59150, and 59050-. Since the opening is flat, the initial movement may remain range-bound, and a decisive break above or below key levels will determine the intraday trend.

ICICIBANK - Inverted Head & Shoulder suggests 1450ICICI Bank has completed a clean Inverted Head and Shoulders pattern on the 4H chart, signalling a possible trend reversal after the recent downtrend. The left shoulder formed near 1360 , the head at 1317 , and the right shoulder at 1354 . All three points reflect stronger structure and consistent buying interest on dips. The stock has now crossed the neckline around 1387–1390 , a zone where it faced repeated rejection earlier. This breakout shows that buyers have finally taken control.
If the price continues to hold above the neckline, momentum is likely to push it toward the projected target of 1440–1450 , which matches the “final destination” zone shown on your chart. The breakout would lose strength only if the price falls back below 1387 , but unless that happens, the pattern suggests the move still has room to extend higher.

COFORGE - Bullish Breakout Swing Trade Setup💹 Coforge Ltd (NSE: COFORGE)
Sector: IT Services & Consulting | CMP: 1910.20 | View: Bullish Breakout Swing Trade Setup
The COFORGE price structure has begun to reveal a controlled, conviction-based transition from consolidation to momentum. The latest bullish candle wasn’t just a breakout attempt — it carried strength, intent, and participation. Price pushed cleanly through short-term supply while maintaining the higher-low rhythm that has been forming over the past few weeks, indicating a well-built base rather than a reactive spike. Momentum indicators aligned with the price story. RSI broke above its resistance zone, shifting from neutrality into strength — a classic early phase of trend expansion. The Bollinger Bands opened up as the BB Squeeze turned off, confirming that volatility has started releasing in the direction of the breakout. This is typically the moment where institutions begin showing their hand. Volume behaviour strengthened the narrative. The surge wasn’t erratic; it was measured, steady, and consistent with accumulation rather than exhaustion. Buyers absorbed supply efficiently, allowing price to move with stability instead of urgency. This is the type of volume signature that precedes a clean swing leg. Supporting metrics in the broader structure pointed toward balance with a bullish tilt. Market strength indicators showed improving buyer control, the candle body carried dominance, and the range behaviour leaned towards continuation rather than rejection. No distortions, no volatility shocks — just a disciplined transition into momentum.
Taken together, COFORGE presents a well-structured environment:
– Strong candle dominance
– Expanding volatility in the direction of strength
– RSI and BB signals aligning
– Controlled volume confirmation
– A swing-friendly setup with a developing trend backbone
Illustrative Swing Trade Example –
Entry Price: 1910.20
Stop Loss: 1880(On Daily Closing Basis)
View: Short-term swing trade based on bullish breakout
⚠️ Disclaimer
This document is strictly for educational and informational purposes. All examples, charts, levels, and option structures discussed are illustrative and are not intended as buy, sell, or hold recommendations. STWP does not provide investment advice, trading tips, signals, or personalized financial guidance of any kind, nor is it a SEBI-registered intermediary or research analyst.
The analyses, illustrations, and risk–reward structures included here are generic in nature and based on publicly available data and observed market behaviour, which may change without notice. Financial markets involve significant risk; derivatives in particular carry the potential for substantial losses. Option premiums, implied volatility, open interest, delta, and other market variables can fluctuate rapidly and unpredictably. Readers are solely responsible for their trading decisions, capital management, and risk assessment. Before making any investment or trading decision, please consult a SEBI-registered investment advisor. STWP, its representatives, and affiliates shall not be liable for any direct or indirect loss arising from the use of this material. Historical patterns or past market behaviour do not guarantee future outcomes. Nothing in this document should be interpreted as a promise of performance, accuracy, or returns.
Position Status: No active position in COFORGE at the time of analysis.
Data Source: TradingView & NSE India .
💬 Found this useful?
🔼 Boost this post to support structured learning
✍️ Drop your thoughts or questions in the comments
🔁 Share with traders who benefit from clean technical studies
👉 Follow for disciplined, structured, STWP-style analysis.
🚀 Stay Calm. Stay Clean. Trade With Patience.
Trade Smart | Learn Zones | Be Self-Reliant 📊

[INTRADAY] #BANKNIFTY PE & CE Levels(27/11/2025)Bank Nifty is expected to open with a gap-up today, and if the index sustains above the key breakout zone near 59500, bullish momentum may continue through the session. A stable move above 59550 will activate the buying setup with upside targets of 59750, 59850, and 59950+. If the breakout holds strongly, Bank Nifty can attempt to move toward the psychological 60000 zone as well.
On the downside, any weakness or reversal will be confirmed only if the index slips below the 59450–59400 zone, where the selling reversal setup becomes active with targets at 59250, 59150, and 59050-. With a gap-up opening expected above 59500, the market bias remains positive, and sustaining above the breakout zone will be crucial for continuation toward higher levels.

Aditya Birla Capital – Demand Zone📌 Demand Zone:
Demand Zone High: 350.80
Demand Zone Low: 344.40
The stock has triggered a clean 52-week breakout supported by a sharp MACD crossover and strong expansion through the Bollinger bands, signaling fresh momentum entering the structure. The recent wide-range green candle reflects decisive buyer dominance, supported by improving volumes and a steady higher-low sequence that kept the broader trend intact even during consolidation. Momentum indicators such as RSI, CCI, and Stochastics all remain in strong territory, confirming that buyers are still in control despite the price being stretched in the short term. The small demand zone between 353.80–347.95 acts as the immediate retest pocket where institutional flows can re-enter if the stock pulls back. EMA compression has fully expanded, relative strength vs the index has turned positive, and overall the price structure indicates a momentum-driven continuation setup with a favourable trend, strong buying pressure, and stable risk levels as long as the stock holds above the newly formed demand zone.
________________________________________
⚠️ STWP Legal Disclaimer (SEBI-Compliant)
This document is strictly for educational and informational purposes. All examples, charts, levels, and option structures discussed are illustrative and are not intended as buy, sell, or hold recommendations. STWP does not provide investment advice, trading tips, signals, or personalized financial guidance of any kind, nor is it a SEBI-registered intermediary or research analyst. The analyses, illustrations, and risk–reward structures included here are generic in nature and based on publicly available data and observed market behaviour, which may change without notice. Financial markets involve significant risk; derivatives in particular carry the potential for substantial losses. Option premiums, implied volatility, open interest, delta, and other market variables can fluctuate rapidly and unpredictably.
Readers are solely responsible for their trading decisions, capital management, and risk assessment. Before making any investment or trading decision, please consult a SEBI-registered investment advisor. STWP, its representatives, and affiliates shall not be liable for any direct or indirect loss arising from the use of this material. Historical patterns or past market behaviour do not guarantee future outcomes. Nothing in this document should be interpreted as a promise of performance, accuracy, or returns.
Position Status: No active position in ABCAPITAL at the time of analysis.
Data Source: TradingView & NSE India (Past Chart Reference for any charts used).
________________________________________

FEDERALBNK - Demand Zone on the Rise📌 Demand Zone
Demand Zone High: 258.80
Demand Zone Low: 253.75
The stock has just broken into a fresh 52-week high with a powerful expansion candle, supported by bullish volume and strong relative strength against the index. Momentum indicators such as RSI, CCI, and Stochastics are all in the overbought zone, signalling a strong trend in motion but also hinting at the possibility of brief pullbacks as price cools off. The demand zone at 258.80–253.75 acts as the key institutional pocket where buyers previously absorbed supply, making it the most reliable retest area if price dips. OBV remains elevated, EMA bands are fully expanded, and the structure continues to show higher highs with controlled corrections, confirming that buyers remain firmly in command. Overall, the setup reflects a clean bullish continuation with a low-risk structure as long as the price holds above the newly formed demand zone.
________________________________________
⚠️ STWP Legal Disclaimer (SEBI-Compliant)
This document is strictly for educational and informational purposes. All examples, charts, levels, and option structures discussed are illustrative and are not intended as buy, sell, or hold recommendations. STWP does not provide investment advice, trading tips, signals, or personalized financial guidance of any kind, nor is it a SEBI-registered intermediary or research analyst. The analyses, illustrations, and risk–reward structures included here are generic in nature and based on publicly available data and observed market behaviour, which may change without notice. Financial markets involve significant risk; derivatives in particular carry the potential for substantial losses. Option premiums, implied volatility, open interest, delta, and other market variables can fluctuate rapidly and unpredictably.
Readers are solely responsible for their trading decisions, capital management, and risk assessment. Before making any investment or trading decision, please consult a SEBI-registered investment advisor. STWP, its representatives, and affiliates shall not be liable for any direct or indirect loss arising from the use of this material. Historical patterns or past market behaviour do not guarantee future outcomes. Nothing in this document should be interpreted as a promise of performance, accuracy, or returns.
Position Status: No active position in FEDERALBNK at the time of analysis.
Data Source: TradingView & NSE India (Past Chart Reference for any charts used).
________________________________________
