[INTRADAY] #BANKNIFTY PE & CE Levels(18/11/2025)Bank Nifty is likely to open slightly gap-up near the 58,950–59,000 zone, keeping the index positioned right at the resistance band it has been testing for the past few sessions. Since price is opening inside this same reaction zone, early movements may remain choppy until a clear breakout or breakdown occurs.
If Bank Nifty sustains above 59,050, fresh upside momentum can trigger a clean buying opportunity toward 59,250, 59,350, and 59,450+. This level is the key breakout zone—only above this does a trending move become highly probable.
On the downside, if the index slips below 58,950, a quick selling opportunity opens with targets 58,750, 58,650, and 58,550-. This area has acted as support earlier, so a breakdown can lead to a fast retracement.
A reversal opportunity remains valid around 58,550–58,600, with potential to bounce toward 58,750, 58,850, and 58,950+ if the index takes support there.
Overall, with a slight gap-up and price opening exactly at a congestion zone, patience is important. Wait for confirmation above 59,050 for long trades or below 58,950 for shorts. Use strict SL due to expected early volatility.
Technical Analysis

SIEMENS: High-Volume Bullish Reversal Breakout________________________________________
💹 Siemens Ltd (NSE: SIEMENS)
Sector: Capital Goods | CMP: 3232.60 | View: High-Volume Bullish Reversal Breakout
Chart Pattern: Falling Wedge
Candlestick Pattern: Bullish Marubozu
Swing High: 3368
Swing Low: 2925
________________________________________
HNI Trade Analysis:
Bullish Breakout Zone: 3232.6 - 3242
Stop Loss: 3094.44
Low-Risk Entry Zone: 3205
Stop Loss: 3051.17
A decisive wide-range bullish candle with extremely high volume signals aggressive institutional accumulation. Price has broken above the recent micro-range, validating the bullish retracement reversal.
________________________________________
STWP Trade Analysis:
Breakout Level: 3242
Stop Loss: 3094.44
Structure: Strong Bullish Candle + High Volume + Reversal Confirmation
Note: Multi-day compression has triggered a high-probability expansion phase.
________________________________________
Resistances: 3285.27 | 3337.93 | 3433.87
Supports: 3136.67 | 3040.73 | 2988.07
________________________________________
STWP Stock Analysis (Brief Synopsis):
Siemens has delivered a powerful bullish reversal breakout after weeks of consolidation and downward drift, confirmed by a strong Marubozu candle supported by 1.56M volume, significantly above the average. Price has cleanly broken above its short-term declining trendline, reclaiming key levels with strong momentum. RSI has moved into a balanced-to-bullish zone near 62, MACD has triggered a fresh bullish crossover, and Stochastic signals sustained buyer strength.
The breakout also aligns with a Bollinger Band expansion, indicating volatility release from a low-compression phase. Multiple bullish triggers are present simultaneously — RSI breakout, EMA compression to expansion shift, ADX improvement, and volume surge — all hinting that institutional activity is backing the move.
Fibonacci retracement zones remain supportive, with price reclaiming the 23.6% (3029) and 38.2% (3094) levels and heading toward 61.8% (3198) and 78.6% (3273), which aligns with the current price zone.
Trend-wise, intraday timeframes (5m–1H) are fully bullish, while the daily timeframe has turned upward after a prolonged downtrend. The weekly remains corrective but improving. As long as Siemens sustains above 3136–3040, the bullish continuation bias stays intact.
Overall, Siemens now reflects a strong reversal breakout, backed by unusually high volume, renewed momentum, and multi-indicator convergence, favouring continuation toward upper resistance bands.
________________________________________
Final Outlook:
Momentum: Strong
Trend: Bullish (Short-Term) | Improving (Medium-Term)
Risk: Low
Volume: Very High (Institutional Footprints)
________________________________________
⚠️ Disclosure & Disclaimer – Please Read Carefully
The information shared here is exclusively for learning and educational purposes. This is not investment advice and should not be considered a buy or sell recommendation.
I am not a SEBI-registered investment adviser. All views are based purely on chart analysis and publicly available market data.
Financial markets involve risk, and traders must assess their own risk tolerance before taking any trade. Please consult a SEBI-registered financial adviser for investment decisions.
________________________________________
Position Status: No active position in (SIEMENS) at the time of analysis.
Data Source: TradingView & NSE India (Past Chart Reference).
________________________________________
💬 Found this useful?
🔼 Boost this post to help more traders learn structured price-action analysis.
✍️ Share your views or setups in the comments — let’s grow as disciplined traders.
🔁 Forward this to fellow learners who want clean technical frameworks.
👉 Follow for more high-quality, structured STWP breakdowns.
________________________________________
🚀 Stay Calm. Stay Clean. Trade With Patience.
Trade Smart | Learn Zones | Be Self-Reliant 📊
________________________________________

Mastering Breakouts, Patterns, Fair Value Gaps and Risk RatiosLearn how to spot breakout patterns, leverage fair value gaps, and enter trades with smart risk management for consistent swing trading success
Charts used are older than 3 months

[INTRADAY] #BANKNIFTY PE & CE Levels(17/11/2025)Today will be flat opening expected in banknifty. The index continues to hover around a key resistance–support cluster, so initial movements may remain sideways until a clear breakout or breakdown appears.
If Bank Nifty sustains above 58,500–58,550, upside momentum may build toward 58,750, 58,850, and 58,950+. A breakout above 58,550 will be the stronger confirmation for buyers, opening room for a broader upward move.
On the downside, if the index slips below 58,450–58,400, a short opportunity activates toward 58,250, 58,150, and 58,050-. A clean breakdown below 58,450 can trigger intraday profit-booking or a deeper pullback.
Overall, with a flat opening and no major gap expected, Bank Nifty remains in a reactive zone. Traders should wait for a decisive move above 58,550 or below 58,400 to catch trending momentum.

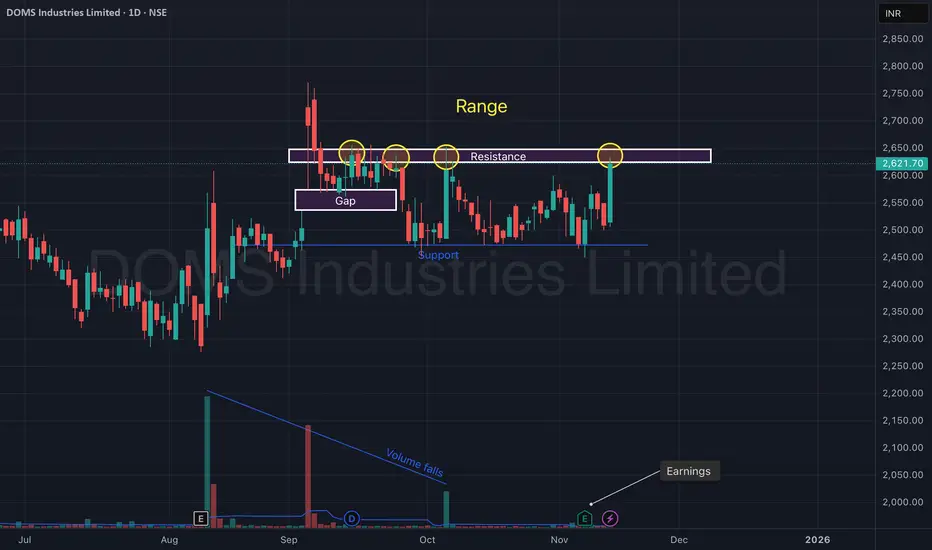
DOMS Industries Ltd – Range Breakout Attempt After Earnings.DOMS Industries continues to trade inside a well-defined range structure, with price repeatedly rejecting the ₹2,630–₹2,660 resistance zone. The recent strong bullish candle toward the upper boundary, combined with improving sentiment after earnings, signals a potential breakout attempt.
A clear gap zone retest around ₹2,520–₹2,550 provided a solid base. Support at ₹2,450 has held cleanly multiple times, validating the lower boundary of the range.
With volume slowly recovering from its multi-week decline and price pressing into resistance again, DOMS is approaching a decisive move.
🎯 Key Technical Levels
CMP: ₹2,621.70 (+4.49%)
Resistance Zone: ₹2,630 – ₹2,660 (Range high)
Gap Support: ₹2,520 – ₹2,550
Major Support: ₹2,450
Breakout Levels to Watch: Close above ₹2,660 with strong volume
📈 Technical View
Price is respecting a horizontal range for several weeks.
Repeated rejections highlighted by circles show strong supply near ₹2,650.
Gap zone acted as demand, helping price bounce back toward resistance.
Volume trend has been falling, suggesting participation has been subdued — a pickup in volume during any breakout would be critical.
Structure stays bullish above ₹2,520; bearish only if price closes below ₹2,450.
📊 Latest Earnings Snapshot
DOMS continues to deliver strong quarterly performance, supporting the technical setup:
Q2 FY26 (Sep 2025):
Net Profit: ~₹55.8 Cr
YoY Profit Growth: ~16%
Q1 FY26:
Revenue: ₹508.7 Cr (↑ ~26% YoY)
PAT: ~₹59.1 Cr (↑ ~8.8% YoY)
Consistent earnings growth strengthens the medium-term outlook and boosts confidence in a potential range breakout.
🧠 View
DOMS is back at its major resistance zone after a clean bounce from the gap support. A strong-volume breakout above ₹2,660 can trigger a momentum extension toward fresh highs, while ₹2,520 and ₹2,450 remain key demand zones to watch.
BankofIndia - Short to Long Term Investment BuyBank of India - Technical Analysis
Current Price: 129.77
Timeframe: Monthly Chart
Key Technical Observations
1. Currently, PSU banks are exhibiting bullish characteristics with positive sector support influencing the stock positively.
2. Cup and Handle Formation - The stock is displaying a gradually developing cup and handle pattern, a classic bullish continuation setup that suggests potential upside momentum.
3. Rising Channel Support - Bank of India is actively trading within and supported by a rising channel, indicating strength in the uptrend structure.
4. Historical Strength Pattern - Over the years since 2021, the stock has been making higher highs and has recently completed a decent retracement, suggesting a bounce-back scenario in formation.
5. RSI Hidden Divergence Confirmation -A hidden divergence has been identified on the RSI indicator, providing additional technical confirmation for trend continuation.
Potential Target Levels
Based on technical analysis:
- 20% Move: 155.40
- 50% Move: 194.70
- 77% Move: 232.00
Risk Management
Strict Stoploss: 99.18 on Weekly candle closing basis
DISCLOSURE & RISK WARNING:
This analysis is provided for educational and informational purposes only and should not be construed as financial advice, investment recommendation, or an offer to buy or sell securities. Past performance is not indicative of future results.

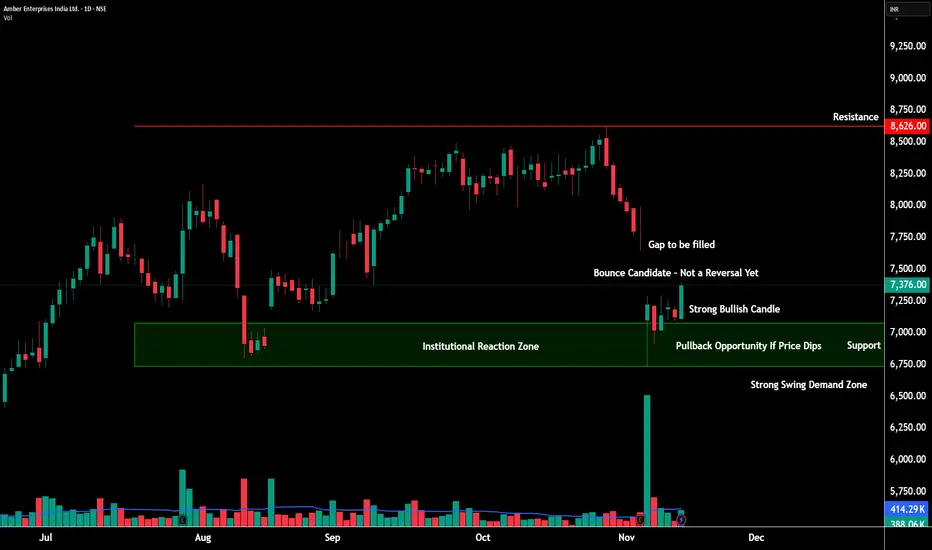
AMBER at a Critical Turning Point – Trend Shift or Just a Bounce💹 Amber Enterprises Ltd (NSE: AMBER)
Sector: Consumer Durables | CMP: 7376 | View: Early Reversal Attempt Inside Downtrend Structure
Chart Pattern: NA
Candlestick Pattern: Bullish Engulfing
📊 Price Action – What’s Really Happening?
Amber finally showed signs of life after a sharp slide from 8600 levels.
Buyers stepped in near 7180–7200, creating a clean intraday reversal base.
But — the larger trend is still down, so this bounce must prove itself above 7480–7536.
🧭 Support & Resistance
Resistances: 7484 | 7536 | 7592 | 7785
Supports: 7183 | 7090 | 6990 | 6882
Demand zones are strong → resistance zones are layered and heavy.
This is why confirmation matters.
📈 STWP Trading Analysis:
Bullish Breakout: 7400 | Stop Loss: 7180
A clean bounce developed from the swing demand zone after strong absorption of selling pressure. Despite this intraday strength, the daily chart remains in a downtrend with lower highs and lower lows. A possible close above 7480–7535 could shift bias to short-term bullish continuation. Below 7180, weakness can reappear quickly.
🧩 Final STWP Outlook
Momentum: Mild |Trend: Bearish | Risk: Moderate | Volume: Improving
⚠️ Disclosure & Disclaimer – Please Read Carefully
This content is strictly for educational and informational purposes.
It is not a buy/sell recommendation and should not be treated as investment advice.
I am not a SEBI-registered investment adviser.
Markets carry risk, and price can move unpredictably.
Always evaluate your risk, position size, and suitability before trading.
Consult a SEBI-registered adviser before making any financial decision.
Position Status: No active STWP position in AMBER at the time of analysis.
Data Source: TradingView & Market Data Snapshot.
💬 Found this breakdown useful?
🔼 Boost this post to help more traders learn structured analysis
✍️ Comment your views or setups — let’s grow together
🔁 Share it with traders who want clean, disciplined analysis
👉 Follow @STWP for more structured trade setups, zone-based insights, and disciplined trading approach.
🚀 Stay Calm. Stay Clean. Trade With Patience.
Trade Smart | Learn Zones | Be Self-Reliant 📊
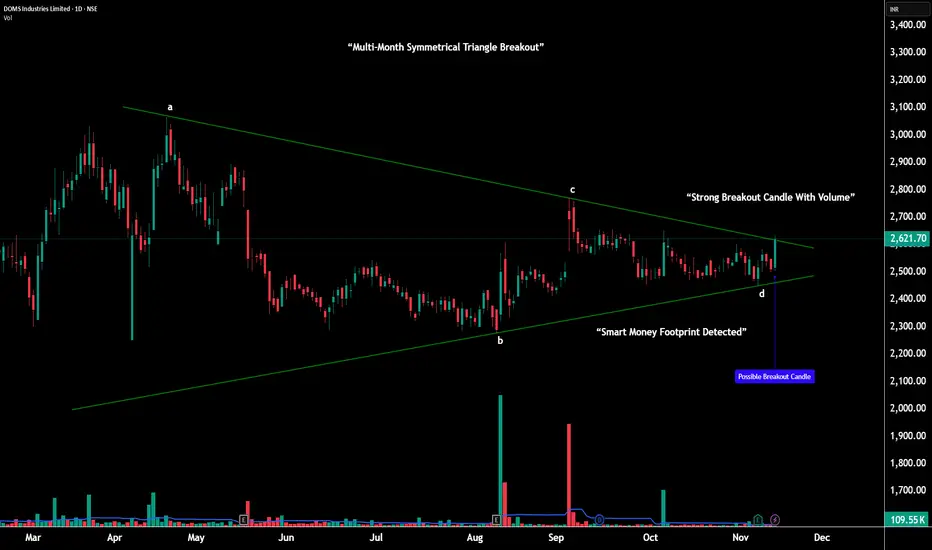
DOMS – Multi-Month Triangle Breakout |________________________________________
💹 DOMS Industries Ltd (NSE: DOMS)
Sector: Consumer & Stationery Products | CMP: 2621.70 |
View: Multi-Month Symmetrical Triangle Breakout With Expanding Momentum
________________________________________
📊 Price Action:
DOMS has spent the last five months forming a large symmetrical triangle — a volatility contraction structure marked by steady lower highs and higher lows from points A–B–C–D.
Throughout this period, buyers consistently defended the broader 2470–2500 demand belt, while sellers lost strength on every push lower.
This slow tightening shows how the market was preparing for a decisive move.
In the latest session, DOMS finally broke above the upper trendline, backed by a strong bullish range candle and a clear rise in volume, confirming the start of a fresh expansion phase.
________________________________________
📉 Chart Pattern Analysis – Large A–B–C–D Symmetrical Triangle:
This multi-month structure represents a major volatility compression following a previous uptrend — a classic continuation setup.
Point A: First major lower high
Point B: Deep anchor low
Point C: Lower high confirming supply weakening
Point D: Higher low showing demand strengthening
This clean A–B–C–D formation validates the symmetrical triangle perfectly.
As price approached the apex, volatility dried up, volume decreased, and the range narrowed — all ideal ingredients for a strong breakout.
The breakout candle now signals the end of compression and beginning of trend expansion.
________________________________________
📈 STWP Trading Analysis:
Bullish Breakout Zone: 2621.70 – 2633.20 | Stop Loss: 2498.60
The breakout candle shows high momentum and elevated volume, signaling institutional activity. Price has reclaimed all key moving averages with trend strength visible across 1H–1D–1W timeframes. As long as DOMS holds above the 2570–2590 structure zone, the bullish continuation bias remains active. Upside resistance levels can be used as potential levels of partial profit-taking, momentum checkpoints, and trend continuation targets.
________________________________________
🕯️ Candlestick Structure – Strong Bullish Breakout Candle:
The latest session printed a wide-range bullish candle, breaking through the upper triangle boundary decisively.
This type of candle — strong body, controlled wicks, clean range expansion — reflects conviction buying, not speculative spikes.
When this appears at the apex of a large compression pattern, it often marks the start of a new trending phase.
________________________________________
📏 Fibonacci Analysis:
Measured from swing low 2275.40 to swing high 2585.70:
38.2% @ 2393 → Secondary support
50% @ 2430 → Balanced support zone
61.8% @ 2467 → Strong golden zone (defended repeatedly)
The rebound from the 61.8% area aligns with the D-point of the triangle — reinforcing the structural validity and strengthening the breakout.
________________________________________
🧭 STWP Support & Resistance:
Resistances: 2667 | 2713 | 2794
Supports: 2540 | 2459 | 2413
The 2470–2500 region remains a major demand base, where the stock formed its higher lows at point D.
Immediate supply lies near 2667–2713, the first test zone after the breakout.
________________________________________
📊 STWP Volume & Technical Setup:
Volume climbed to 109.55K, significantly higher than recent averages — showing accumulation on the breakout.
RSI at 59 and Stochastic at 67 suggest healthy momentum with room for continuation.
MACD structure remains bullish, and multi-timeframe trend strength is intact.
Trend Direction: UPTREND | Volume Confirmation: Strong Buying Activity
________________________________________
🧩 STWP Summary View:
Momentum: Strong
Trend: Bullish
Risk: Moderate
Volume: High
DOMS has broken out of a large multi-month symmetrical triangle, a pattern known for initiating strong directional moves once volatility expands.
The structure remains bullish above 2570–2590, with continuation potential toward 2667 → 2713 → 2794 in the coming sessions.
________________________________________
⚠️ Disclosure & Disclaimer – Please Read Carefully
This analysis is for educational purposes only and should not be treated as investment advice.
I am not a SEBI-registered financial advisor.
Trading carries risk — use stop-loss, risk limits, and disciplined position sizing.
Please consult a SEBI-registered adviser before making trading decisions.
________________________________________
Position Status: No active position in (DOMS) at the time of this analysis.
Data Source: TradingView & NSE India
________________________________________
💬 Found this useful?
🔼 Boost this post to help more traders learn structured analysis
💭 Share your thoughts — does this breakout hold the strength for trend expansion?
🔁 Share with traders who study breakout structures
👉 Follow for more clean, price-action-driven institutional breakdowns
🚀 Stay Calm. Stay Clean. Trade With Patience.
Trade Smart | Learn Zones | Be Self-Reliant 📊
________________________________________
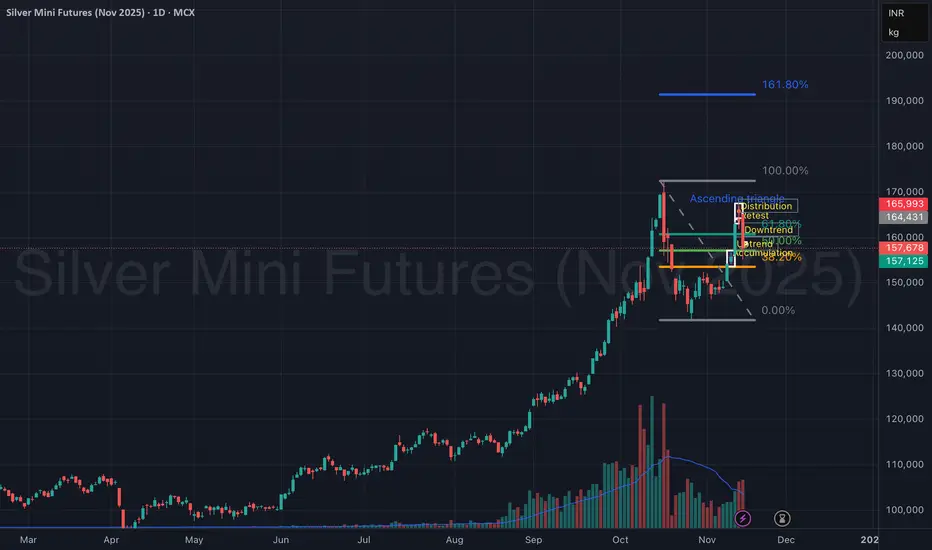
Silver Mini Futures (Nov 2025) – Accumulation to DistributionSilver Mini Futures on the 15-min chart clearly showcases a complete market cycle structure — transitioning from accumulation → uptrend → distribution → downtrend, providing an excellent study in price behavior and volume confirmation.
The move began with accumulation around ₹1,55,000, followed by a strong uptrend breakout, leading to a sharp rally. However, as price entered the ascending triangle near the ₹1,66,000 zone, momentum weakened, signaling distribution.
An exhaustion gap and a failed retest confirmed a reversal, leading to a steep downtrend, which remains active after a minor pullback.
📊 Phase Breakdown:
Accumulation Phase: ₹1,54,800 – ₹1,55,800
Sideways base formation with increasing volume at lows.
Uptrend Phase: Breakout above ₹1,56,000 triggered momentum.
Distribution Phase: Formed an ascending triangle with weak breakout follow-through.
Retest failure at ₹1,65,000 signaled exhaustion.
Downtrend Phase: Sharp decline with heavy volume, currently finding support near ₹1,57,000.
🎯 Key Technical Zones:
Resistance: ₹1,64,400 – ₹1,66,000 (supply zone)
Immediate Resistance (Retest Box): ₹1,58,200 – ₹1,58,800
Support Zone: ₹1,56,800 – ₹1,57,100
Major Support: ₹1,54,500
🧠 View:
Silver Mini Futures is currently in a downtrend continuation phase after a distribution top. A minor retest near ₹1,58,800 could invite short opportunities, while only a sustained move above ₹1,60,000 may signal trend reversal strength.
GRSE – Bullish Continuation Breakout |________________________________________
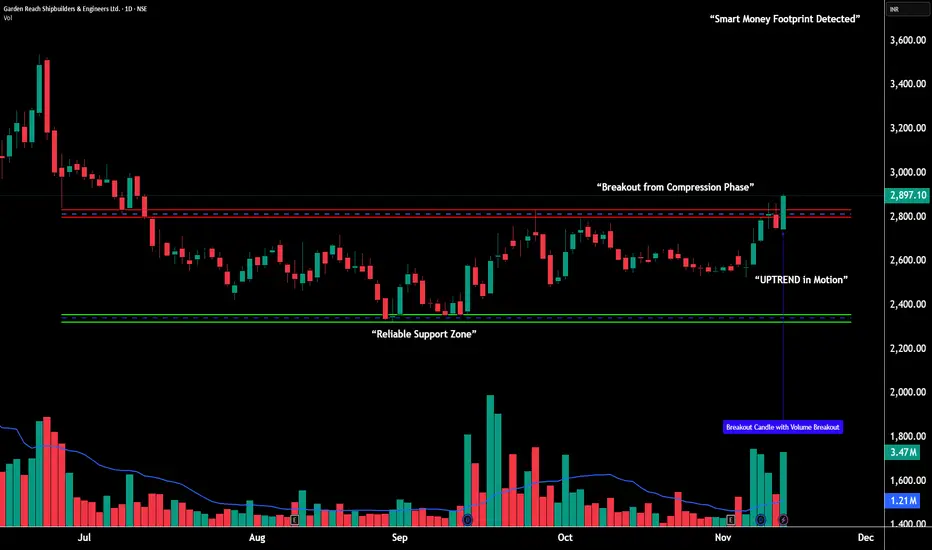
💹 Garden Reach Shipbuilders & Engineers Ltd (NSE: GRSE)
Sector: Defence & Engineering | CMP: 2,897.10
View: Bullish Momentum Breakout with Institutional Strength
________________________________________
📊 Price Action (Explained Simply):
GRSE has shifted from a slow sideways phase into a strong uptrend after rising from the 2,323 swing low to 2,904 with two powerful, wide-range green candles.
The most important part of this move is the huge jump in volume — 3.47M shares traded vs 1.21M average — which clearly signals institutional accumulation.
This breakout shows that the stock has moved from “quiet preparation” into “active momentum,” and holding above the 2,790–2,820 zone will be crucial for the continuation of this trend.
________________________________________
📉 Chart Pattern – Continuation Breakout:
After multiple accumulation attempts between 2,500–2,650, GRSE broke out with a clean, strong bullish marubozu candle.
This candle confirms buyer dominance throughout the session and typically marks the start of a new trending leg.
The structure now supports sustained follow-through as long as the stock maintains support above key zones.
________________________________________
📈 STWP Trading Analysis:
Bullish Breakout Zone: 2,897.10 - 2,904.40
Stop Loss: 2,735
The stock is now trading above short- and mid-term EMAs with trend alignment visible across daily, weekly, and monthly charts.
Sustaining above 2,790–2,820 keeps the bullish structure intact, while a strong close above 3,100 can trigger the next momentum wave.
________________________________________
🕯️ Candlestick Structure – Bullish Engulfing + Bullish Marubozu:
The current breakout session displays a Bullish Engulfing candle followed by a strong Bullish Marubozu, showing complete dominance from buyers. The engulfing pattern absorbed the previous red candle entirely, signaling a clear shift in control, while the marubozu confirms uninterrupted buying pressure throughout the session. When these two patterns appear together — backed by a sharp surge in volume — it reflects institutional accumulation and high conviction demand entering the stock. Such powerful candlestick combinations near breakout zones often act as trend-continuation triggers, indicating that buyers are firmly in charge and gearing up for the next upward expansion.
________________________________________
📏 Fibonacci Analysis:
Using swing low 2,323 → swing high 3,538:
38.2%: 2,787 → Strong support
50%: 2,930 → Active consolidation zone
61.8%: 3,047 → First major resistance
78.6%: 3,278 → Extended resistance
As long as the stock holds above 2,790–2,820, the Fibonacci map supports continuation toward higher levels.
________________________________________
🧭 Support & Resistance (STWP Levels):
Resistances: 2,955 | 3,010 | 3,116
Supports: 2,791 | 2,685 | 2,628
The zone around 2,790–2,820 is now the primary demand base and acts as the key level to protect for bullish continuation.
________________________________________
📊 Volume & Technical Setup:
Volume: 3.47M vs 1.21M → Clear institutional activity
RSI: 69 → Strong but healthy momentum
Stochastic: 98 → Buyer dominance
CCI: 205 → Strong trend confirmation
MACD: Bullish → Trend aligned across timeframes
Trend Direction: UPTREND
Volume Confirmation: Strong institutional participation
________________________________________
🧩 STWP Summary View:
Momentum: Strong
Trend: Bullish
Risk: Moderate
Volume: High
GRSE has entered a clean breakout phase supported by strong volume, supportive sector sentiment, and consistent institutional footprints.
As long as the stock protects the 2,790–2,820 zone, the path remains open toward 3,075 → 3,275 and, in a strong extension, toward 3,538.
________________________________________
⚠️ Disclosure & Disclaimer – Please Read Carefully
This analysis is for educational purposes only and should not be treated as investment advice or a buy/sell recommendation.
I am not a SEBI-registered investment adviser. All insights are based on price action, technical structure, and publicly available data.
Trading involves risk — always manage position size, stop-loss, and discipline.
Please consult a SEBI-registered financial advisor before trading based on any analysis.
________________________________________
Position Status: No active position in (GRSE) at the time of posting.
Data Source: TradingView & NSE India
________________________________________
💬 Found this useful?
🔼 Boost this post to help more learners discover structured analysis.
💭 Share your thoughts — can GRSE carry this momentum above 3,100?
🔁 Share with traders tracking defence-sector strength.
👉 Follow for more clean, price-action based institutional setups.
🚀 Stay Calm. Stay Clean. Trade With Patience.
Trade Smart | Learn Zones | Be Self-Reliant 📊
________________________________________
EUR/USD – Growth Opportunity After Positive DataThe EUR/USD pair is currently trading around 1.1612, up by 0.2% ahead of the September industrial production data from the Eurozone. This data is expected to show a 0.7% recovery for the month, following a sharp 1.2% decline the previous month. This is a positive signal for the Euro and could create a strong growth opportunity for EUR/USD.
Technical Analysis: The chart shows that EUR/USD is attempting to break the 1.16500 level, which indicates a test towards 1.16800 in the short term. If the pair continues to maintain this trend, it may break through strong resistance and target 1.17000. However, this may require additional support factors, such as weak data from the U.S. or more positive macroeconomic signals for the Euro.
Conclusion: With the factors from industrial production data and technical signals , I believe EUR/USD has the potential to continue increasing in the short term, but further confirmation from economic data is needed for a stronger breakout. If the price holds above 1.160 and breaks resistance, 1.170 will be the next realistic target.

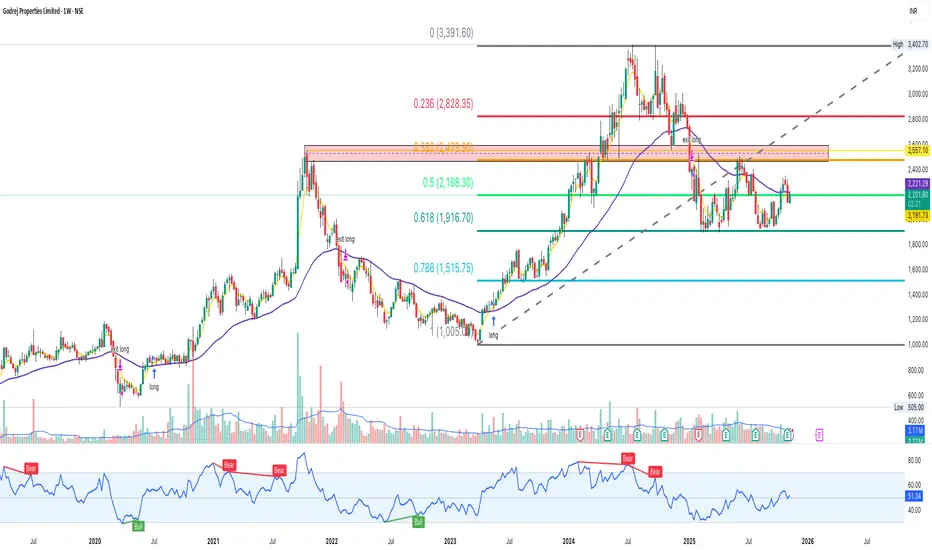
Godrej Properties #Screener — Hold Fib Levels After CorrectionGodrej Properties (NSE: GODREJPROP) is stabilising after a prolonged correction from the ₹3400 zone.
The stock has held key Fibonacci retracement levels and is now forming a base between ₹1900–₹2250 — a critical structure zone for trend continuation.
This behaviour is typical of strong mid-large caps that correct deeply, reset sentiment, and then rebuild a trend.
📌 Structure Highlights
Held 0.618 retracement (₹1916) perfectly — strong long-term support
0.50 level ₹2198 reclaimed → bullish sign
Price still below major supply around ₹2479–2557 (orange box)
Higher lows forming since the ₹1005 bottom
Trendline support from 2023 still valid (grey dotted line)
RSI showing slow momentum recovery after bearish cycle
📌 Key Levels to Track
Support Zones:
₹2190
₹1916 (major Fibonacci support)
₹1515 (0.786) — deeper trend support
Resistance Zones:
₹2221 (near-term resistance)
₹2479–2557 (strong supply zone)
₹2828 (0.236 retracement)
₹3390–3400 (major ATH resistance)
A clean weekly close above ₹2479–2557 would unlock higher trend continuation.
📌 Technical Snapshot
✅ Holding major Fibonacci structure
✅ Trendline support intact
✅ Slow volume expansion near base
✅ Higher lows forming
✅ Recovery setup, not breakout-chasing
Bias stays neutral to bullish above ₹1916, turning stronger above ₹2221.
📌 View
The stock is in a large consolidation zone after a strong multi-year rally.
Watching for a breakout from the ₹2479–2557 supply region to confirm trend continuation.
📒 Educational market structure analysis — not investment advice.
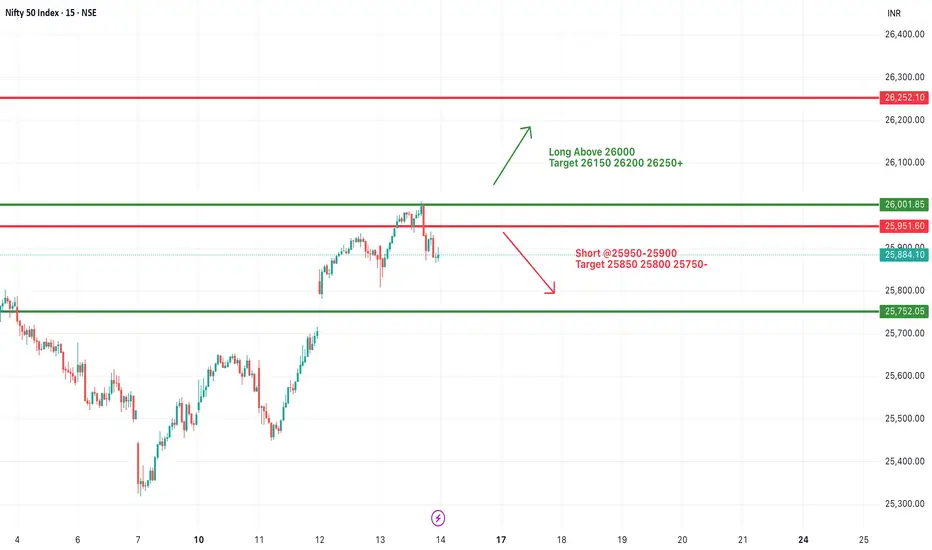
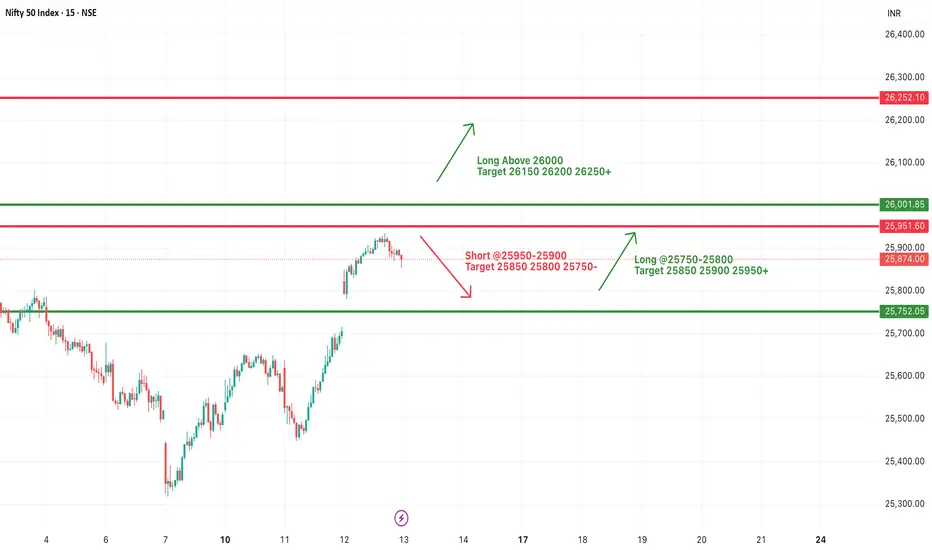
#NIFTY Intraday Support and Resistance Levels - 14/11/2025Nifty is expected to open flat near the 25,880–25,900 zone, keeping price action inside the same tight range as yesterday. The index is currently trading near an important resistance cluster, so early candles may remain choppy and sideways until a clear directional move develops.
If Nifty sustains above 26,000, upside strength can continue toward 26,150, 26,200, and 26,250+. A breakout above 26,000 will act as the primary confirmation for long positions, indicating fresh buyer momentum.
On the downside, if the index slips below 25,950–25,900, a short setup may get activated toward 25,850, 25,800, and 25,750-. This zone has acted as support earlier, so a breakdown may lead to a quick intraday slide.
Overall, with a flat opening and no gap advantage for either side, Nifty remains in a reaction zone. Traders should wait for a decisive move above 26,000 or below 25,900 to catch a clean trend. Use strict SL as volatility may rise around resistance levels.
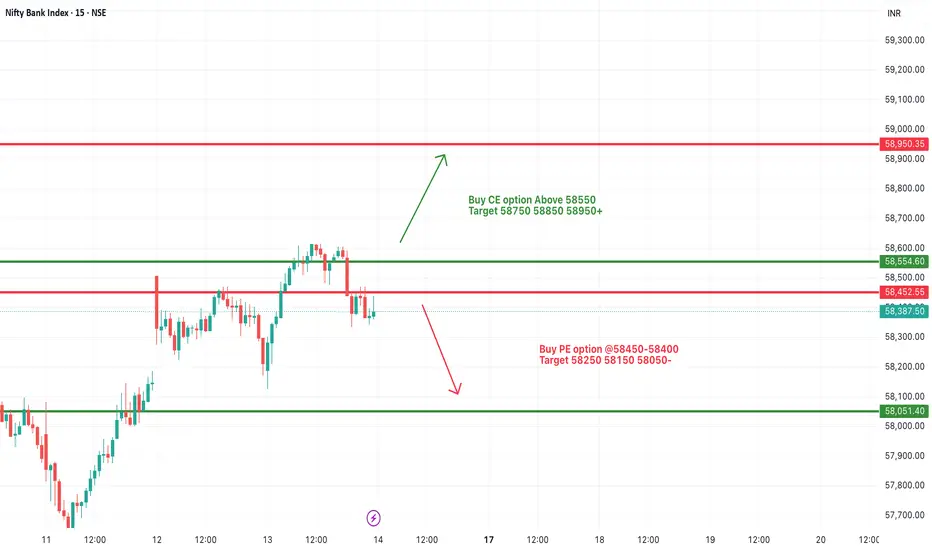
[INTRADAY] #BANKNIFTY PE & CE Levels(14/11/2025)Bank Nifty is likely to open flat near the 58,350–58,400 zone, keeping price action inside the same range as yesterday. The index continues to hover around a key resistance–support cluster, so initial movements may remain sideways until a clear breakout or breakdown appears.
If Bank Nifty sustains above 58,450–58,500, upside momentum may build toward 58,550, 58,850, and 58,950+. A breakout above 58,550 will be the stronger confirmation for buyers, opening room for a broader upward move.
On the downside, if the index slips below 58,450–58,400, a short opportunity activates toward 58,250, 58,150, and 58,050-. A clean breakdown below 58,400 can trigger intraday profit-booking or a deeper pullback.
Overall, with a flat opening and no major gap expected, Bank Nifty remains in a reactive zone. Traders should wait for a decisive move above 58,550 or below 58,400 to catch trending momentum.
XAUUSD – When the Market Starts to “Smell” a Bullish MoveLooking at the current price action, it’s quite clear that gold is entering a new bullish phase supported by both fundamental catalysts and smart money flow . With the U.S. government preparing to reopen and key economic data returning, investors are increasing their bets on the possibility that the Fed may cut interest rates next month . In a climate where political and economic uncertainty is still lingering, gold naturally becomes a preferred safe-haven asset.
On the chart, XAUUSD is maintaining a clean and steady uptrend , consistently bouncing from the trendline and forming higher highs and higher lows. These precise retests show that buyers are firmly in control . Price is now moving towards the 4,300 zone, where some short-term volatility may appear before heading further into the 4,380 resistance.
As long as gold holds above the trendline support , the market can continue its bullish momentum in the coming sessions. Every pullback at this stage acts like a fresh boost , giving buyers more strength to push the market higher.

Bharat Dynamics Ltd – Symmetrical Triangle Breakout on Watch (D)Bharat Dynamics is currently trading near a key breakout point of a symmetrical triangle pattern on the daily chart. After a prolonged downtrend, the stock has entered a consolidation phase, forming higher lows and compressing price action — a setup that often leads to a strong directional move.
Bharat Dynamics Q2 Results
✅ Net Profit: ₹216 Cr vs ₹123 Cr (YoY) — 🔼 up 75.5%
✅ Revenue: ₹1,147 Cr vs ₹545 Cr (YoY) — 🚀 strong growth
✅ EBITDA: ₹188 Cr vs ₹98.8 Cr (YoY) — 🔼 up 89.4%
✅ EBITDA Margin: 16.4% vs 18.1% (YoY) — 🔽 slight dip
The price has reclaimed the ₹1,500–₹1,530 zone, and a sustained close above ₹1,550 could confirm a breakout, opening the path for a quick momentum rally toward ₹1,650 and beyond.
🎯 Key Levels:
CMP: ₹1,525.70 (−0.95%)
Breakout Zone: ₹1,550 – ₹1,560
Target 1: ₹1,650 – ₹1,670
Target 2: ₹1,710 – ₹1,740
Resistance: ₹1,950 – ₹2,000
Stop-Loss: ₹1,470 (on daily close basis)
📊 Technical View:
Symmetrical triangle pattern forming after a prolonged correction.
Price compression with reduced volume indicates breakout buildup.
Breakout confirmation expected above ₹1,560 with increasing volume.
If sustained, the move could extend toward the higher resistance zone around ₹1,950+.
🧠 View:
Bharat Dynamics is at a decisive point — a breakout above ₹1,550–₹1,560 with volume can mark the start of a short-term uptrend. Keep an eye on price action near this level for confirmation.

Emerging Symmetry: Spotting Recurrent Patterns on the WtfNoticing an interesting structural similarity on the weekly chart, where a previous impulsive move (highlighted) was followed by a prolonged corrective phase confined within dynamic support and resistance lines. The current price action is developing above a rising support and beneath a descending trendline, reflecting the classic ingredients of compression after expansion seen earlier.
This type of setup warrants attention for those studying recurring market behaviours and pattern symmetry.
No directional bias—just a pure market structure observation drawn from historical context.

Bajaj Auto #Screener — Structure Compression Before the BreakoutBajaj Auto (NSE: BAJAJ-AUTO) is forming a clean structure compression between a long-term descending trendline (blue) and rising support trendline (purple).
The stock has created higher lows, showing buyer strength returning after a corrective phase.
This is a classic squeeze pattern where price coils before a directional move — something high-quality large caps often do before a trend continuation.
Key Structure Highlights
📌 Strong support base at ₹8550–8600
📌 Rising trendline support since Mar 2025
📌 Sellers defending the ₹9490 major supply zone
📌 Multiple failed breakdowns → indicates demand
📌 Compression between trendlines tightening
📌 Price still above 50 EMA on weekly (momentum intact)
Key Levels
Major Resistance:
₹9490 (big supply zone + trendline confluence)
Support Levels:
₹8850
₹8550 (structure support)
Below this, momentum weakens
As long as price maintains above ₹8550, structure stays bullish-to-neutral with potential for upside resolution.
View
Momentum bias stays positive above ₹8550.
A decisive close above ₹9490 may trigger a clean continuation move.
Technical Snapshot
✅ Large-cap quality stock
✅ Higher lows (structure strength)
✅ Price contraction = energy build-up
✅ Watching breakout above ₹9490 for trend continuation
✅ Good risk-defined setup for swings
This isn’t a random breakout play — it’s a large cap structural setup, where the next move usually sets a multi-week trend.
📒 Educational price structure analysis — not investment advice.

Asian Paints #Screener — Trend Reversal Before The Crowd Asian Paints Ltd (NSE: ASIANPAINT) has given a strong breakout from a long-term descending trendline with a sharp momentum candle.
This move signals a trend reversal after months of consolidation and price compression — supported by solid weekly volume.
Chart Structure #Screener
📌 Breakout from descending trendline
📌 Volume surge confirming buyer interest
📌 Price holding above 50 EMA on weekly
📌 Formation of higher lows since early 2025
📌 Strong bullish candle closing above key supply zone
Key Levels
Resistance Zone: ₹2880 – ₹3130
Support Zone: ₹2640 – ₹2720
Major Support: ₹2490 (structure base)
As long as price stays above ₹2640, trend bias remains bullish ✅
View
This setup represents a trend shift, not just a breakout — aligning with strength returning in large-cap sectors.
A healthy retest or consolidation above ₹2700 zone could provide follow-through opportunities.
Technical Snapshot
✅ Trendline breakout confirmation
✅ Volume expansion + wide-range candle
✅ Higher-low formation
✅ Momentum shift to buyers
✅ Mid-to-large cap stock showing leadership recovery
📒 Educational analysis only — not investment advice.

#NIFTY Intraday Support and Resistance Levels - 13/11/2025Nifty is likely to open with a gap up near the 25,950 zone, placing the index exactly at the important resistance area highlighted earlier. Price is opening directly inside the supply region, so the first few minutes may remain volatile.
Sustaining above 25,950–26,000 will strengthen the momentum on the upside, and once Nifty holds above this zone, it can move toward 25,850, 25,900 and 25,950+ levels. On the other hand, if the index fails to sustain above this region and shows rejection from the opening zone, then a short opportunity may activate below 25,950–25,900, with downside targets toward 25,850, 25,800 and 25,750-.
Overall, the index is opening at an important level, and a clear direction will come only after sustaining above or below the marked zones. Use proper levels and wait for confirmation.
[INTRADAY] #BANKNIFTY PE & CE Levels(13/11/2025)Bank Nifty is likely to open with a gap up near the 58,400–58,450 zone, indicating positive sentiment after yesterday’s consolidation phase. The index is currently hovering close to its key resistance area, and a decisive move above this zone could lead to further momentum on the upside.
If Bank Nifty sustains above 58,500–58,550, traders can look for buying opportunities, targeting 58,750, 58,850, and 58,950+. A breakout beyond 58,950 could trigger a sharp rally toward the 59,100–59,200 zone.
On the downside, support lies at 58,050, followed by 57,950. A fall below 57,950 may invite mild selling pressure, leading to targets around 57,750–57,550.
Overall, with a gap up opening, market tone remains slightly bullish, but traders should wait for sustained movement above 58,550 for confirmation of upward continuation. If the index fails to hold above 58,450, a short-term pullback cannot be ruled out. Keeping a trailing stop loss and partial profit booking is advisable in this volatile range.

Unlocking Chart Vision: Why One Breakout Isn’t EnoughRetail traders often gravitate towards the familiar—you’ll notice on the right chart, a classic breakout above the counter trendline (CT) is the “go-to” setup most focus on. This approach is common, but it can signal limited experience or a lack of exposure to complex, multi-pattern scenarios.
As a full-time trader, my scanning process involves viewing charts through a multi-pattern lens, not just relying on a single breakout narrative. On the left chart, you’ll spot another prominent CT in red—this additional hurdle isn’t always visible to less experienced eyes. Notably, a hidden parallel channel (orange) adds further nuance, underscoring the importance of assessing every structure before deciding on bias or trade management.
This post is purely observational—there’s no forecasting or trade advice here. The goal is to highlight why expanding your pattern recognition toolkit and investing more screen time can reveal deeper price action dynamics often missed in simplistic approaches. If you want to bring your technical analysis to a professional level, start looking for what’s not immediately obvious!

Gold Holding Above 4100$ Market Prepares for Next Wave ExpansionGold continues to sustain momentum above 4,100$, maintaining its bullish market structure as traders price in expectations of a Fed rate cut in December.
While the US Dollar shows brief recovery, the underlying flow still supports safe-haven demand — especially as global risk sentiment remains fragile and the US government moves closer to reopening.
📊 Technical Overview (H1 – MMFLOW Structure)
Price is currently consolidating within the 4,108$–4,113$ liquidity pocket, where prior breakout demand aligns with short-term Fibonacci retracement (0.382–0.5).
This zone continues to attract buy-side liquidity, suggesting accumulation rather than exhaustion.
As long as 4,085$ remains protected, the bias stays bullish toward 4,172$ – 4,203$ (Fibo 1.272–1.618). However, failure to break above 4,172$ may trigger a short-term reaction sell before the next impulsive leg resumes.
🎯 Trading Plan – MMFLOW Setup
🌸 BUY Scenario (Liquidity Retest)
Buy Zone: 4,086 – 4,084
Stop Loss: 4,080
Targets: 4,090 → 4,095 → 4,100 → 4,110 → 4,120 → 4,130 → 4,150+
🔥 SELL Scenario (Short-Term Reaction Zone)
Sell Zone: 4,172 – 4,174
Stop Loss: 4,180
Targets: 4,165 → 4,160 → 4,150 → 4,140 → 4,130 → 4,120
🧠 MMFLOW TRADING Insight:
“Price is language — liquidity is intent. The market is not random; it’s engineered to test conviction before expansion.”
Bias remains bullish above 4,085$ – any dip into the liquidity base could offer the last accumulation before the next breakout.
