DIVISLAB - Bullish Momentum + RSI & MACD Breakout📈 Divis Laboratories Ltd | Bullish Momentum + RSI & MACD Breakout 🚀
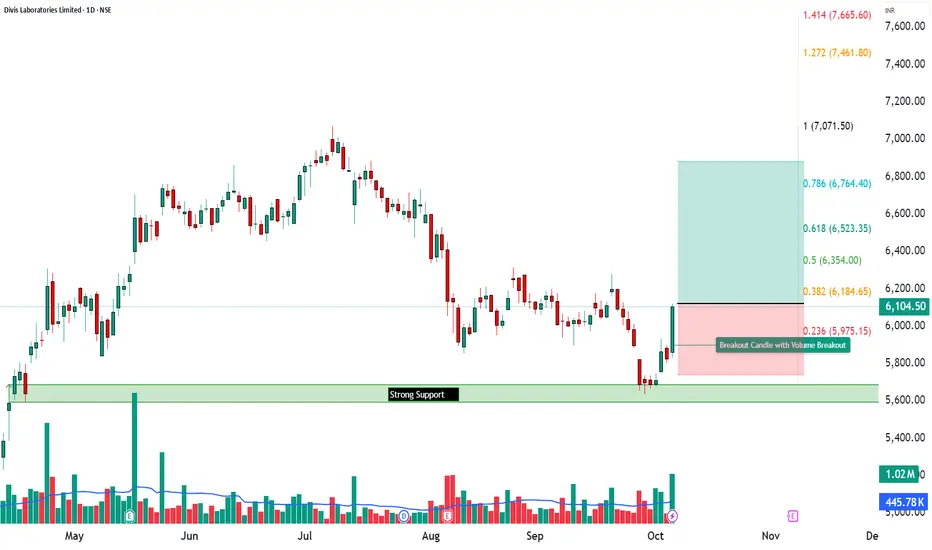
🔹 Entry Zone: ₹6,100 – ₹6,120
🔹 Stop Loss: ₹5,739.80 (Risk ~₹380 pts)
🔹 Supports: 5,917.33 / 5,730.17 / 5,628.83
🔹 Resistances: 6,205.83 / 6,307.17 / 6,494.33
________________________________________
🔑 Key Highlights
✅ Strong Bullish Candle – powerful reversal from key support zone
✅ RSI Breakout – momentum confirmation after prolonged base
✅ MACD Crossover – positive trend shift visible
✅ Bullish SuperTrend + VWAP Alignment – institutional momentum confirmation
✅ BB Squeeze-Off → volatility expansion expected
________________________________________
🎯 STWP Trade View
📊 Momentum suggests a short-term bullish rally is in play.
A close above ₹6,200 may open further upside toward ₹6,307 – ₹6,494.
⚠️ Supports at ₹5,917 & ₹5,730 act as crucial protection zones.
Volume spike confirms fresh long build-up — a classic “Buy Today, Sell Tomorrow” setup.
________________________________________
💡 Learning Note
This setup beautifully showcases how combining RSI Breakout + MACD Crossover + VWAP alignment strengthens a momentum-based reversal.
When such signals converge near Fibonacci supports, they offer high-probability swing setups with strong follow-through potential.
________________________________________
⚠️ Disclosure & Disclaimer – Please Read Carefully
The information shared here is purely for learning and awareness purposes.
It is not a buy or sell recommendation and should not be treated as investment advice.
I am not a SEBI-registered investment adviser — all observations are based on personal chart study and publicly available data.
Trading involves risk — markets can move unexpectedly, and losses can exceed invested amounts.
Past setups or patterns do not guarantee future outcomes.
If you’re a beginner, treat this content as a learning reference and start with paper trades.
If you’re experienced, align setups with your own risk and position sizing strategy.
Always consult a SEBI-registered advisor before executing any trades.
By engaging with this content, you accept full responsibility for your actions.
________________________________________
💬 Found this useful?
🔼 Give this post a Boost to help more traders learn structured setups
💬 Drop your thoughts or chart views below — let’s grow together
🔁 Share with fellow traders who love clean, data-backed analysis
👉 “If you liked this breakdown, follow for more disciplined, structured setups.”
🚀 Stay Calm. Stay Clean. Trade With Patience.
Trade Smart | Learn Zones | Be Self-Reliant 📊
Technical Analysis
HDFC AMC LTD | Bullish Momentum + Possible Breakout📈 HDFC AMC LTD | Bullish Momentum + Possible Breakout 🚀
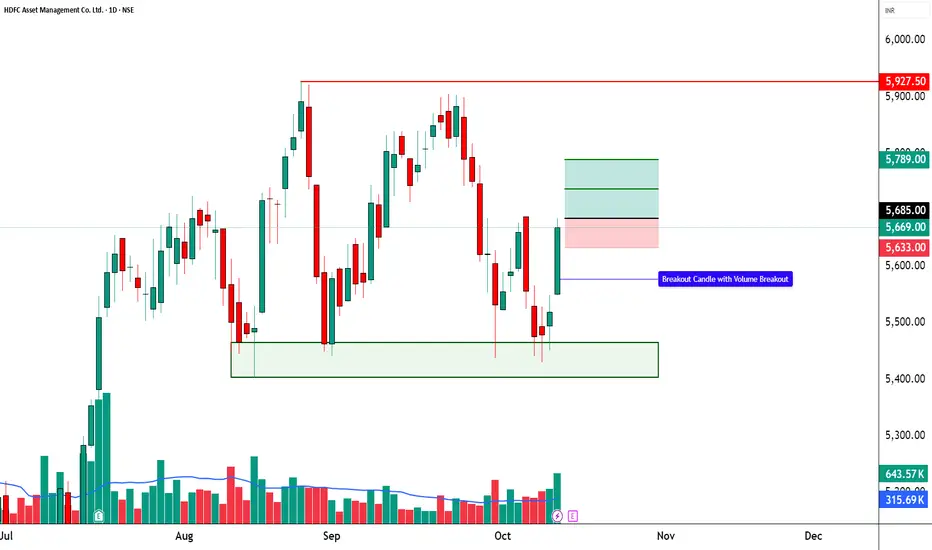
🔹 Bullish Breakout Zone: 5,660 – 5,685
🔹 Stop Loss: 5,633 (Risk ~₹52)
🔹 Supports: 5,584 / 5,499 / 5,448
🔹 Resistances: 5,719 / 5,770 / 5,855
🔑 Key Highlights
HDFC AMC has formed a strong bullish candle with a notable volume surge, clearly confirming aggressive buying interest. The RSI breakout signals a shift in momentum after a prolonged consolidation phase, indicating that the stock is gaining renewed strength. Additionally, a Bollinger Band Squeeze-Off pattern is visible, suggesting a potential volatility expansion and a short-term breakout on the upside. The spike in trading volume further reinforces the bullish sentiment, hinting at possible institutional participation behind this move.
🎯 STWP Trade View
📊 Price has reclaimed control above near-term resistances with improving momentum.
A sustained close above ₹5,719 can trigger a move toward ₹5,770–₹5,855 levels in the short term.
Pullbacks toward ₹5,640–₹5,660 may offer favorable entry zones with tight risk control.
⚠️ Supports at ₹5,584 and ₹5,499 remain crucial for maintaining the swing structure and protecting positions.
________________________________________
📊 Final Outlook
Momentum: 🔥 Strong
Trend: 📉 Bearish (but reversing)
Risk: 🟢 Low
Volume: 📈 High
________________________________________
💡 Learning Note
This setup demonstrates the power of confluence — RSI breakout + BB squeeze + volume surge.
Such multi-signal alignments often mark the start of a momentum phase, offering early entry opportunities before a confirmed breakout rally.
________________________________________
________________________________________
⚠️ Disclosure & Disclaimer – Please Read Carefully
The information shared here is meant purely for learning and awareness. It is not a buy or sell recommendation and should not be taken as investment advice. I am not a SEBI-registered investment adviser, and all views expressed are based on personal study, chart patterns, and publicly available market data.
Trading—whether in stocks or options—carries risk. Markets can move unexpectedly, and losses can sometimes exceed the money you have invested. Past performance or past setups do not guarantee future results.
If you are a beginner, treat this as a guide to understand how the market works and practice on paper trades before risking real money. If you are experienced, always assess your own risk, position sizing, and strategy suitability before entering trades.
Consult a SEBI-registered financial adviser before making any real trading decision. By engaging with this content, you acknowledge full responsibility for your trades and investments.
Position Status: No active position in HDFCAMC at the time of analysis.
Data Source: TradingView & NSE India (Past Chart Reference) (Historical levels)
💬 Found this useful?
🔼 Give this post a Boost to help more traders discover clean, structured learning.
✍️ Drop your thoughts, questions, or setups in the comments — let’s grow together!
🔁 Share with fellow traders and beginners to spread awareness.
👉 “If you liked this breakdown, follow for more clean, structured setups with discipline at the core.”
🚀 Stay Calm. Stay Clean. Trade With Patience.
Trade Smart | Learn Zones | Be Self-Reliant 📊
ADANI PORTS | Bullish Momentum + RSI Breakout - STWP________________________________________
📊 ADANI PORTS | Bullish Momentum + RSI Breakout 🚀
Ticker: NSE: ADANIPORTS | Sector: Port & Logistics
CMP: ₹1,437.80
Rating: ⭐⭐⭐⭐ (Bullish Momentum Breakout – For Educational Purposes Only)
Pattern Observed: 📈 Price Action Setup – Breakout from Consolidation Zone
Candlestick Pattern: Strong Bullish Momentum Candle
________________________________________
🟦 Chart Summary
Adani Ports has formed a strong bullish candle on high volume, breaking above a short-term consolidation resistance zone. The structure reflects renewed buying strength and momentum, suggesting a possible continuation toward higher resistance levels in the near term.
________________________________________
🟨 Technical Indicators Summary
The chart highlights Bullish Momentum supported by a Strong Bullish Candle, indicating renewed buying interest. A clear RSI breakout confirms strengthening momentum, while the Bollinger Band Squeeze-On Compression suggests that volatility is contracting — often a precursor to a sharp directional move. This combination of momentum, structure, and volume alignment signals a potential breakout zone, reflecting a powerful setup where multiple indicators converge to reinforce short-term bullish sentiment.
________________________________________
🟩 Supports: 1,408 / 1,379 / 1,362
🟥 Resistances: 1,454 / 1,471 / 1,500
________________________________________
🟩 Swing Trade Study (Educational Viewpoint)
From a technical study perspective, Adani Ports is showing signs of a bullish breakout above ₹1,441.90, which may signal momentum continuation. The reference support for this structure lies near ₹1,387.10, defining the chart-based risk zone of around ₹54.8. This observation is shared only for educational and analytical purposes to demonstrate structured swing analysis.
________________________________________
🟩 Intraday Observation (For Learning Purposes)
For intraday study, the potential bullish breakout zone lies between ₹1,437.80 and ₹1,442, with immediate support around ₹1,424. Any price reaction near ₹1,430–₹1,435 could serve as an educational case for identifying intraday re-entry zones when price retests breakout areas. Traders should always apply strict stop-loss and risk management if trading live.
Final Outlook: Momentum: Strong, Trend: Bullish, Risk: Low, Volume: High
💡 Learning Note:
This case study helps learners understand how volume confirmation, RSI breakout, and price structure alignment can signal early trend continuation opportunities — a key concept in technical market reading.
________________________________________
⚠️ Disclosure & Disclaimer (SEBI-Compliant)
This content is created solely for educational and informational purposes to help readers understand technical analysis and market structure.
It does not constitute investment advice, research recommendation, or a solicitation to buy or sell any security.
The author is not a SEBI-registered investment adviser or research analyst.
All charts, patterns, and levels are based on personal study and historical data available from public sources such as TradingView and NSE India.
Position Status: No active position in ADANIPORTS at the time of publication.
Trading and investing involve risk. Market movements can be unpredictable, and losses may exceed invested capital.
Readers are strongly advised to consult a SEBI-registered investment adviser before making any trading or investment decisions.
By engaging with this post, you acknowledge that you take full responsibility for your own trades, decisions, and outcomes.
________________________________________
💬 Found this useful?
🔼 Boost this post to support structured learning content.
✍️ Share your thoughts, questions, or observations — let’s grow together!
🔁 Share with learners and traders to promote responsible market education.
👉 “If you liked this breakdown, follow for more disciplined, educational trade setups.”
🚀 Stay Calm. Stay Clean. Trade With Patience.
Trade Smart | Learn Zones | Be Self-Reliant 📊
________________________________________

STWP Analysis | ICICI Bank Showing Classic Breakout Behavior________________________________________
💼 ICICI BANK (NSE: ICICIBANK) | CMP ₹1436.60 (+1.36%)
Sector: Banking & Financial Services | Date: 19 Oct 2025
________________________________________
📊 Chart Summary
ICICI Bank closed strong at ₹1436.60, gaining +1.36% from its previous close of ₹1417.30.
Price made a high of ₹1439.60 — exactly around the Fibonacci resistance zone of ₹1439.85.
Volumes surged to 1.76x the average, with 1.70 crore shares traded against an average of 1.35 crore — indicating strong participation and renewed interest.
________________________________________
🟡 Technical Indicators Summary (Yellow Label Insight)
The chart highlights Bullish Momentum supported by a Strong Bullish Candle, indicating renewed buying interest.
A clear RSI breakout (68.36) confirms strengthening momentum, while the Bollinger Band breakout signals expanding volatility — often a precursor to a sharp directional move.
MACD at 8.33, CCI at 203.06, and Stochastic at 96.91 collectively point to short-term strength, while VWAP at 1427.77 serves as immediate support.
This confluence of volume + structure + volatility aligns perfectly for a potential breakout continuation.
________________________________________
📈 Price Action & Key Levels
The stock has been moving within a base range of ₹1342.6 – ₹1500, and has now approached the upper resistance band.
Immediate Resistance: 1447 / 1458 / 1476
Immediate Support: 1418 / 1400 / 1390
VWAP: 1427.77
A sustained close above 1439.60–1440 can confirm a bullish breakout, with upside potential toward 1466.30 → 1500 zone.
________________________________________
🧭 STWP Trade Analysis
Bias: Bullish
Breakout Level: Above 1439.60
Intraday Support: 1428
Swing Support: 1384
Intermediate Support: 1342
Momentum: Moderate
Trend: Bullish
Risk: Low
Volume: High
📌 Observation: The candle structure suggests a “volume-backed breakout” that may see short-term profit-booking near 1447 but remains structurally bullish if above VWAP.
________________________________________
🧾 Quick View: Q2 FY26 Results Snapshot
ICICI Bank reported a 5% YoY rise in PAT to ₹12,359 crore, supported by a 7.4% rise in Net Interest Income (₹21,529 crore) and improved asset quality.
Lower provisions and healthy loan growth kept the bottom line stable, while core operating profit rose 6.5% YoY.
With a clean balance sheet and improving credit metrics, the results complement the ongoing bullish technical setup — reinforcing confidence in trend continuation.
________________________________________
🧩 Final Outlook
ICICI Bank exhibits bullish momentum with low-risk positioning.
The current move represents a technical + fundamental confluence breakout, supported by strong volumes and improving financial health.
Traders may watch for price action near 1439–1447 zone for confirmation and potential swing continuation toward ₹1500 in the coming sessions.
________________________________________
🧠 Learning Note (Educational Purpose)
This setup perfectly demonstrates how volume expansion + momentum oscillator alignment + earnings strength often precedes meaningful breakouts in large-cap banking stocks.
Always track VWAP & RSI stability post-breakout — they often determine whether the move sustains or fades.
________________________________________
⚠️ Disclosure & Disclaimer (SEBI-Compliant)
This content is created solely for educational and informational purposes to help readers understand technical analysis and market structure.
It does not constitute investment advice, research recommendation, or a solicitation to buy or sell any security.
The author is not a SEBI-registered investment adviser or research analyst.
All charts, patterns, and levels are based on personal study and historical data available from public sources such as TradingView and NSE India.
Position Status: No active position in ICICIBANK at the time of publication.
Trading and investing involve risk. Market movements can be unpredictable, and losses may exceed invested capital.
Readers are strongly advised to consult a SEBI-registered investment adviser before making any trading or investment decisions.
By engaging with this post, you acknowledge that you take full responsibility for your own trades, decisions, and outcomes.
________________________________________
💬 Found this useful?
🔼 Boost this post to support structured learning content.
✍️ Share your thoughts, questions, or observations — let’s grow together!
🔁 Share with learners and traders to promote responsible market education.
👉 “If you liked this breakdown, follow for more disciplined, educational trade setups.”
🚀 Stay Calm. Stay Clean. Trade With Patience.
Trade Smart | Learn Zones | Be Self-Reliant 📊

ASIANPAINT – Bullish Rest Zone Setup | Watch 2537–2500 🎨 ASIAN PAINTS LTD (NSE: ASIANPAINT)
Sector: Paints & Coatings | CMP: 2,516.00 | View: Bullish Rest Zone Setup
Key Levels
Resistance: 2575 / 2615 / 2640
Support: 2500 / 2478 / 2442
STWP Trade Analysis:
Stock has moved up almost 9% in the last 4 days.
Currently, the stock is resting within a tight consolidation range after a wide bullish bar, forming a Bullish Rest Zone between 2,537.10 and 2,500.70.
Two possible scenarios:
🟢 Scenario 1 – Bulls Take Charge: I would buy @ 2537.10 with a stop at around 2498.40
View: Fresh momentum supported by volume breakout, clear structural strength, and a smooth candle recovery pattern.
🔴 Scenario 2 – Bears Take Charge: I would sell at 2500.70 with a stop at around 2539.4
View: Short-term pullback setup toward 2478–2450 if price loses 2500 zone.
───────────────────────────────────────────────
⚠️ **DISCLOSURE & DISCLAIMER (SEBI-Compliant)**
───────────────────────────────────────────────
📘 **Purpose:**
This content is created **solely for educational and informational purposes** to help readers understand market structure, price action, and technical analysis.
It does **not constitute investment advice**, research recommendation, or a solicitation to buy or sell any security.
👤 **Author Disclosure:**
The author is **not a SEBI-registered investment adviser or research analyst.**
All chart studies, price levels, and observations are based on publicly available data (e.g., **NSE India**, **TradingView**) and are presented purely for **learning illustration**.
📊 **Position Status:**
No active position in * * at the time of publication.
“The author may sometimes trade in the securities discussed, but such trades are independent and shared here only for educational understanding.”
⚠️ **Risk Disclosure:**
Trading and investing involve financial risk. Market movements can be unpredictable, and losses may exceed invested capital.
Readers are strongly advised to consult a **SEBI-registered investment adviser** before making any trading or investment decisions.
🧠 **Responsibility Clause:**
By engaging with this post, you acknowledge that you are **solely responsible for your own trading or investment decisions**, and that this content is intended only for **market education and awareness**.
───────────────────────────────────────────────
💬 **Did You Find This Useful?**
If this analysis helped you understand price structure or market psychology better:
🔼 **Boost** to support transparent & structured financial education.
✍️ **Comment** your insights, observations, or questions — let’s learn together.
🔁 **Share** this post with learners and aspiring traders who value discipline.
📚 **Follow stwp** for more structured, educational breakdowns on stocks & setups.
🚀 *Stay Calm. Stay Clean. Trade With Patience.*
💡 *Trade Smart | Learn Zones | Be Self-Reliant.*
───────────────────────────────────────────────

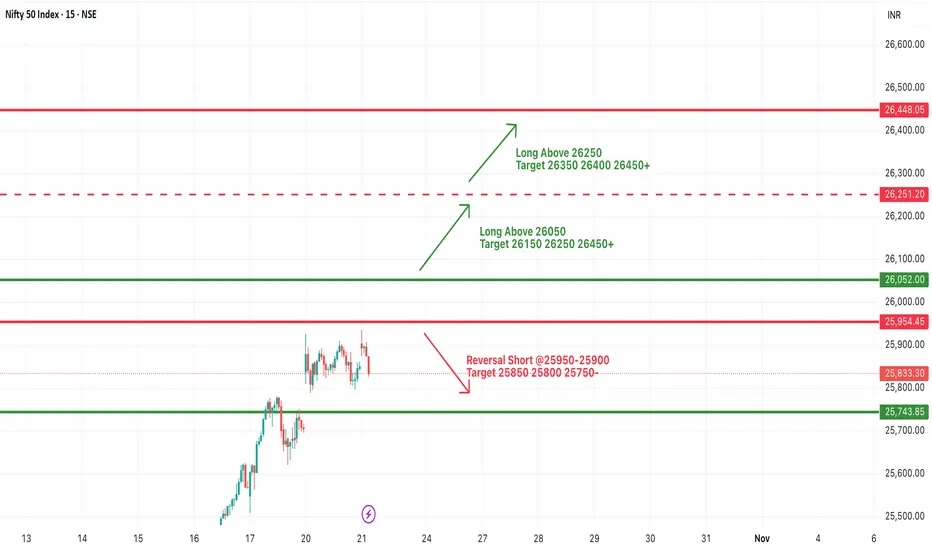
#NIFTY Intraday Support and Resistance Levels - 24/10/2025Nifty is likely to open flat near the 25,850–25,880 zone, suggesting a neutral to cautious sentiment after recent volatility. The index is trading around a crucial support zone, and today’s session will be key in determining whether the market finds stability or continues its corrective move.
If Nifty sustains above 25,900–25,950, we can expect a gradual recovery toward 26,050, 26,150, and 26,250+ levels. A breakout above 26,050 may bring renewed buying momentum, potentially leading to a short-term trend reversal.
On the downside, immediate support lies near 25,750–25,700. A breakdown below this level could invite selling pressure, dragging the index toward 25,600 and 25,500 zones.
Overall, a flat opening indicates indecision among traders after recent swings. It’s advisable to trade with confirmation near breakout or breakdown levels and use strict stop losses to manage intraday volatility effectively.

[INTRADAY] #BANKNIFTY PE & CE Levels(24/10/2025)Bank Nifty is likely to open flat near the 57,950–58,000 zone, indicating a balanced sentiment after recent volatility. The index is currently hovering around a key support area, and today’s price action will determine whether it finds strength for a rebound or continues its downward correction.
If Bank Nifty sustains above 58,050–58,100, we may see a mild upside move toward 58,250, 58,350, and 58,450+ levels. Sustained momentum above 58,450 could trigger short covering and push the index higher toward 58,600+ levels.
On the downside, immediate support lies near 57,950–57,900. A breakdown below 57,950 could lead to a deeper fall toward 57,750, 57,650, and 57,550–57,500 zones.
Overall, a flat opening suggests a cautious start, with traders awaiting a clear breakout or breakdown from the current range. It’s advisable to wait for confirmation near key levels before initiating fresh positions and to maintain a strict stop loss to manage intraday volatility effectively.

SELLOFF IMMINENT GOLD TRAPP Final Warning Before $4000 COLLAPSEWelcome Traders! The Gold market (XAU/USD) is tightly constrained, and the pressure from the USD, combined with the technical breakdown risk, makes the SHORT scenario our highest conviction trade!
1. Sharp Technical Analysis
The H1 chart confirms a Bearish Consolidation structure after the steep drop from $4,370$. The price is locked in a high-stakes "No-Trade Zone".
Dominant Trend: BEARISH (following the breakdown of the Double Top pattern at $4,100$).
Consolidation Range (No-Trade Zone): Price is squeezed between $4,005 (Support) and $4,159 (Resistance).
Bear Flag Warning: A highly probable Bear Flag pattern is forming, suggesting an explosive downside move upon breakout.
Action Mandate: WAIT FOR THE BREAKDOWN CONFIRMATION!
2. Fundamental Analysis: USD Fueling the Drop
USD Strength: The USD sustained its upward momentum, increasing the burden on Gold. While a slight pullback occurred at the US open, the overall positive USD momentum remains a significant bearish factor.
Impact: Consistent USD demand makes a decisive break above $4,159$ highly unlikely. This heavily favors the scenario where Gold breaches the critical $4,000$ support.
3. MAIN TRADING PLAN: Breakdown Scenario (SHORT)
We are setting the trap to execute the SELL trade immediately upon the decisive breach of the $4,005$ Support.
Activate SHORT: Breakdown below $4,005$. Confirm with an H1 candle closing decisively beneath this level.
STOP-LOSS (SL): $4,159$. Placed safely above the No-Trade Zone Resistance.
TAKE-PROFIT 1 (TP1): $3,955.772. The next structural support target.
TAKE-PROFIT 2 (TP2): $3,889.251. The final objective, aligning with the larger pattern target.
Contingency Scenario (LONG)
Activate LONG: ONLY if Gold decisively breaks $4,159$ (Breakout Zone) and targets $4,332.127.
Note: This is a counter-trend, high-risk trade requiring massive news to justify.
Community Interaction 🚀
Are you ready for the break? Will Gold collapse to $3,889$ or surprise us with a break of $4,159$?
Drop your priority scenario NOW! 👇

NIFTY Breakout from Broadening Wedge – Is a Big Rally Ahead?The Nifty 50 index has recently broken out of a Broadening Wedge Pattern, signaling a potentially powerful upward move. This breakout is significant as it comes after weeks of wide-range consolidation within expanding trendlines—a classic sign of increasing volatility and market indecision that typically resolves with an explosive move.
The wedge's upper resistance, which acted as a ceiling near the 25,900–26,000 zone, has finally been breached with strong bullish momentum. This breakout confirms that buyers have taken control, overcoming the supply pressure at the top of the wedge. Such a breakout, especially from a broadening formation, often leads to sharp directional rallies as trapped short-sellers cover positions and new momentum traders enter long.
Using the height of the wedge, the projected upside has been clearly mapped out. The immediate targets post-breakout are:
Target 1: 26,250
Target 2: 26,450
Target 3: 26,750
Final Projected Target: 26,950+
Each of these levels offers potential resistance where short-term consolidation or partial profit booking may occur. However, if the broader sentiment remains bullish and global cues support the move, Nifty could comfortably approach or even exceed the final projected target in the coming sessions.
The breakout also invalidates the earlier bearish scenario of a fall back into the wedge. As long as Nifty holds above the breakout zone (now turned support), the bullish structure remains intact. This zone—around 25,900—is now a critical level to watch for any retest. If the index revisits this level and finds buying interest, it will further strengthen the breakout’s credibility.
Volume confirmation, strong follow-up candles, and broader sectoral participation will be key to sustaining the rally. Traders should also keep an eye on global market trends, USDINR, and bond yields, as they may influence sentiment at higher levels.
In summary, Nifty has decisively broken out of a broadening wedge—an event that opens the door to a fresh leg of rally. The pattern suggests a potential upside of 800–1,100 points from the breakout level, with bulls firmly in control unless price falls back below the wedge resistance. It’s time to ride the trend, but with calculated risk and disciplined trailing stop-losses.

#NIFTY Intraday Support and Resistance Levels - 23/10/2025Nifty is expected to open with a gap up above the 26,050 level, indicating strong bullish sentiment and follow-through momentum from recent sessions. The index has been maintaining higher highs and higher lows, showing sustained buying interest from market participants.
If Nifty holds above 26,050–26,100, it could extend gains toward 26,150, 26,250, and 26,450+ levels. A breakout above 26,250 will confirm a strong bullish continuation, paving the way for a further rally toward 26,600+ levels in the short term.
On the downside, immediate support lies near 25,950–25,900. A dip below this zone could trigger intraday profit booking, dragging the index toward 25,850 and 25,750 levels.
Overall, the sentiment remains positive with a gap-up opening expected above 26,050, supported by steady momentum. Traders should look for buy-on-dip opportunities, keeping a trailing stop loss below 25,900 to safeguard profits and manage risk effectively.
[INTRADAY] #BANKNIFTY PE & CE Levels(23/10/2025)Bank Nifty is expected to open with a gap up near the 58,500 level, continuing its positive sentiment from the previous session. The index has shown resilience after recent consolidations, and a strong gap-up opening could attract fresh buying interest if key resistance levels are sustained.
If Bank Nifty holds above 58,550–58,600, we may see an upward move toward 58,750, 58,850, and 58,950+ zones. Sustained strength above 58,950 could trigger a sharp breakout rally toward 59,200+ levels in the coming sessions.
On the downside, the immediate support zone is around 58,050–58,000. A fall below 57,950 could invite short-term profit booking, pulling the index toward 57,750, 57,650, and 57,550 levels.
Overall, the sentiment remains bullish with a gap-up opening near 58,500, but traders should monitor intraday price action around the 58,600 zone for breakout confirmation. It’s advisable to use a trailing stop loss and book partial profits at every target level to manage volatility effectively.

GOLD RECOVERS: H1 Bounces at $4,150 – Sniping the Fibo SELL Zone🎯 Macro Summary & Bias: Weak USD & CPI Focus Drive Recovery
Gold price gained some traction in early European trading on Wednesday, recovering above the $4,150 level.
Primary Driver: The weaker US Dollar (USD) is currently supporting the price recovery.
Mixed Forces: Easing US-China trade tensions are putting some pressure on Gold, but this is offset by Fed rate cut expectations and general market uncertainty, which should limit the downside.
Key Event: Traders are keenly focused on the US CPI (Consumer Price Index) inflation report for September this Friday. Any sign of hotter-than-expected US inflation could lift the USD and pressure Gold in the short term.
Technical Bias: After the DOUBLE TOP DUMP and a +3000 PIPS move down, the market is now attempting a corrective rally. Our strategy is to SELL the strong Fibo/Volume resistance (Sell on Rally) before looking for the next BUY zone.
📊 In-Depth Technical Analysis (H1): Pinpointing the FIBO Reaction Levels
Based on the recent major market reversal from the Double Top and the current corrective bounce (Referencing image_43ce7f.png), we have our strategic levels:
1. Strategic SELL Zones (FIBO SELL REACT ZONES):
These are the primary resistance zones for executing SELL trades, anticipating the continuation of the post-dump correction:
REACTION FIBO 0.5 ZONE - SELL ZONE 4190 - 4200: This is the first critical resistance zone (0.5 Fibo retracement) to look for a Short entry.
REACTION FIBO - SELL ZONE BIG VOLUME for SELL SIDE 4300 - 4310: This is the major supply/liquidity zone and the ultimate target for the current corrective rally.
2. Strategic BUY Zone (ORDER BUY REACT ZONE):
This is the key support area where the previous dump found temporary relief, which we use for stop-loss or potential re-entry:
ORDER BUY ZONE 4100 - 4090: This is the immediate support zone formed after the dump, which is currently holding the price.
📈 TODAY'S ACTION PLAN
Primary Action (Prioritize SELL on Rally): Wait for the corrective bounce to reach the REACTION FIBO 0.5 ZONE - SELL ZONE 4190 - 4200.
Short Entry: Execute the SELL entry upon confirmed reversal candles (H1/M30/M15) in the 4190 - 4200 zone.
Targets (TP): Aim to retest the recent low and the LIQUIDITY PUMP area.
Contingency BUY: If price breaks decisively above 4200, the rally may extend to the BIG VOLUME SELL ZONE 4300 - 4310.
⚠️ Risk Warning
Risk Management: Place Stop Loss (SL) above the 4200 zone for the short entry. Watch the US CPI report on Friday closely, as inflation data could cause extreme volatility.
Wishing all FranCi$$_FiboMatrix traders a disciplined and victorious day!

Bitcoin – Buying the Trendline, Not the HypeBitcoin (BTCUSD) continues to respect its rising trendline structure , showing consistent demand on every retest. This type of price action often reveals where smart money is quietly adding positions, not chasing, but accumulating near support.
Each of the highlighted points shows how price has respected this trendline multiple times, forming a clean series of higher lows. As long as this level holds, the broader direction remains bullish.
Currently, BTC is testing this key support once again. I’m positioning near the trendline because the risk is clearly defined , and the potential reward toward 111K+ remains wide open.
Short-term volatility can still appear, but structure beats emotions . As long as buyers defend this zone, we may see another impulsive leg forming soon.
Disclaimer: This analysis is for educational purposes only. It’s not investment advice. Always do your own research before trading.

Candlestick Secrets Traders Never Tell YouDiscover candlestick patterns hidden in plain sight and master their true power like never before
Charts used in this Video are over 3 months old

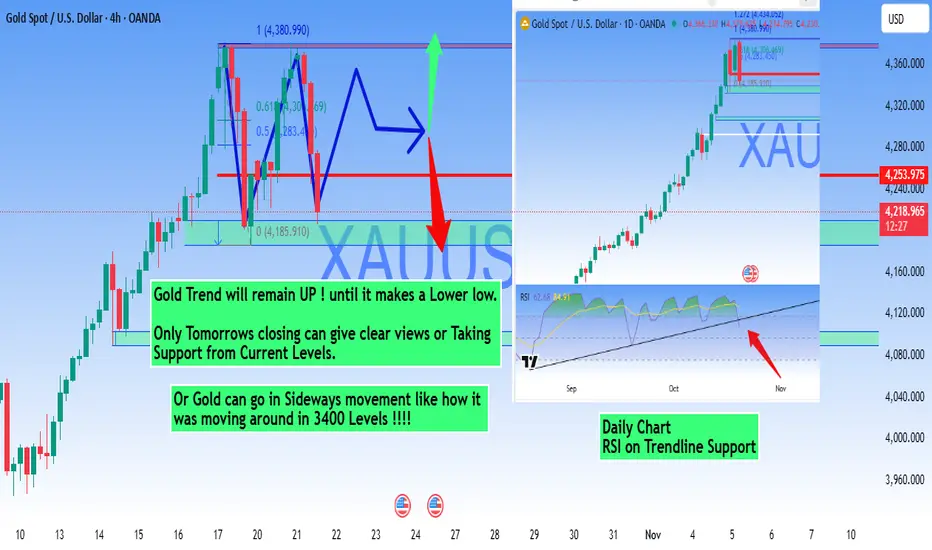
#xuausd Make or Break - Gold Analysis🥇 GOLD (XAU/USD) - Technical Analysis & Outlook
Timeframe: 4H & Daily Charts
Current Price: 2,718.99
Market Structure Analysis
Gold is currently in a **strong uptrend** and will maintain its bullish bias until it forms a clear lower low. The recent consolidation near all-time highs suggests a potential for either continuation or a sideways movement phase.
Key Price Levels
Support Zones
- Immediate Support: 4,218.99 - 4,240.00
- Major Support: 4,185.91 (0 Fibonacci - Recent Low)
- Critical Support: 4,160.00 - 4,180.00 zone
Resistance Zones
- Immediate Resistance: 4,253.97 (Current High)
- Next Resistance: 4,280.00 - 4,300.00
- Target Extension: 4,320.00 - 4,360.00
- Major Target: 4,380.99 (Fibonacci Extension)
Technical Scenarios
- Continuation of the current uptrend expected
- Any pullback to support zones presents buying opportunities
- Target: 4,280 - 4,360 zone
- Extended Target: 4,380+ levels
Consolidation Scenario (Secondary)
Condition: Sideways movement similar to the 3,400 consolidation phase
- Gold may enter a ranging phase at current elevated levels
- Watch for sideways movement between 4,200 - 4,280
- Accumulation pattern before next leg up
- Patience required during this phase
🔴 Bearish Scenario (Alternative)
Condition: Only if price breaks and closes below 4,185
- Bearish only on confirmed break of structure
- Potential retracement to $4,160 or lower
- Wait for clear reversal signals before shorting
RSI Analysis (Daily Chart)
- RSI Position: Near trendline support (around 62)
- Signal: RSI holding above trendline support indicates continued bullish momentum
- Watch For: RSI breakdown below trendline would signal weakening momentum
- Strength: RSI still in bullish territory, no divergence observed
Key Observations
1. **Strong Uptrend Intact:** No lower lows formed yet, trend remains bullish
2. **Fibonacci Levels:** Price respecting key Fibonacci retracement zones
3. **Consolidation Pattern:** Similar behavior to previous $3,400 consolidation
4. **Volume Profile:** Accumulation visible near support zones
5. **Daily RSI:** Holding trendline support, maintaining bullish structure
Critical Points to Monitor
🔸 22/10/2025 Close: Will provide clearer direction
🔸 Support Level: 4,218 - Must hold for bullish continuation
🔸 RSI Trendline: Break would signal momentum shift
🔸 Volume: Watch for increasing volume on moves
🔸 Global Events: Fed policy, geopolitical tensions, USD strength
🎓 #Trading Wisdom
"The #trend is your friend until it bends. #Gold will remain #bullish until it makes a #lowerlow. Stay patient, follow the structure, and let the market show its hand."*
Risk Disclaimer
This analysis is for educational purposes only and should not be considered financial advice. Always manage your risk appropriately, use stop losses, and never risk more than you can afford to lose. Past performance does not guarantee future results.
Like and Follow for Daily Gold Analysis!
#Gold #XAUUSD #GoldTrading #TechnicalAnalysis #ForexTrading #PreciousMetals #TradingView #MarketAnalysis
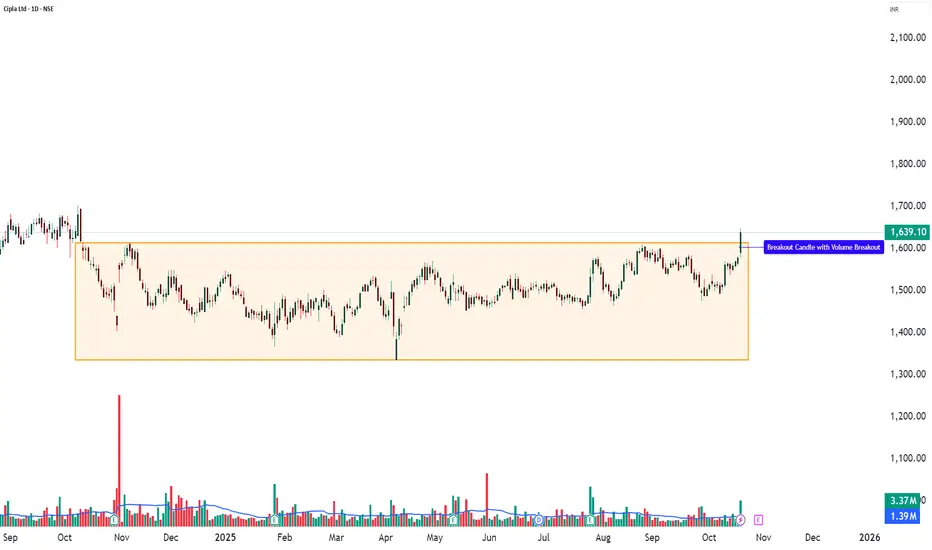
CIPLA – 10-Day Volume Breakout | Bullish Continuation Setup💹 Cipla Ltd (NSE: CIPLA)
Sector: Pharmaceuticals | CMP: ₹1,639.10 | View: Bullish Continuation Setup
🔹 Technical Analysis / Chart Pattern / Price Action / Volume Analysis:
Cipla Ltd shows strong bullish momentum with a clear breakout candle supported by a significant volume surge of 3,372,906 shares, compared to its 20-day average of 1,386,709 shares — a rise of over 2.4 times. This confirms fresh institutional buying and genuine participation behind the move. The open-equals-low formation reflects strong buyer control from the start, while a Bollinger Band breakout with a BB squeeze-off signals that volatility compression has ended, hinting at a sharp upward continuation. The RSI breakout further supports growing momentum, and consistent volume expansion validates trend strength. Overall, the setup represents a bullish continuation structure, where price, volume, and momentum align perfectly — a textbook example of a powerful breakout phase supported by conviction buying.
🔹 Key Levels:
Resistance: 1665 / 1690 / 1733
Support: 1566 / 1537 / 1498
🔹 STWP Trade Analysis:
Bias: Bullish
Breakout Level: 1647
Intraday Support: 1620
Swing Support: 1553
Intermediate Support: 1535
🔹 HNI Trade Analysis:
Possible Accumulation Level: 1639 - 1647
Possible Low Levels: 1629
Support Levels: 1624 - 1606
🔹 Final Outlook:
Momentum: Moderate | Trend: Neutral | Risk: Low | Volume: High
🔹 Learning Note (Educational Purpose):
This setup is a great example of how a breakout with strong volume and RSI confirmation can signal a shift from consolidation to momentum. It helps learners understand that when price, volume, and indicators align together, it often leads to a trend continuation phase. Always observe how volume expands during breakouts — it’s one of the strongest clues of institutional activity.
🔹 STWP Mentor Note:
A clean breakout backed by strong volume is not just a signal — it’s a lesson in patience and timing. Smart traders wait for clarity, not noise. As a learner, focus on identifying structure, strength, and sustainability in every move. Remember, every breakout teaches discipline — stay consistent, study reactions, and always trade with patience and purpose.
───────────────────────────────────────────────
⚠️ **DISCLOSURE & DISCLAIMER (SEBI-Compliant)**
───────────────────────────────────────────────
📘 **Purpose:**
This content is created **solely for educational and informational purposes** to help readers understand market structure, price action, and technical analysis.
It does **not constitute investment advice**, research recommendation, or a solicitation to buy or sell any security.
👤 **Author Disclosure:**
The author is **not a SEBI-registered investment adviser or research analyst.**
All chart studies, price levels, and observations are based on publicly available data (e.g., **NSE India**, **TradingView**) and are presented purely for **learning illustration**.
📊 **Position Status:**
No active position in * * at the time of publication.
“The author may sometimes trade in the securities discussed, but such trades are independent and shared here only for educational understanding.”
⚠️ **Risk Disclosure:**
Trading and investing involve financial risk. Market movements can be unpredictable, and losses may exceed invested capital.
Readers are strongly advised to consult a **SEBI-registered investment adviser** before making any trading or investment decisions.
🧠 **Responsibility Clause:**
By engaging with this post, you acknowledge that you are **solely responsible for your own trading or investment decisions**, and that this content is intended only for **market education and awareness**.
───────────────────────────────────────────────
💬 **Did You Find This Useful?**
If this analysis helped you understand price structure or market psychology better:
🔼 **Boost** to support transparent & structured financial education.
✍️ **Comment** your insights, observations, or questions — let’s learn together.
🔁 **Share** this post with learners and aspiring traders who value discipline.
📚 **Follow stwp** for more structured, educational breakdowns on stocks & setups.
🚀 *Stay Calm. Stay Clean. Trade With Patience.*
💡 *Trade Smart | Learn Zones | Be Self-Reliant.*
───────────────────────────────────────────────
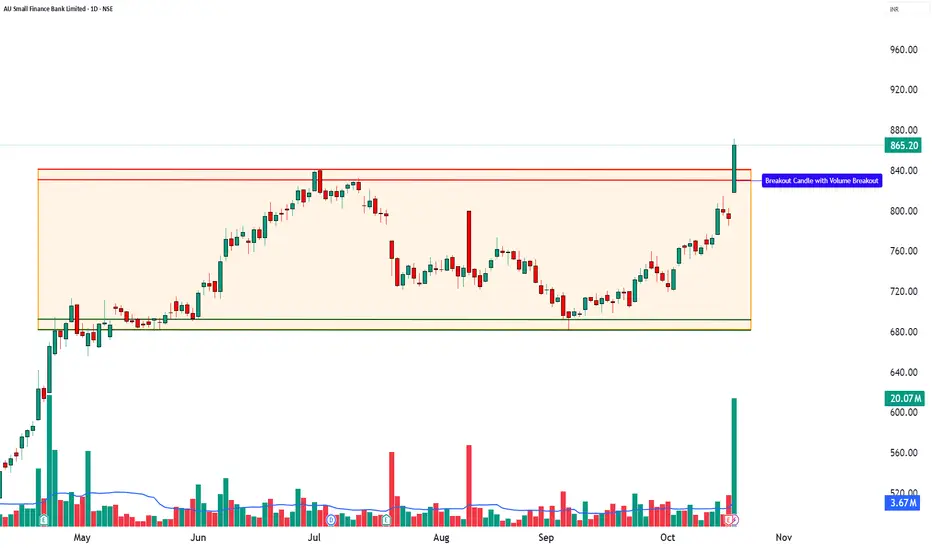
AUBANK – 52-Week Breakout with Strong Volume💹 A.U. Small Finance Bank Ltd (NSE: AUBANK)
Sector: Banking & Finance | CMP: ₹865.20 | View: Bullish Momentum Setup
🔹Price Action:
A.U. Small Finance Bank showed strong upward movement with a big green candle and very high trading volume. The stock opened at its lowest point and kept rising all day, which means buyers were in full control. It also made a new 52-week high, showing that momentum and confidence are strong. In simple words, the stock is breaking out with power, and buyers are clearly leading the trend.
🔹 Technical Analysis:
AUBANK is showing strong bullish momentum with a clear 52-week breakout, signaling fresh buying interest and strong confidence among traders. The big green candle with open-equals-low formation shows that buyers were active right from the start of the session. The RSI at 81 reflects strong momentum, while MACD at 9.35 confirms a positive crossover, adding to the bullish view. Similarly, CCI at 258 and Stochastic at 96 indicate powerful buying pressure, suggesting that the uptrend is well-supported. The VWAP at ₹855.39 is acting as an important support level, helping the price stay stable even during intraday pullbacks. Meanwhile, a Bollinger Band breakout and a BB squeeze-off pattern hint that the stock may continue its sharp upward move. Altogether, the indicators show a well-supported bullish setup, ideal for short to medium-term swing trades.
🔹 Volume Analysis:
The stock saw a huge rise in trading volume — almost 5 times higher than normal! This is a strong sign that big investors or institutions are showing interest. Such a jump in both price and volume means the breakout is real and reliable, not just a short-term move. This kind of volume confirms fresh buying and positive sentiment, suggesting the stock could stay strong for some time.
🔹 Chart Analysis:
For months, AUBANK was moving sideways between ₹680 and ₹840. Now, it has broken above ₹840 with heavy volume, showing that the stock has ended its consolidation phase and started a new bullish trend. This breakout shows that buyers are taking charge, and if the volume remains high, the stock may continue to move upward in the coming sessions.
🔹 Demand Zone: ₹814 – ₹785
This area acts as a strong demand zone, where earlier buying interest was visible. If the price revisits this zone, it may attract fresh accumulation or renewed buying activity. Traders and learners can observe this region for potential re-entry setups once the price shows signs of stability or reversal — purely for educational understanding of demand zone behavior in momentum setups.
🔹 Key Levels:
Resistance: 885/905/939
Support: 832/798/778
🔹 STWP Trade Analysis:
Bias: Bullish
Breakout Level: 872
Intraday Support: 851
Swing Support: 783
Intermediate Support: 680
Observation:
🔹 Final Outlook:
Momentum: Moderate | Trend: Neutral | Risk: High | Volume: High
The setup shows strong bullish signs but comes after a sharp rally, so short-term volatility can be expected. Sustained volume above ₹850 will keep the trend positive.
🔹 Learning Note (Educational Purpose):
This setup is a good example of how volume + breakout candles signal a shift in momentum. It teaches traders that when price breaks resistance with strong volume, it often marks the beginning of a new trend rather than the end of one. Always confirm with RSI/MACD alignment for reliability.
🔹 STWP Mentor Note:
Momentum trading works best when price, structure, and volume align together. Always look for clean breakouts backed by heavy volume — they tell you where smart money is moving. As a trader, focus more on learning price behavior than just chasing the move. Every breakout teaches patience, confidence, and timing — three pillars of successful trading.
───────────────────────────────────────────────
⚠️ **DISCLOSURE & DISCLAIMER (SEBI-Compliant)**
───────────────────────────────────────────────
📘 **Purpose:**
This content is created **solely for educational and informational purposes** to help readers understand market structure, price action, and technical analysis.
It does **not constitute investment advice**, research recommendation, or a solicitation to buy or sell any security.
👤 **Author Disclosure:**
The author is **not a SEBI-registered investment adviser or research analyst.**
All chart studies, price levels, and observations are based on publicly available data (e.g., **NSE India**, **TradingView**) and are presented purely for **learning illustration**.
📊 **Position Status:**
No active position in * * at the time of publication.
“The author may sometimes trade in the securities discussed, but such trades are independent and shared here only for educational understanding.”
⚠️ **Risk Disclosure:**
Trading and investing involve financial risk. Market movements can be unpredictable, and losses may exceed invested capital.
Readers are strongly advised to consult a **SEBI-registered investment adviser** before making any trading or investment decisions.
🧠 **Responsibility Clause:**
By engaging with this post, you acknowledge that you are **solely responsible for your own trading or investment decisions**, and that this content is intended only for **market education and awareness**.
───────────────────────────────────────────────
💬 **Did You Find This Useful?**
If this analysis helped you understand price structure or market psychology better:
🔼 **Boost** to support transparent & structured financial education.
✍️ **Comment** your insights, observations, or questions — let’s learn together.
🔁 **Share** this post with learners and aspiring traders who value discipline.
📚 **Follow STWP** for more structured, educational breakdowns on stocks & setups.
🚀 *Stay Calm. Stay Clean. Trade With Patience.*
💡 *Trade Smart | Learn Zones | Be Self-Reliant.*
───────────────────────────────────────────────
AdityaBirlaCapital - Investment IdeasAditya Birla Capital Ltd - Technical Analysis
Simple Technical Analysis Summary
Aditya Birla Capital is breaking out from a multi-year resistance zone with a classic and perfect rounding bottom pattern playing out on the monthly timeframe.
Fibonacci targets have been activated!
Key Technical Observations
1. Multi-Year Rounding Bottom Pattern
The stock has completed a textbook rounding bottom formation spanning multiple years. This is one of the most reliable bullish reversal patterns in technical analysis, indicating a fundamental shift from bearish to bullish sentiment.
2. Breakout from Multi-Year Resistance
After years of consolidation and base building, the stock has successfully broken out from a significant resistance zone around ₹255. This breakout signals the potential beginning of a new uptrend cycle.
3. Monthly Timeframe Confirmation
The pattern is forming and confirming on the monthly timeframe, which carries significantly more weight than shorter timeframes. Monthly breakouts tend to lead to sustained moves.
4. Fibonacci Extension Framework
Multiple Fibonacci extension levels have been identified and activated, providing a clear roadmap for potential price targets based on the measured move from the rounding bottom pattern.
#Fibonacci Extension Target Levels
Based on the rounding bottom pattern measurement and Fibonacci extensions:
- Target 1: 314.20 (1.272 Fibonacci Extension)
- Target 2: 345.10 (1.414 Fibonacci Extension)
- Target 3: 389.90 (1.618 Fibonacci Extension)
- Extended Target: 472.00 (2.0 Fibonacci Extension)
Key Support Levels
- Immediate Support: 255.00 (Breakout level / Previous resistance turned support)
- Secondary Support: 171.86 (0.618 Fibonacci retracement)
- Critical Support: 146.17 (0.5 Fibonacci retracement)
- Base Support: 42.35 (Rounding bottom base)
- Pattern suggests long-term bullish structure - Risk-reward favorable for position building on dips
Risk Management:
- Maintain stoploss below 255 on monthly closing basis
- For aggressive traders: 240 (allowing some wiggle room)
- For conservative traders: 235 (below breakout zone)
Invalidation Level:
- Monthly close below 240 would weaken the bullish structure
- Break below 220 would invalidate the immediate bullish setup
DISCLOSURE & RISK WARNING:
This analysis is provided for educational and informational purposes only and should not be construed as financial advice, investment recommendation, or an offer to buy or sell securities. Past performance is not indicative of future results.

Hindpetro Long - Investment IdeaHindustan Petroleum (HINDPETRO) - Monthly Chart Analysis
Current Price: 441.75
Major #Breakout in Progress
**Timeframe:** Monthly (Long-term View)
Key Technical Event:
🚀 Historic Breakout - Stock has broken above 2017 all-time high after 8 years of consolidation
- Breakout Level: 325.55
- Retest Zone: 410-420 - Currently retesting breakout
Hindpetro is Brewing for fresh new highs above ₹441
Target Projections based on #Patterns and #Fibonocci levels.
Interim Targets:
- Support holding at ₹416
- Immediate resistance: ₹480-500 zone
Short Term Targets:
- Tgt 1: 530
- Tgt 2: 657
Extended Targets: 593-629
Technical Significance:
- **8-year base breakout** = High probability of sustained uptrend
- Monthly trend reversal confirmed
- Trading well above long-term moving average
- Volume-supported breakout suggests institutional accumulation
Risk Management:
- Stop Loss: Below 410 on monthly closing basis
- Key Support: 325 (previous resistance now support)
Outlook:
After breaking a major multi-year resistance, HINDPETRO is consolidating gains and positioning for the next leg up. Patient accumulation recommended on dips toward ₹410-420.
This is for educational purposes only.* Do your Own analysis before taking Trade.

Gold Retracement After 200-Point Fall — Watch for a Rejection!Price Action in Focus | Short Setup on Key Resistance Zone
Gold (XAUUSD) posted a sharp 200-point drop from the all-time high at 4380 on Friday. The current move looks like a technical retracement, not a reversal — a classic dead-cat bounce scenario? 🐈📉
📍 Key Resistance Zone: 4280 – 4300
Price is now testing this zone, which previously acted as a breakdown level. If sellers step in here, we could see another leg lower.
🔍 Short Bias Setup (Not Financial Advice):
🧭 Sell Zone: 4280 – 4300
❌ Invalidation (SL): Above 4321
🎯 Targets: 4241 and 4221
💬 Watching for bearish confirmation before executing — candle wicks, volume spike, or RSI divergence could seal the deal.
⚠️ This is a technical idea, not financial advice. Always manage risk and confirm with your own strategy.
🔔 Follow for live chart updates, breakdowns & strategy threads!
Your feedback drives our content and keeps everyone trading smarter. Let’s make those pips together! 🚀
Happy Trading,
– The InvestPro Team

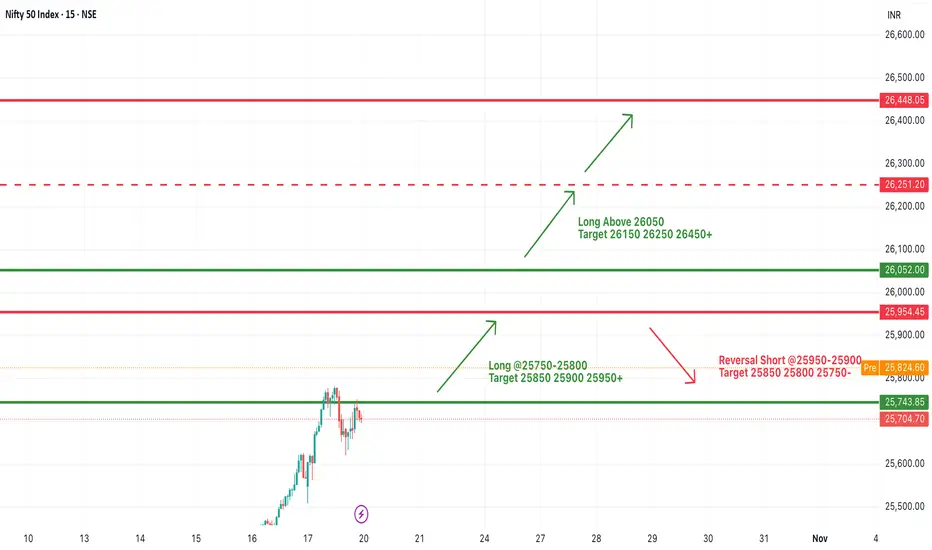
#NIFTY Intraday Support and Resistance Levels - 20/10/2025Nifty is expected to open with a gap up near the 25,950 level, reflecting sustained bullish momentum and strong follow-through buying from previous sessions. The index is approaching a key resistance zone, and today’s price action will be crucial in determining whether it can extend the uptrend or witness short-term consolidation.
If Nifty sustains above 25,950–26,000, it may rally further toward 26,050, 26,150, and 26,250+ levels. A breakout above 26,450 will confirm continued strength, opening the path toward 26,600+ levels.
On the downside, immediate support lies near 25,750–25,700. A fall below this level could trigger mild profit booking, pulling the index toward 25,600 and 25,450 zones.
Overall, the sentiment remains bullish with a gap up opening near 25,950, but traders should monitor price action closely around the 26,000–26,050 zone for signs of breakout or reversal. Maintaining a trailing stop loss and booking partial profits near resistance levels is advisable to safeguard gains in volatile intraday movements.
[INTRADAY] #BANKNIFTY PE & CE Levels(20/10/2025)Bank Nifty is likely to open with a gap up above the 58,000 zone, indicating continued bullish sentiment and follow-through momentum from last week’s rally. The index is consolidating near a breakout area, suggesting that buyers are still in control, but a decisive move above resistance is needed for further strength.
If Bank Nifty sustains above 58,050–58,100, it may trigger an upside rally toward 58,250, 58,350, and 58,450+ levels. A breakout above 58,550–58,600 will add fresh momentum, opening the path toward 58,750, 58,850, and 58,950+ zones.
On the downside, immediate support is placed near 57,750–57,700. A fall below this level could invite short-term profit booking, dragging the index toward 57,650, 57,550, and 57,450 levels.
Overall, the sentiment remains positive with a gap up opening expected above 58,000, but traders should watch for sustained buying above 58,100 to confirm bullish continuation. Maintaining a trailing stop loss and booking partial profits at key resistance levels is advised to protect gains in case of intraday reversals.

M&M Breaks Out with Volume Support | Structure Meets Momentum________________________________________
🚙 MAHINDRA & MAHINDRA LTD (NSE: M&M) | CMP ₹3,647.20 (+2.43%)
Sector: Auto | Date: 19 Oct 2025
________________________________________
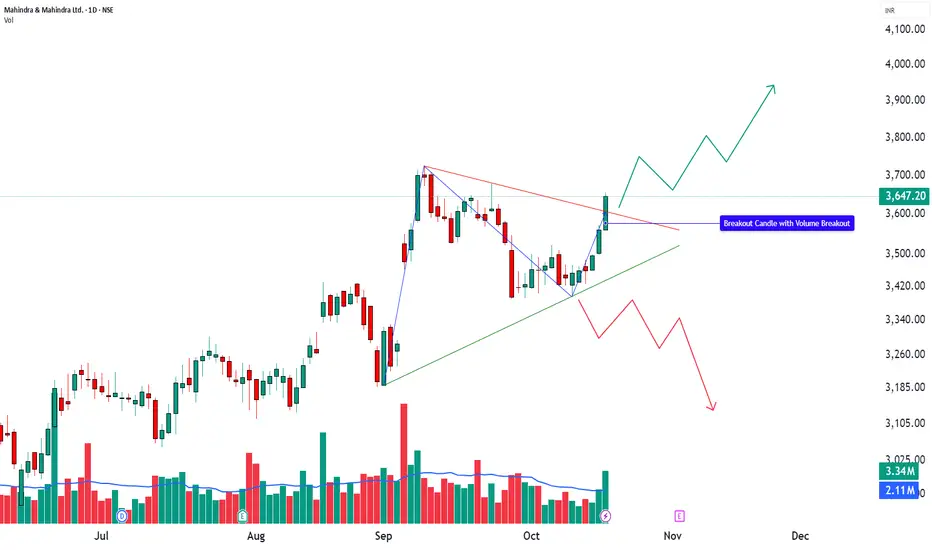
🔹 Price Action:
M&M posted a strong bullish candle, closing near day’s high at ₹3,647.20 with gains of +2.43%.
Volume surged to 3.34M shares, nearly 2.2× the 20-day average volume (2.10M) — a clear sign of institutional and HNI participation.
The stock confirmed a bullish breakout above ₹3,656, marking a shift from a phase of consolidation to one of expansion.
________________________________________
🔹 Technical Analysis:
Momentum indicators are clearly aligned in favour of the bulls, confirming strength across multiple parameters. RSI (65.55) has broken above its midline, signalling momentum expansion, while MACD (9) shows a positive crossover that reinforces directional conviction. CCI (129.03) reflects sustained trend acceleration, and though Stochastic (96.65) remains in overbought territory, it supports ongoing breakout momentum. The VWAP at ₹3,629.84 acts as an immediate dynamic support, maintaining short-term control with buyers. Additionally, a Bollinger Band breakout accompanied by a BBSqueeze-Off indicates expanding volatility — often a precursor to a strong continuation phase when combined with rising volume and structural breakout confirmation.
________________________________________
🔹 Chart Analysis:
M&M broke out from a symmetrical triangle structure, ending a multi-week consolidation phase.
The breakout candle formed with a wide body and heavy volume, closing near the high — a typical sign of breakout conviction.
Price structure shows higher lows and rising volume, confirming trend continuation rather than exhaustion.
________________________________________
🔹 Key Levels:
Resistance: 3,682 / 3,717 / 3,778
Support: 3,586 / 3,525 / 3,490
VWAP: 3,629.84
A short-term pullback toward VWAP or ₹3,586 could act as a healthy retest before continuation.
Holding above ₹3,525 will keep the structure intact, maintaining bullish control.
________________________________________
🔹 STWP Trade Analysis:
Bias: Bullish
Breakout Level: ₹3,656
Intraday Support: ₹3,619
Swing Support: ₹3,456
Intermediate Support: ₹3,421
Momentum: Strong
Trend: Bullish
Risk: Low
Volume: High
📌 Observation: The breakout candle supported by rising volume and MACD confirmation signals a trend continuation setup with clearly defined risk zones.
________________________________________
🔹 HNI Trade Setup:
Fresh HNI accumulation seen around ₹3,647–₹3,656, supported at ₹3,501, and additional buying interest visible near ₹3,639 with support at ₹3,475.
This structure indicates layered accumulation, suggesting that larger players are positioning within the consolidation rather than chasing price above resistance.
________________________________________
🔹 Final Outlook:
Momentum: Strong | Trend: Bullish | Risk: Low | Volume: High
M&M’s structure indicates a breakout-driven continuation phase backed by volume and indicator alignment.
As long as price holds above ₹3,525, the trend bias remains bullish, with scope for upside toward ₹3,717–₹3,778 in the near term.
A dip toward VWAP or EMA supports would represent healthy price normalization, not weakness.
________________________________________
🔹 Learning Note (Educational Purpose):
This setup showcases how volume + structure + indicator confluence confirms a genuine breakout.
It also demonstrates how smart money accumulates during compression, not after expansion — a crucial lesson for breakout traders.
M&M provides a textbook example of how post-consolidation breakouts evolve into expansion phases.
________________________________________
🔹 STWP Mentor Note:
“Momentum isn’t about chasing; it’s about recognizing conviction early.
M&M’s breakout is a fine example of structure, participation, and patience working in perfect rhythm — where price doesn’t just move, it evolves with purpose.”
________________________________________
───────────────────────────────────────────────
⚠️ **DISCLOSURE & DISCLAIMER (SEBI-Compliant)**
───────────────────────────────────────────────
📘 **Purpose:**
This content is created **solely for educational and informational purposes** to help readers understand market structure, price action, and technical analysis.
It does **not constitute investment advice**, research recommendation, or a solicitation to buy or sell any security.
👤 **Author Disclosure:**
The author is **not a SEBI-registered investment adviser or research analyst.**
All chart studies, price levels, and observations are based on publicly available data (e.g., **NSE India**, **TradingView**) and are presented purely for **learning illustration**.
📊 **Position Status:**
No active position in * * at the time of publication.
“The author may sometimes trade in the securities discussed, but such trades are independent and shared here only for educational understanding.”
⚠️ **Risk Disclosure:**
Trading and investing involve financial risk. Market movements can be unpredictable, and losses may exceed invested capital.
Readers are strongly advised to consult a **SEBI-registered investment adviser** before making any trading or investment decisions.
🧠 **Responsibility Clause:**
By engaging with this post, you acknowledge that you are **solely responsible for your own trading or investment decisions**, and that this content is intended only for **market education and awareness**.
───────────────────────────────────────────────
💬 **Did You Find This Useful?**
If this analysis helped you understand price structure or market psychology better:
🔼 **Boost** to support transparent & structured financial education.
✍️ **Comment** your insights, observations, or questions — let’s learn together.
🔁 **Share** this post with learners and aspiring traders who value discipline.
📚 **Follow @STWP** for more structured, educational breakdowns on stocks & setups.
🚀 *Stay Calm. Stay Clean. Trade With Patience.*
💡 *Trade Smart | Learn Zones | Be Self-Reliant.*
───────────────────────────────────────────────