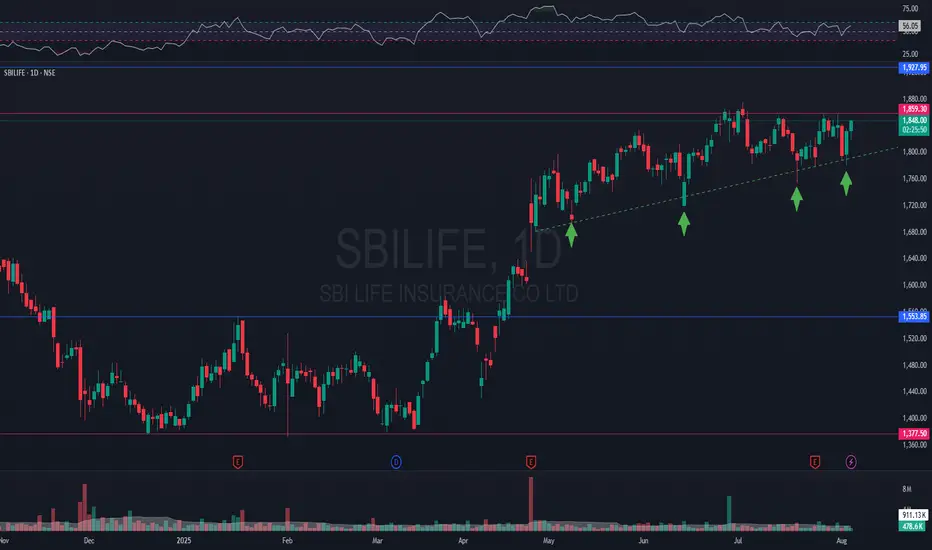
Ascending Triangle Breakout on #SBILIFE#SBILIFE is showing clear signs of a strong breakout from current levels.
The ascending trendline has supported the price since 09MAY25. The price continued to hold near the levels of 1855, with every red candle bought in.
Yesterday, i.e. 04AUG15 was a good day to initiate accumulation. In our view, price is expected to move sharply once the daily/weekly candle closes above 1860 with supporting volumes.
Technical Analysis
BTC Price Action: Bulls vs BearsBTC Price Action: Bulls vs Bears
Bitcoin has shown a gradual recovery after a prolonged corrective phase, with market structure leaning toward a constructive buildup. Fundamentally, sentiment is influenced by global macro conditions—investors are watching U.S. monetary policy signals, while stable demand from institutions and long-term holders continues to provide a supportive backdrop. On-chain activity remains steady, with balanced exchange inflows and outflows suggesting no extreme directional pressure in the near term.
From a technical perspective, the market has shifted momentum from bearish flows into a developing bullish sequence. The recent break of structure on the 4H timeframe highlights strengthening upside intent, though price is still moving within a broader accumulation phase. Current flows suggest the possibility of a short-term dip for liquidity before continuation to higher levels, aligning with the overall constructive weekly outlook.

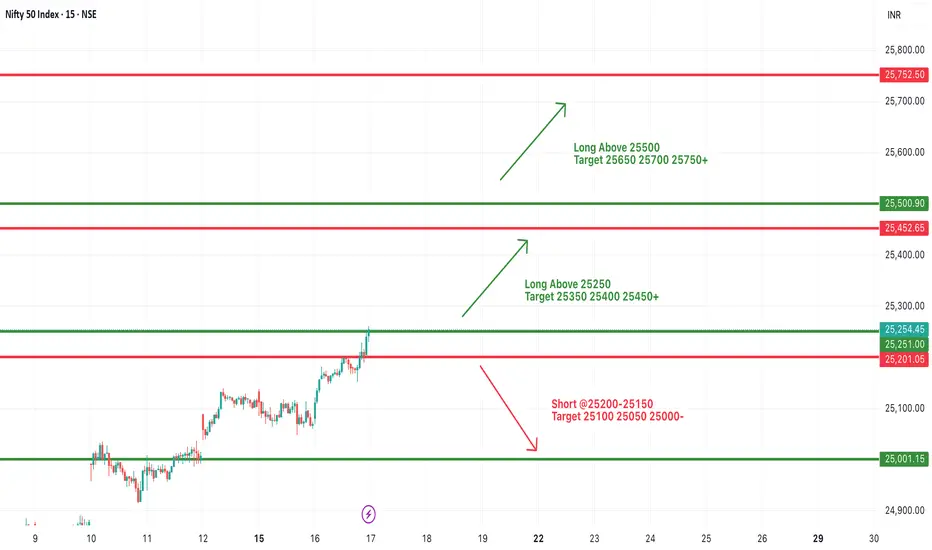
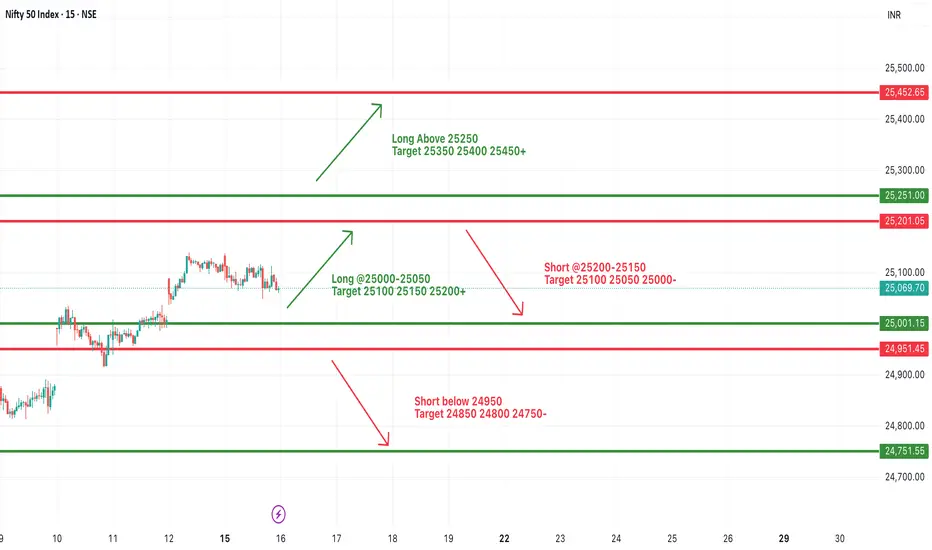
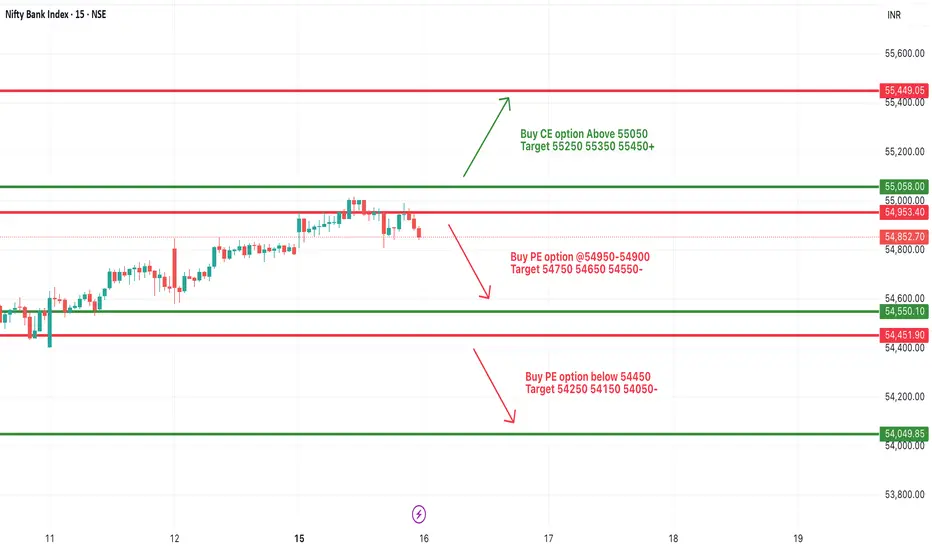
#NIFTY Intraday Support and Resistance Levels - 17/09/2025Today’s session begins with a gap-up opening across both Nifty and Bank Nifty, reflecting strong bullish sentiment.
For Bank Nifty, the index is likely to open near 55,500 levels. Sustaining above 55,050–55,100 can trigger further upside momentum toward 55,250, 55,350, and 55,450+. A breakout above 55,550 will add strength, paving the way toward 55,750–55,950+. On the downside, immediate support lies at 54,950–54,900, and a break below may push prices lower to 54,750–54,550-.
For Nifty, the index is expected to open near 25,400 levels. A move above 25,250 can fuel bullish momentum toward 25,350, 25,400, and 25,450+. If it manages to break and hold above 25,500, then higher targets at 25,650–25,750+ come into play. On the downside, support is seen around 25,200–25,150, and a breach below could invite selling pressure, dragging it toward 25,100–25,000-.
Overall, both indices are showing bullish setups with gap-up openings, but profit booking around resistance zones cannot be ruled out. Traders are advised to follow breakout levels with strict stop-losses and trail profits as targets are achieved.
FED shaken by politics | Gold eyes new ATH🟡 XAU/USD – 16/09 | Captain Vincent ⚓
🔎 Captain’s Log – News Context
FED & US Politics :
S. Miran elected to the FED Board but still serves as Trump’s economic advisor → concerns FED may face White House influence.
Michelle Mills elected with a narrow 48–47 margin.
Appeals Court blocked Trump from firing L. Cook, affirming FED’s independence, but raising the risk of a legal battle at the Supreme Court.
US Economy :
6:30 AM (US time): Retail Sales release – key consumer spending indicator.
Probability of a -50bps FED cut this week is down to 1.2% , nearly ruled out. FED is almost certain to deliver -25bps next week.
⏩ Captain’s Summary : Politics create noise, but the macro backdrop (FED easing + weak US data) remains the tailwind supporting Gold’s journey toward new ATH.
📈 Captain’s Chart – Technical Analysis
Storm Breaker (Resistance / Sell Zone) :
3706 – 3714 (Fibonacci resistance)
3722 – 3724 (Strong Sell Zone, potential ATH test)
Golden Harbor (Support / Buy Zone) :
FVG Dock: 3666 – 3668
OB Harbor: 3643 – 3645
Strong Low: 3611 (deep support)
Market Structure :
After a series of BoS , Gold broke out of sideways EqH/EqL and surged.
Preferred scenario: retrace to FVG 3666 , then bounce toward 3714 – 3722.
If 3722 breaks successfully → confirms new ATH and extends bullish momentum.
🎯 Captain’s Map – Trade Plan
✅ Buy (priority)
Buy 1 (FVG)
Entry: 3666 – 3668
SL: 3657
TP: 3690 – 3706 – 3714 – 372x
Buy 2 (OB)
Entry: 3643 – 3645
SL: 3632
TP: 3666 – 3700 – 3714 – 372x
⚡ Sell (short scalp at resistance)
Sell Zone
Entry: 3722 – 3724
SL: 3732
TP: 3714 – 3706 – 3690
⚓ Captain’s Note
“The Golden ship has broken free from sideways waters and is heading toward new peaks. Golden Harbor 🏝️ (3666 – 3643) is the safe dock for sailors to gather strength before sailing further. Storm Breaker 🌊 (3722 – 3724) is the big wave, suitable only for short Quick Boarding 🚤 . With dovish winds from the FED, the Golden sails are set toward new ATH.”

LT - Technical & Trade Analysis📊 Larsen & Toubro (L&T) – Technical & Trade Analysis
________________________________________
1️. Price Action
L&T has displayed a powerful bullish move, closing at ₹3,667.80 (+2.28%) with a strong green candle on the daily chart. The price has broken above the neckline at 3,649, which coincides with the 0.786 Fibonacci retracement level, confirming a bullish reversal from recent lows. With this breakout, the stock is now well-placed to test higher levels at ₹3,731, ₹3,802, and eventually ₹3,931, while key support zones remain intact near ₹3,615 – ₹3,535. This price action clearly indicates a shift in momentum from weakness to strength.
Key Levels:
🔴 Resistance: 3696.83 | 3725.87 | 3777.73
🟢 Support: 3615.93 | 3564.07 | 3535.03
________________________________________
2️. Volume Analysis
The bullish breakout is strongly validated by volume data. On the breakout day, L&T recorded a traded volume of 2,928,060 shares, which is more than 2.38 times its 20-day average volume (1,376,896 shares). Such a significant spike in activity signals institutional buying and strong market participation, a hallmark of reliable breakouts. A VolX reading of 2.38 highlights that the move is not a random uptick but a surge backed by heavy accumulation, adding conviction to the ongoing rally.
________________________________________
3️. Technical Indicators
The technical setup offers multiple confirmations for the bullish bias. The yellow-tagged highlights show that the stock has given an RSI breakout, MACD crossover, Bollinger Band breakout, bullish VWAP signal, and a BB squeeze release, all pointing towards the start of a momentum expansion phase. Additionally, the multi-timeframe indicator table on the top right reinforces this view: Stochastic and CCI are bullish across daily and weekly timeframes, while the MACD is bullish on daily and weekly but still bearish on the monthly, hinting at some caution for long-term investors. Meanwhile, RSI at 61 signals healthy strength without yet entering overbought territory. Together, these indicators align to support the short-term bullish momentum in L&T.
________________________________________
4. Latest Update
Larsen & Toubro (L&T) has been in the spotlight recently with a series of significant developments. The company’s Heavy Civil Infrastructure vertical secured a “significant” order worth ₹1,000–2,500 crore from NPCIL for the Kudankulam Nuclear Power Project (Units 5 & 6) in Tamil Nadu, while it also bagged a major contract from NHSRCL to construct 156 km of ballastless track for the Mumbai–Ahmedabad bullet train corridor. On the flip side, L&T has expressed its intent to exit the Hyderabad Metro Phase I operations citing financial and operational challenges and confirmed it will not participate in the Phase II expansion. Financially, the company posted nearly 30% YoY profit growth in Q1FY26, supported by strong execution and a robust order book, further boosted by these fresh wins. Meanwhile, Chairman S. N. Subrahmanyan highlighted long-term succession planning and clarified remarks on work culture that recently drew public debate.
________________________________________5. Investment Outlook
📈 Bullish Case – Why L&T could go up
Breakout above neckline with volume confirmation
RSI & MACD both turning positive on Daily
Strong support zone at 3615–3560 ensures limited downside
Sectoral rotation into infra/engineering plays could fuel upside
📉 Bearish Case – Potential downside risks
Heavy resistance around ₹3,731–₹3,777 (previous supply zone)
If it fails to hold above ₹3,649, profit booking may drag it back to ₹3,585 / ₹3,535
Macro headwinds (interest rate or project delays) could stall the momentum
⚡ Momentum Case – Short-term Trading Edge
Current move shows "Buy Today – Sell Tomorrow" setup
Entry @ ₹3,674, SL @ ₹3,590.44, Target 1: ₹3,757.56, Target 2: ₹3,841.12
Risk Reward is favorable, supported by strong bullish volume
________________________________________
📅 Short-term vs Long-term Perspective
Short-Term (Swing Trade): Strong bullish case, momentum intact, low risk with clear entry/SL/targets.
Medium-Term (1–3 months): Stock can test ₹3,900–₹4,000 zone if momentum sustains.
Long-Term: Monthly MACD still bearish; investors should add gradually only above ₹3,800+ confirmation.
________________________________________
📝 STWP Trade Analysis
📊 Daily Closing Basis Trade
Entry 3,674, SL 3,590.44, T1 3,757.56 (R:R 1:1), T2 3,841.12 (R:R 1:2).
📊 Swing Trade Setup
Entry 3,674, SL 3,545.40, T1 3,802.60 (R:R 1:1), T2 3,931.20 (R:R 1:2).
Pullback level for Intraday Traders: 3643
Pullback level for swing Traders: 3585
________________________________________
Final Outlook
Momentum: Strong | Trend: Bullish | Risk: Low | Volume: High
________________________________________
💡 Learning Note
This setup demonstrates the power of combining price action, Fibonacci levels, and volume confirmation. A bullish breakout above the neckline with heavy volume plus indicator alignment is one of the most reliable swing trade setups. Double Bottom breakouts with neckline retests + volume confirmation are among the highest probability setups in technical trading
________________________________________
📈 Chart Pattern Analysis
L&T on the daily timeframe has given a Double Bottom Pattern breakout, a classic bullish reversal setup. The two bottoms were formed near the 3,535–3,560 zone, showing strong demand absorption at that level. The neckline breakout came at 3,649, confirmed with a big green candle and 2.38× average volume, which validates institutional participation. This pattern indicates that sellers failed to push the stock lower twice, and buyers have now taken control, opening the path for higher targets. Based on the pattern projection, the upside potential extends towards 3,802 → 3,931, aligning with the Fibonacci extension levels.
⚠️ Disclaimer – Please Read Carefully
The information shared here is meant purely for learning and awareness. It is not a buy or sell recommendation and should not be taken as investment advice. I am not a SEBI-registered investment advisor, and all views expressed are based on personal study, chart patterns, and publicly available market data.
Trading — whether in stocks or options — carries risk. Markets can move unexpectedly, and losses can sometimes exceed the money you have invested. Past performance or past setups do not guarantee future results.
If you are a beginner, treat this as a guide to understand how the market works — practice on paper trades before risking real money. If you are experienced, always assess your own risk, position sizing, and strategy suitability before entering trades.
Consult a SEBI-registered financial advisor before making any real trading decision. By engaging with this content, you acknowledge full responsibility for your trades and investments.
💬 Found this useful?
🔼 Give this post a Boost to help more traders discover clean, structured learning.
✍️ Drop your thoughts, questions, or setups in the comments — let’s grow together!
🔁 Share with fellow traders and beginners to spread awareness.
👉 “If you liked this breakdown, follow for more clean, structured setups with discipline at the core.”
🚀 Stay Calm. Stay Clean. Trade With Patience.
Trade Smart | Learn Zones | Be Self-Reliant 📊

Multi-Pattern Mastery: Descending Triangle Meets Broadening FormThis chart demonstrates the power of multi-pattern recognition in technical study,showcasing how a descending triangle (white lines) can coexist with a broadening formation pattern (red ascending line with shared lower base). The descending triangle shows consistent lower highs against a stable support level, while the broadening pattern reveals expanding volatility through higher highs and the same lower boundary.
Patterns to Study :
Descending Triangles: Characterized by horizontal support and declining resistance, typically indicating bearish pressure building
Broadening Formations: Feature diverging trendlines creating a "megaphone" effect, signaling increased market volatility and indecision
Pattern Confluence: When multiple patterns share common elements (like the lower support base here), it creates stronger technical significance and potential reference points
Disclaimer: This content is for educational purposes only and does not constitute investment advice. Always conduct your own research before making any trading decisions.
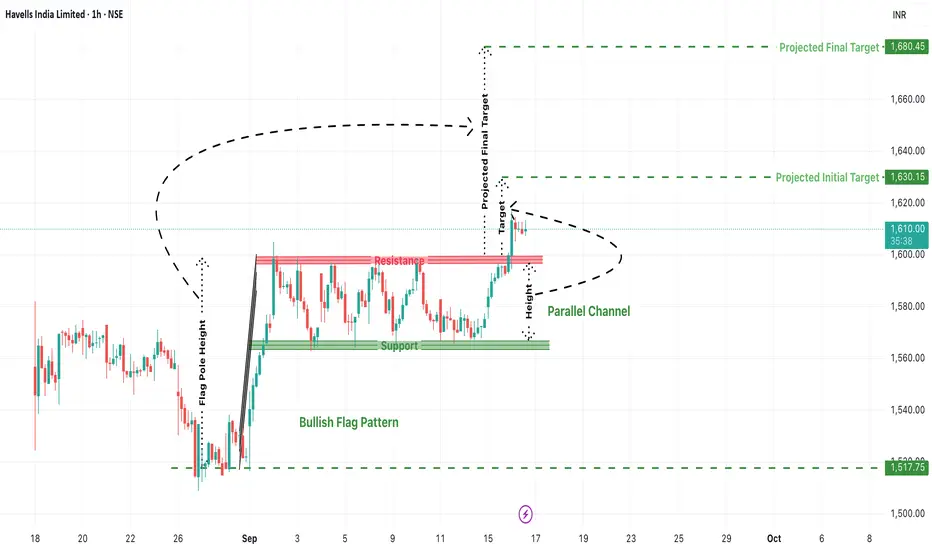
Havells Bullish Flag Breakout: Can We See a Rally to 1680+?Havells India Ltd. is currently showing a classic bullish technical setup—a Bullish Flag Pattern—that could lead to a potential breakout and strong upside movement in the short term. Traders who favor breakout-based strategies should pay close attention to this chart, especially considering the structured parallel channel and previous rally that preceded it.
1. Bullish Flag Pattern: Anatomy of the Setup
A bull flag is a continuation pattern that occurs after a sharp price rise (flagpole), followed by a period of consolidation within a narrow parallel channel (the flag). This structure typically suggests that the bullish trend will resume once the price breaks out of the flag range.
In Havells:
Flag Pole: The stock surged sharply from the 1517 zone to near 1610, forming a vertical rise.
Flag/Channel: Price moved sideways within a narrow support at ~1570 and resistance at ~1610, creating a clean parallel channel.
This shows price compression after a strong move, typically a sign of healthy consolidation before another leg up.
2. Breakout Levels and Price Action Confirmation
As per the current chart:
Havells has broken above the resistance zone around 1610, signaling a potential breakout.
The breakout candle is attempting to close above the red resistance band, and follow-up candles will be crucial to confirm strength.
A retest of this breakout zone could offer ideal long entries.
3. Projected Targets from the Pattern
Using the flagpole height, we can project upside targets from the breakout point:
Initial Target: ₹1630.15
A conservative target based on minor resistance and pole extension.
Final Projected Target: ₹1680.45
This marks the full measured move and could be achieved if the rally sustains momentum.
4. Ideal Trading Plan (For Traders)
Entry:
After confirmed breakout above ₹1610
Or on retest near ₹1600–1610 zone with bullish price action.
Stop Loss:
Below the flag support zone at around ₹1570
Aggressive traders can keep it below ₹1585.
Targets:
T1: ₹1630
T2: ₹1680+
Risk-Reward Ratio:
Minimum 1:2 depending on entry price.
5. Risk Scenarios to Watch For
False Breakouts: If the breakout doesn’t sustain and price falls back into the channel, it may trap early longs.
Macro Events: Broader market volatility (Nifty moves or global cues) can impact momentum.
Volume: Lack of volume on breakout candles can reduce conviction—always monitor volume to confirm strength.
Conclusion: Havells Looks Set for a Fresh Rally
This is a textbook bullish flag breakout in formation, with clear upside potential. If the momentum sustains, Havells could very well reach 1680+ in the coming sessions. However, traders must practice disciplined risk management, wait for confirmation, and avoid chasing without a proper plan.
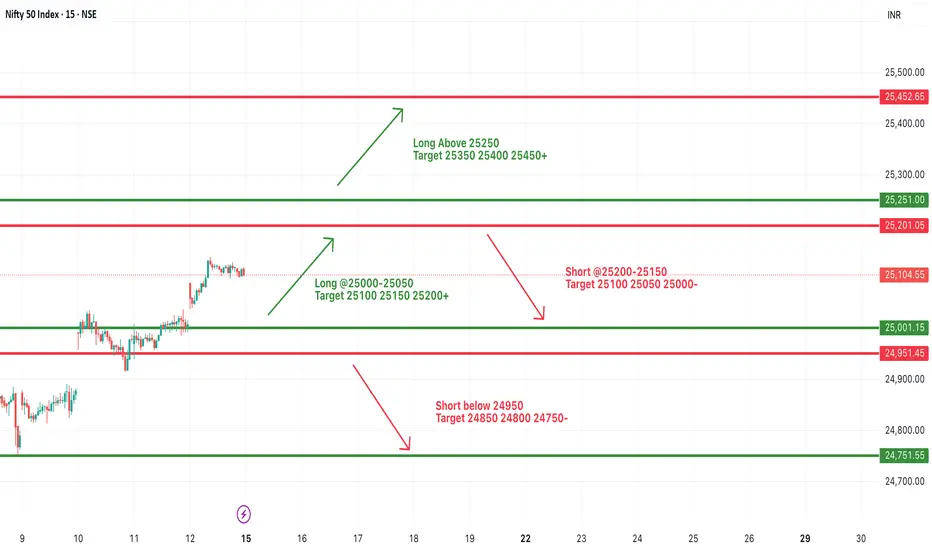
#NIFTY Intraday Support and Resistance Levels - 16/09/2025Nifty is expected to open on a flat note, with no major changes seen from yesterday’s levels. The market continues to hover within a defined range, suggesting that intraday traders should wait for a breakout or breakdown before taking fresh positions.
On the upside, fresh momentum can be seen if Nifty sustains above 25,000–25,050, opening the path toward 25,100, 25,150, and 25,200+. A stronger rally can only be expected once Nifty clears 25,250, which may push it further toward 25,350–25,450+.
On the downside, weakness may emerge if Nifty slips below 25,200–25,150, which could drag it toward 25,100, 25,050, and 25,000-. A further breakdown below 24,950 will intensify selling pressure, with targets at 24,850, 24,800, and 24,750-.
Overall, Nifty is in a consolidation phase, and traders should follow a wait-and-watch approach near key levels. A flat opening signals indecision, so risk management and quick profit booking will be crucial.
[INTRADAY] #BANKNIFTY PE & CE Levels(16/09/2025)Bank Nifty is likely to witness a flat opening, with price action expected to be range-bound around key levels. Traders should closely watch intraday movements for directional clarity.
On the upside, strength will be visible only if Bank Nifty sustains above 55,050, which can open the way for higher targets at 55,250, 55,350, and 55,450+. Until then, upside momentum may remain capped.
On the downside, a short trade can be considered around 54,950–54,900, with targets placed at 54,750, 54,650, and 54,550-. A deeper breakdown below 54,450 will intensify selling pressure, dragging the index toward 54,250, 54,150, and 54,050-.
Overall, Bank Nifty is in a neutral to cautious zone with a flat start. Traders should wait for confirmation near breakout or breakdown levels before entering fresh positions, while managing trades with strict stop-losses.
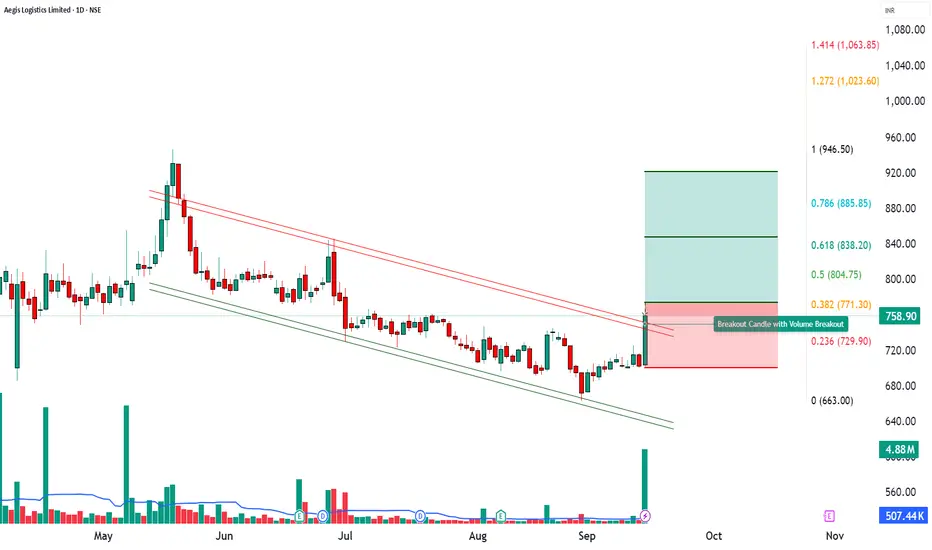
“Aegis Logistics | 20x Volume Breakout Signals Fresh Upside MomAegis Logistics Ltd (CMP: ₹758.90 | +8.07%)
🔎 Technical Outlook:
Aegis Logistics witnessed a 20-day volume breakout with an extraordinary 20X spike in price-volume activity, signaling strong market participation. The stock formed a powerful bullish candle, indicating robust momentum and accumulation interest.
The breakout above recent consolidation zones suggests the potential for a trend continuation if follow-up buying sustains.
________________________________________
📈 Key Levels:
Entry Zone: ₹774
Stop Loss: ₹700.25
Support Levels: 715.5 / 672.1 / 642.85
Resistance Levels: 788.15 / 817.4 / 860.8
Major Resistance Zone: ₹946 – ₹995
________________________________________
🎯 Upside Targets:
Target 1 → ₹847.75
Target 2 → ₹921.50
Target 3 → ₹995.25
Target 4 → ₹1,069
________________________________________
⚡ Why Bullish?
20-Day & 52-Week Volume Breakout confirmation
RSI, Stochastic & MACD supporting bullish bias on daily & weekly charts
Strong momentum candle near breakout zone
Rising interest seen from institutional volumes
________________________________________
📢 Summary:
Aegis Logistics is entering a high-momentum zone. Sustaining above ₹774 can trigger multi-level rallies toward ₹921–₹1,069 in the coming sessions. However, a dip below ₹700 will negate this bullish structure.
📰 Latest News
Aegis Logistics shares surged ~10% in a single day, driven by strong volumes. It was the stock’s highest single-day gain since March. Trading volume hit a four-month high (~31 lakh shares) much above its 20-day average. Business Today
The stock exceeded its 50-day moving average around ₹724, touching resistance zones around ₹763 to ₹772 (100- & 200-day moving averages). Business Today
Additional longer-term news: The joint-venture Aegis Vopak Terminals (AVTL) is planning a ₹2,800 crore IPO to reduce debt and fund expansion; Aegis Logistics has ~50.1% stake in that JV. The Economic Times
Also, an in-principle approval for a new LPG siding (rail facility) at Panambur (New Mangalore Port) for AEGIS Vopak was granted by Palakkad railway division. This could improve LPG logistic flows. The Times of India
📈 Investment Outlook
Aegis Logistics delivered a strong 20-day volume breakout (VolX ≈ 20x) with a sharp bullish candle. Technical momentum plus upcoming catalysts like the JV IPO and new LPG siding approval are fueling sentiment.
________________________________________
📈 Bullish Case – Why the stock could go up
High-volume breakout (20x average) signals institutional accumulation.
Momentum indicators: RSI 63, CCI 177, Stochastic 86 – still bullish.
Sustaining above ₹774 can open upside toward ₹847 – ₹921 initially, then ₹995 – ₹1069.
Positive news: JV IPO plans and LPG siding approval provide structural growth drivers.
📉 Bearish Case – Potential downside risks
Resistance near ₹788 – ₹817 may trigger profit booking.
Failure to sustain above ₹774 could lead to correction back toward ₹729 – ₹715.
Sectoral risks: energy/logistics costs, regulatory delays may hurt sentiment.
⚡ Momentum Case – Short-term Trading Edge
20x volume + bullish MACD on daily and weekly = strong near-term edge.
Bollinger Band breakout adds volatility momentum.
Holding ₹774 may fuel a rally toward ₹847 – ₹921 in 2–5 sessions.
📅 Short-term vs Long-term Perspective
Short-term (1–2 weeks): Test of ₹847–₹921 likely; supports 729–715 are critical.
Long-term (1–3 months): Sustained breakout plus IPO news flow can re-rate stock higher toward ₹995–₹1069.
________________________________________
⚠️ Disclaimer – Please Read Carefully
The information shared here is meant purely for learning and awareness. It is not a buy or sell recommendation and should not be taken as investment advice. I am not a SEBI-registered investment advisor, and all views expressed are based on personal study, chart patterns, and publicly available market data.
Trading — whether in stocks or options — carries risk. Markets can move unexpectedly, and losses can sometimes exceed the money you have invested. Past performance or past setups do not guarantee future results.
If you are a beginner, treat this as a guide to understand how the market works — practice on paper trades before risking real money. If you are experienced, always assess your own risk, position sizing, and strategy suitability before entering trades.
Consult a SEBI-registered financial advisor before making any real trading decision. By engaging with this content, you acknowledge full responsibility for your trades and investments.
💬 Found this useful?
🔼 Give this post a Boost to help more traders discover clean, structured learning.
✍️ Drop your thoughts, questions, or setups in the comments — let’s grow together!
🔁 Share with fellow traders and beginners to spread awareness.
👉 “If you liked this breakdown, follow for more clean, structured setups with discipline at the core.”
🚀 Stay Calm. Stay Clean. Trade With Patience.
Trade Smart | Learn Zones | Be Self-Reliant 📊
Gold faces early selling pressure | Main trend still Buy🟡 XAU/USD – 15/09 | Captain Vincent ⚓
🔎 Captain’s Log – News Context
FED rate cut probabilities this week :
-25bps : 96.4% (up from 89.1%).
-50bps : only 3.0% (down sharply from 10.9%).
Trump : Announced more sanctions on Russia, urged NATO to stop buying Russian oil; also emphasized “the possibility of significant FED rate cuts.”
Key event today : New York Manufacturing Index at 1:30 (US time).
⏩ Captain’s Summary : The sharp drop in -50bps expectations caused early selling pressure on Gold this morning. But overall, FED is still certain to cut rates and inflation is cooling → the bigger trend continues to favor Buy .
📈 Captain’s Chart – Technical Analysis
Storm Breaker (Resistance / Sell Zone) : 3665 – 3670 (Weak High & upper cap).
Golden Harbor (Support / Buy Zone) : 3623 – 3603 – 3587.
Market Structure :
On H1, Gold is moving within a tightening triangle with EqH and EqL .
Main trend stays bullish, but needs a retest of support before rallying toward 3665 – 3670.
🎯 Captain’s Map – Trade Plan
✅ Buy (priority)
Buy Zone 1
Entry: 3623 – 3625
SL: 3612
TP: 3640 – 3650 – 3660 – 3665+
Buy Zone 2 (FVG)
Entry: 3603 – 3605
SL: 3592
TP: 3620 – 3640 – 3655 – 3665
Deep Buy Zone
Entry: 3587 – 3590
SL: 3575
TP: 3610 – 3630 – 3650
⚡ Sell (short scalp at resistance)
Sell Zone
Entry: 3665 – 3670
SL: 3678
TP: 3655 – 3645 – 3635 – 36xx
⚓ Captain’s Note
“The Golden ship faces headwinds this morning as sailors reduce expectations for a -50bps cut. But the larger sail remains filled with dovish FED winds, steering the voyage north. Golden Harbor 🏝️ (3623 – 3603 – 3587) is the safe dock to gather strength. Storm Breaker 🌊 (3665 – 3670) may raise waves, suitable for short Quick Boarding 🚤 . The main journey still favors Buy , waiting for the FED to blow more tailwind into the Golden sails.”

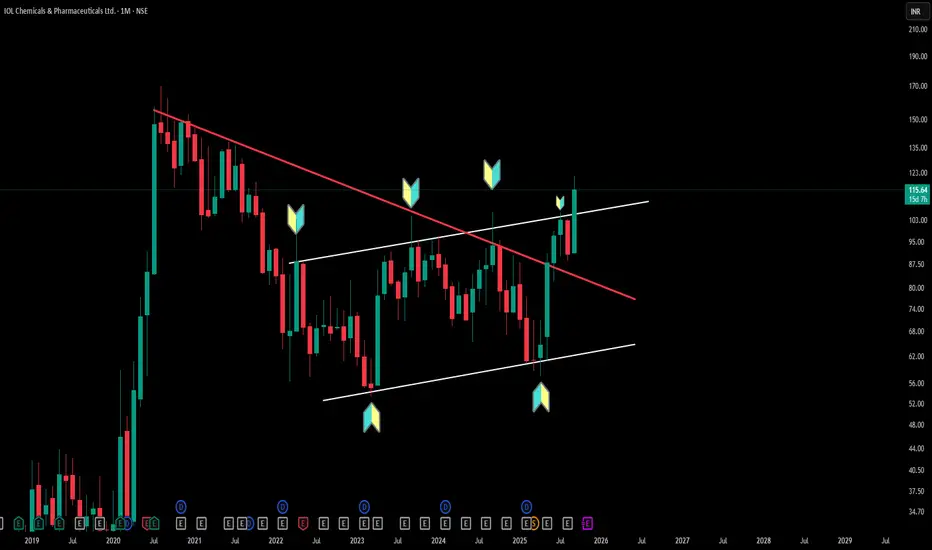
Multi-Pattern Insights: Triangle & Channel Structures (Timeframe: Monthly)
IOLCP's monthly chart perfectly demonstrates how triangle patterns (converging trendlines creating compression) can coexist with parallel channel patterns (equidistant support/resistance lines). Triangle formations indicate price consolidation with diminishing volatility, while parallel channels show consistent bounce zones between defined boundaries.
This multi-timeframe view reveals how experienced chartists identify multiple technical structures within a single timeframe—enhancing pattern recognition skills. Understanding these foundational concepts helps distinguish between different consolidation types and their structural characteristics.
Disclaimer: This analysis is for educational purposes only and does not constitute investment advice. Always conduct your own research before making any trading decisions.
#NIFTY Intraday Support and Resistance Levels - 15/09/2025Nifty is set for a gap up opening near 25,200, signaling continuation of its strong upward momentum. The index is now trading close to a crucial resistance zone where intraday direction will be decided based on breakout or rejection.
On the upside, fresh long positions can be initiated around 25,000–25,050, with immediate targets placed at 25,100, 25,150, and 25,200+. A sustained move above 25,250 will further strengthen the bullish sentiment, paving the way for targets at 25,350, 25,400, and 25,450+.
On the downside, support is seen near 24,950. A break below this zone may trigger short positions, dragging the index toward 24,850, 24,800, and 24,750- levels. A reversal short near 25,200–25,150 is also possible if Nifty fails to sustain higher levels, with downside targets of 25,100, 25,050, and 25,000-.
Overall, the bias remains positive with a gap up opening, but traders should stay cautious near resistance zones and manage trades with strict stop-losses. The reaction around 25,200–25,250 will be key for deciding today’s trend.
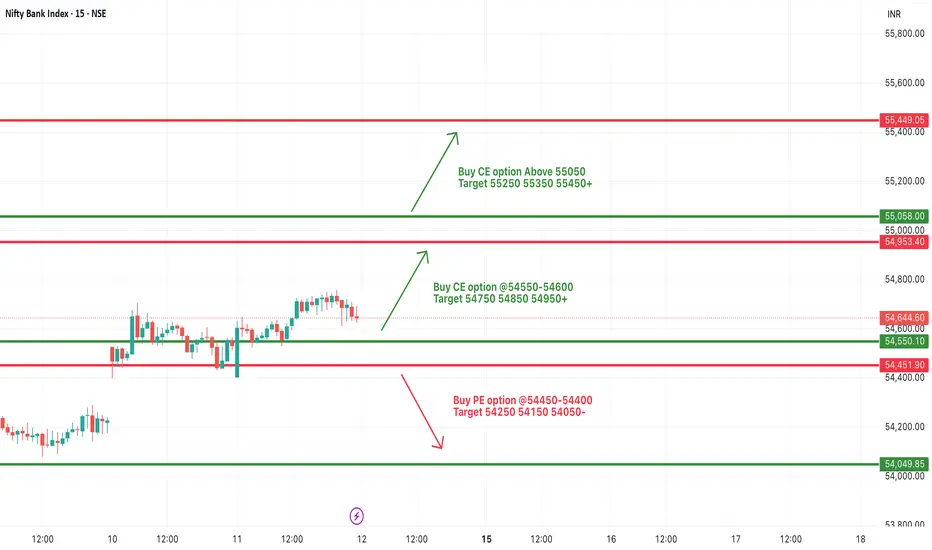
[INTRADAY] #BANKNIFTY PE & CE Levels(15/09/2025)Bank Nifty is expected to witness a gap up opening, continuing its positive momentum. The index is currently trading close to a crucial resistance zone, and today’s session will be important to determine whether bulls can push further or if profit booking emerges.
On the upside, a sustained move above 54,550–54,600 can trigger fresh buying in CE options, with targets placed at 54,750, 54,850, and 54,950+. A breakout above 55,050 will further strengthen the bullish sentiment, opening the path toward 55,250–55,350+ levels.
On the downside, immediate support lies at 54,450. A breakdown below this level may invite selling pressure, leading to a decline toward 54,250, 54,150, and 54,050- levels. Further weakness below 54,000 can drag Bank Nifty lower into a corrective phase.
Overall, the sentiment remains bullish with a gap up opening, but traders should remain cautious near resistance zones and manage positions with strict stop-losses. Intraday opportunities will favor the direction of the breakout from the defined levels.

KTKBANK Swing TradeKTKBANK Swing Trade Setup
Karnataka Bank Ltd. (NSE: KTKBANK) is showing a potential swing trade opportunity. The stock has recently taken support near ₹169 levels and is trading above key support zones.
Entry Zone: Current market price around ₹179
Target: ₹200
Stop Loss: ₹169 (closing basis)
The trade offers a favorable risk–reward setup for short- to medium-term swing traders, provided the stock sustains above the support level.

STWP Breakout Watchlist – [14.09] | Key Stocks for Swing TradersSTWP Breakout Watchlist – | Key Stocks for Swing Traders 📊🚀
Markets are buzzing with momentum as multiple stocks show strong breakout signals backed by volumes and clean chart structures 🚀. Today’s watchlist highlights finance heavyweights and defence leaders that are attracting trader attention with fresh swing setups. Let’s decode the key levels, supports, and resistances to track for the coming sessions 🔑.
________________________________________________________________________________
________________________________________________________________________________
BAJFINANCE – 1003.25 (3.41%)
📊 Technical Indicators Explained
Bajaj Finance has given a powerful breakout 🚀 as it clears a long consolidation zone with a strong bullish Marubozu candle backed by heavy volume. The stock posted volumes almost 2 times its 20-day average, reflecting active trading and stronger-than-usual participation. Elevated volumes like this often support the sustainability of the underlying trend.
The chart highlights multiple bullish signals — strong momentum, a 52-week breakout, RSI breakout ⚡ confirming strength, and a Bollinger Band squeeze-off 📊 hinting at fresh volatility expansion. With VWAP support and intraday swing confirmation, the setup looks robust.
As long as key supports at 981 / 959 / 947 are protected, the stock can eye resistances at 1015 / 1026 / 1048 and possibly move towards higher upside levels of 1062 and 1120 in the coming sessions, with a possible demand zone at 975.90 – 965.60.
Bajaj Finance recently touched a 52-week high, driven by strong trading volumes (as per MarketWatch).
The company has set an ambitious goal to grow its loan book to ₹10 lakh crore by FY29, while also working on internal succession planning for senior leadership roles (as per Economic Times).
________________________________________
📈 Investment Outlook & Conclusion
📈 Bullish Case – Momentum with volume support may extend gains towards resistances.
📉 Bearish Case – Breach below 970 can attract selling pressure.
⚡ Momentum Case – Well-aligned for short swing trades.
📅 Perspective – Short-term momentum positive; long-term depends on loan book growth and asset quality.
________________________________________
📊 STWP Trade Analysis – BAJFINANCE
Bajaj Finance has given a strong breakout with momentum and volume confirmation 🚀
👉 For me, my entry zone is around 1004.60, aligned with the breakout structure considering 946.70 as my stop loss.
👉 If the stock dips towards 975.90 – 965.60 (Pullback zone), I will see that as a conservative re-entry with tighter risk.
🔑 Key Levels I’m Watching
Invalidation Level: A sustained move below 945 will negate my bullish view.
My Levels (if momentum continues): 1048 → 1062 → 1120
This is my swing trading approach as long as supports hold and is not a buy/sell recommendation.
________________________________________________________________________________
________________________________________________________________________________
BDL – 1566.50 (▲ +5.73%)
📊 Technical Indicators Explained
Bharat Dynamics (BDL) has delivered a strong breakout candle 🔥 after a prolonged downtrend, backed by extremely high volume 🚀. BDL stood out with an impressive 3.7x surge in volumes over its 20-day average, showcasing aggressive market involvement. Such strong accumulation signals heightened attention from traders and investors, often aligned with significant moves.
The chart highlights multiple bullish signals — RSI breakout, Bullish Engulfing candle, Buy Today Sell Tomorrow (BTST) setup, VWAP support, and SuperTrend reversal confirmation. The BB squeeze-off 📊 indicates a fresh trending move is likely to unfold.
As long as supports at 1506 / 1446 / 1410 are protected, and with a demand zone between 1513 – 1470, the stock looks well positioned to sustain momentum. On the upside, resistances are placed at 1602 / 1637 / 1697, with Fibonacci-based higher levels stretching to 1734 → 1886 → 2041 and beyond.
________________________________________
📰 Recent Updates
Institutional interest in BDL is rising, with the HDFC Defence Fund increasing its stake in the company along with other defence stocks (Economic Times).
BDL has also been highlighted among defence counters that recently surged up to 19%, supported by a strong order book and export prospects (Mint).
________________________________________
📈 Investment Outlook & Conclusion
📈 Bullish Case – Strong breakout with heavy volumes may extend towards higher resistances.
📉 Bearish Case – Slip below 1479 can open downside risk.
⚡ Momentum Case – High-risk, high-reward setup for aggressive short-term swings.
📅 Perspective – Short-term breakout play; long-term outlook tied to defence orders and exports.
________________________________________
📊 STWP Trade Analysis – BDL
Bharat Dynamics has delivered a breakout with volume confirmation and multiple bullish signals 🚀
👉 For me, my entry zone is around 1577, aligned with the breakout structure with my stop being at 1422.60
👉 If the stock dips towards the 1513 – 1470 demand zone, I will treat it as a conservative re-entry with tighter risk.
🔑 Key Levels I’m Watching
Invalidation Level: Invalidation level of below 1422 will negate my bullish view.
My Levels (if momentum continues): 1602 → 1637 → 1697 → 1734 → 1886 → 2041
This is my swing trading approach as long as supports hold and is not a buy/sell recommendation.
________________________________________________________________________________
________________________________________________________________________________
BAJAJFINSV – 2081.50 (▲ +2.14%)
📊 Technical Indicators Explained
Bajaj Finserv (BAJAJFINSV) has given a breakout candle with volume confirmation 🔥 after a long consolidation phase.
The stock displays strong signals — possible breakout setup, bullish engulfing candle, RSI breakout ⚡, swing trade confirmation, and Bollinger Band breakout 📊. The stock is also supported by VWAP demand and a BB squeeze-off, indicating potential for fresh momentum expansion. BAJAJFINSV recorded volumes about 1.8 times its recent 20-day average, suggesting above-normal market activity. This indicates healthy interest and participation, though the intensity is moderate compared to high-volume breakouts.
With strong supports at 2047 / 2013 / 1992, the stock looks well-positioned to sustain its move. On the upside, resistances are placed at 2102 / 2122 / 2156, with higher Fibonacci levels seen at 2135 → 2217 → 2236 if momentum holds.
________________________________________
📰 Recent Updates
Bajaj Finserv has set a target to achieve carbon neutrality for Scope 1 & 2 emissions by 2032, following a decarbonisation study in FY25 (Times of India).
In Q1 FY26, the company reported a 30.4% YoY rise in consolidated net profit to ₹2,789 crore, with revenues growing by ~12–13% (Economic Times).
________________________________________
📈 Investment Outlook & Conclusion
📈 Bullish Case – Gradual momentum with volume support could lift towards resistances.
📉 Bearish Case – A fall below 2032 can trigger near-term weakness.
⚡ Momentum Case – Suitable for cautious swing setups.
📅 Perspective – Short-term bias positive; long-term backed by financial services expansion.
________________________________________
📊 STWP Trade Analysis – BAJAJFINSV
Bajaj Finserv has delivered a breakout candle with momentum and above-average volume 🚀
👉 For me, my entry zone is around 2089, aligned with the breakout structure and a stop loss level of 2024.95.
👉 If the stock dips towards the level of 2041, I will treat it as a conservative re-entry with tighter risk.
🔑 Key Levels I’m Watching
Invalidation Level: A sustained move below 2012 will negate my bullish view.
My Levels (if momentum continues): 2102 → 2122 → 2156 → 2135 → 2217 → 2236
This is my swing trading approach as long as supports hold and is not a buy/sell recommendation.
________________________________________________________________________________
________________________________________________________________________________
HAL – 4745.60 (▼ –3.59%)
📊 Technical Indicators Explained
Hindustan Aeronautics (HAL) has given a breakout candle with strong volume confirmation 🚀 after a corrective downtrend. HAL witnessed trading volumes nearly 2.6x higher than its 20-day average, reflecting strong participation in the stock. Such elevated volumes often highlight rising institutional or retail activity, adding credibility to the ongoing price momentum.
The stock shows powerful bullish signals — Bullish Marubozu candle, RSI breakout ⚡, Bullish Engulfing setup, VWAP support, backed by a SuperTrend reversal and Bollinger Band breakout 📊. The BB squeeze-off suggests a potential trending move is just beginning.
With supports at 4634 / 4523 / 4465, the stock looks cushioned for momentum continuation. On the upside, immediate resistances lie at 4803 / 4861 / 4972, with higher Fibonacci-based levels stretching towards 5074 → 5399 → 5723 if momentum sustains. There is a possible demand zone around 4634 – 4544.30
________________________________________
📰 Recent Updates
HAL has received its third GE-404 engine from the US for the LCA Tejas Mark-1A programme, with a fourth expected later this month (Economic Times).
The company also signed a technology transfer agreement with IN-SPACe, ISRO, and NSIL for the Small Satellite Launch Vehicle (Economic Times).
HAL’s HJT-36 trainer jet is being evaluated for conversion into a light-attack fighter aircraft, with basic weapon trials already completed (Navbharat Times).
________________________________________
📈 Investment Outlook & Conclusion
📈 Bullish Case – Strong momentum with volume support may push towards higher resistances.
📉 Bearish Case – A drop below 4576 can attract downside pressure.
⚡ Momentum Case – Aligned with momentum; good for short-term swings.
📅 Perspective – Short-term breakout play; long-term supported by defence growth.
________________________________________
📊 STWP Trade Analysis – HAL
Hindustan Aeronautics has delivered a breakout candle with strong volume and momentum 🚀
👉 For me, my entry zone is around 4750, aligned with the breakout setup and my stop loss level at 4425.35.
👉 If the stock dips towards the 4634 – 4544.30, I will consider it as a conservative re-entry with tighter risk.
🔑 Key Levels I’m Watching
Invalidation Level: A sustained move below 4425 will negate my bullish view.
My Levels (if momentum continues): 4803 → 4861 → 4972 → 5074 → 5399 → 5723
This is my swing trading approach as long as supports hold and is not a buy/sell recommendation.
________________________________________________________________________________
________________________________________________________________________________
⚠️ Disclaimer – Please Read Carefully
The information shared here is meant purely for learning and awareness. It is not a buy or sell recommendation and should not be taken as investment advice. I am not a SEBI-registered investment advisor, and all views expressed are based on personal study, chart patterns, and publicly available market data.
Trading — whether in stocks or options — carries risk. Markets can move unexpectedly, and losses can sometimes exceed the money you have invested. Past performance or past setups do not guarantee future results.
If you are a beginner, treat this as a guide to understand how the market works — practice on paper trades before risking real money. If you are experienced, always assess your own risk, position sizing, and strategy suitability before entering trades.
Consult a SEBI-registered financial advisor before making any real trading decision. By engaging with this content, you acknowledge full responsibility for your trades and investments.
💬 Found this useful?
🔼 Give this post a Boost to help more traders discover clean, structured learning.
✍️ Drop your thoughts, questions, or setups in the comments — let’s grow together!
🔁 Share with fellow traders and beginners to spread awareness.
👉 “If you liked this breakdown, follow for more clean, structured setups with discipline at the core.”
🚀 Stay Calm. Stay Clean. Trade With Patience.
Trade Smart | Learn Zones | Be Self-Reliant 📊
Gold Breaks Out: Rising Buying Power Amid USD WeaknessMarket Context:
The higher-than-expected Unemployment Claims data (263K vs 235K) has weakened the USD, providing favorable conditions for gold to rise. The University of Michigan Consumer Sentiment and Inflation Expectations remain stable, but they do not significantly impact gold’s trend.
XAUUSD is showing a strong upward trend, with gold trading within a solid ascending channel. The support at 3,615.000 USD has been tested and confirmed, providing a stable foundation for further gains. After breaking the 3,650.000 USD resistance, gold has the potential to continue its breakout towards 3,700.000 USD, supported by strong buying sentiment and technical indicators backing the bullish trend.
We continue to see strong investor preference for gold as the USD weakens, especially amid expectations of economic stability.

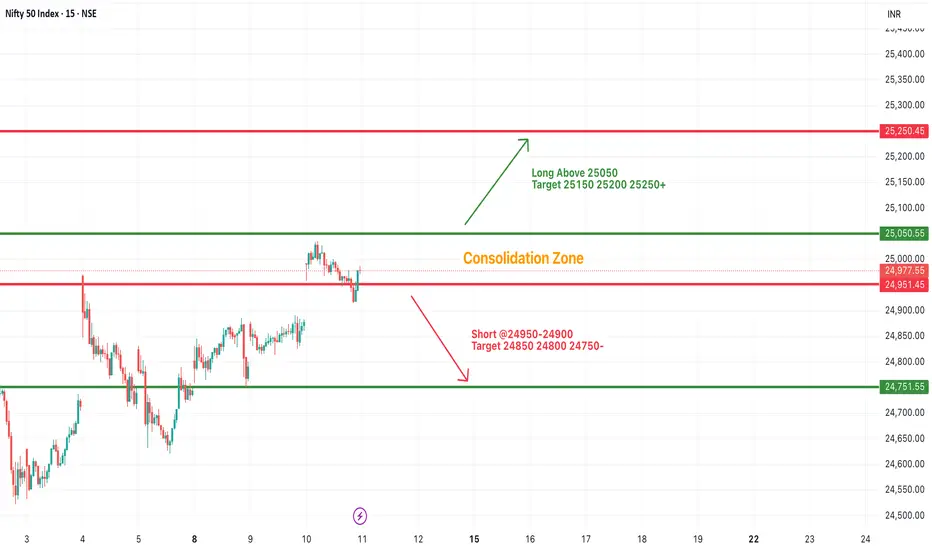
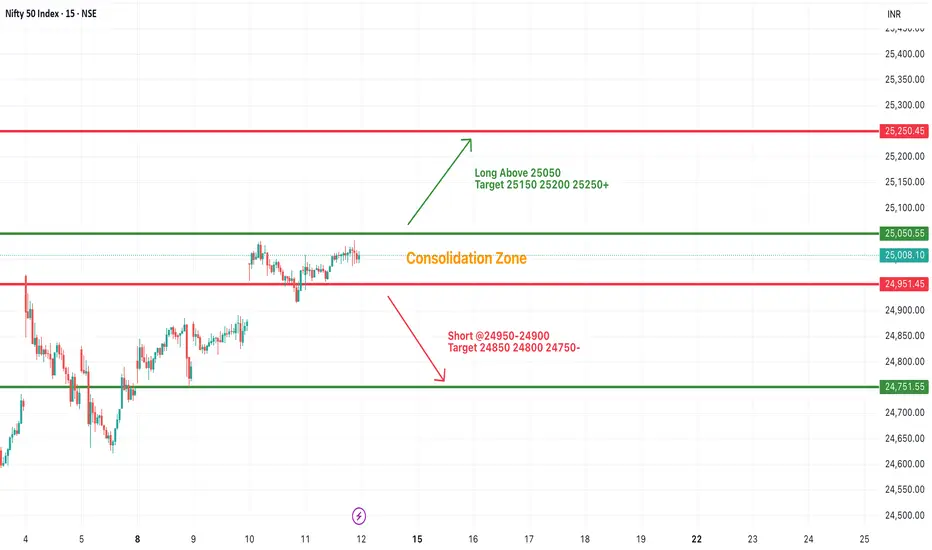
#NIFTY Intraday Support and Resistance Levels - 12/09/2025Nifty is likely to witness a gap up opening today, carrying forward the positive momentum from the previous session. Interestingly, there are no major changes in yesterday’s levels, which indicates the market is still trading within a consolidation zone.
On the upside, a sustained move above 25,050 can trigger a rally toward 25,150, 25,200, and 25,250+ levels. A breakout from this consolidation could add strength to the bulls and open the path for higher targets in the coming sessions.
On the downside, immediate support is placed around 24,950–24,900. If Nifty slips below this zone, short positions may get active, leading to a decline toward 24,850, 24,800, and 24,750 levels.
Overall, the structure remains balanced, and the market awaits a clear breakout above or below the consolidation zone for directional clarity. Traders should stay cautious and align their intraday trades with these crucial levels, keeping strict stop-losses in place.
[INTRADAY] #BANKNIFTY PE & CE Levels(12/09/2025)Bank Nifty is expected to open with a gap up, reflecting positive sentiment in the market. The index has been consolidating within a tight range, and today’s opening may provide fresh directional cues depending on how it reacts around the key levels.
On the upside, if Bank Nifty sustains above the 54,550–54,600 zone, a bullish move can be anticipated. In this scenario, call option buying or long positions can target levels of 54,750, 54,850, and 54,950+. A further breakout above 55,050 may open the door for an extended rally towards 55,250 and 55,350 levels.
On the downside, if the index fails to hold above 54,550 and slips below 54,450–54,400, weakness may emerge. This could drag Bank Nifty towards 54,250, 54,150, and 54,050 levels, where strong support is placed.
Overall, the sentiment remains mildly bullish with a gap up opening, but traders should watch whether Bank Nifty sustains above the breakout zones for a clear intraday trend. Maintaining strict stop-losses remains crucial to manage risk in such range-bound yet volatile conditions.
Watchlist Analysis – 12th Sept 2025📊 Watchlist Analysis – 12th Sept 2025
________________________________________
📌 ADANIENT (2398.80) – Rising Wedge
Momentum: Strong | Bullish | Risk: Low | Volume: High
Important Resistance Levels: 2499.68 / 2580.66 | Stop Loss: 2337.72
📊 Technical Indicators Explained
Adani Enterprises (ADANIENT) is flashing strong technical signals. A rising wedge structure 🔺 shows price tightening towards resistance, with today’s bullish breakout candle 🔥 backed by heavy volume surge 🚀. The RSI breakout ⚡ confirms strengthening momentum, while the BB Squeeze-Off release 📊 hints at a fresh volatility expansion. With support zones holding firm and price eyeing higher resistances, the stock is entering a decisive breakout zone.
Support & Resistance Zones
🟢 Support: 2353 | 2307 | 2275
🔴 Resistance: 2432 | 2464 | 2510
Investment Outlook & Conclusion
📈 Bullish Case – Strong momentum with volume support may push towards higher resistances.
📉 Bearish Case – A drop below SL can attract downside pressure.
⚡ Momentum Case – Aligned with momentum; good for short-term swings.
📅 Perspective – Short-term breakout play; long-term needs stability.
________________________________________
📌 AUROPHARMA (1109.20) – Double Bottom
Momentum: Strong | Bullish | Risk: High | Volume: High
Important Resistance Levels: 1175.93 / 1233.96 | Stop Loss: 1059.87
📊 Technical Indicators Explained
Aurobindo Pharma (AUROPHARMA) is flashing multiple bullish signals. A double bottom pattern 📉➡️📈 near ₹1016 confirms a strong reversal base, followed by a bullish breakout candle 🔥 backed by massive volume surge 🚀. The RSI breakout ⚡, Bollinger Band expansion 📊, and SuperTrend flip ✅ add conviction to the momentum. With supports holding firm and resistances ahead, the stock is entering a high-probability breakout zone.
Support & Resistance Zones
🟢 Support: 1074 | 1040 | 1018
🔴 Resistance: 1131 | 1153 | 1189
Investment Outlook & Conclusion
📈 Bullish Case – Heavy volume breakout supports upside continuation.
📉 Bearish Case – Failure to sustain above 1080 can bring weakness.
⚡ Momentum Case – Strong near-term upside; suitable for aggressive traders.
📅 Perspective – Short- to medium-term; long-term investors should watch risk levels.
________________________________________
📌 TATACHEM (968.25) - Symmetrical Triangle
Momentum: Strong | Bullish | Risk: Low | Volume: High
Resistance Levels: 1007.92 / 1039.84 | Stop Loss: 944.08
📊 Technical Indicators Explained
Tata Chemicals (TATACHEM) is showing strong bullish signals forming a Symmetrical Triangle. A bullish engulfing candle 🔥 near support highlights renewed buying interest, while an RSI breakout ⚡ confirms strengthening momentum. The Bollinger Band breakout 📊, along with VWAP support ✅, suggests rising participation. With a recent BB squeeze compression 🎯 now opening up, volatility expansion could fuel a decisive move. The stock is positioned in a potential breakout zone 🚀
Support & Resistance Zones
🟢 Support: 950 | 932 | 919
🔴 Resistance: 981 | 994 | 1012
Investment Outlook & Conclusion
📈 Bullish Case – Triangle consolidation may resolve higher on breakout.
📉 Bearish Case – Below SL, stock could revisit support levels.
⚡ Momentum Case – Neutral-to-positive; volume confirmation needed.
📅 Perspective – Short-term breakout opportunity; medium-term cautious stance.
________________________________________
📌 SHRIRAMFIN (620.05) – Downward Sloping Channel
Momentum: Strong | Bullish | Risk: Low | Volume: High
Resistance Levels: 643.69 / 664.48 | Stop Loss: 602.11
📊 Technical Indicators Explained
Shriram Finance (SHRIRAMFIN) has given a downward sloping channel breakout 📉➡️📈, signaling a shift from weakness to strength. An RSI breakout ⚡ confirms bullish momentum, while a BB Squeeze-Off setup 🎯 points to potential volatility expansion. The bullish price action 🔥 backed by rising volumes 🚀 suggests renewed buyer confidence. With resistances overhead, the stock now stands at a critical breakout zone, where follow-through buying could unlock further upside.
Support & Resistance Zones
🟢 Support: 608 | 595 | 588
🔴 Resistance: 628 | 635 | 648
Investment Outlook & Conclusion
📈 Bullish Case – Strong buying interest; scope for further upside.
📉 Bearish Case – Failure to hold above 602 may weaken momentum.
⚡ Momentum Case – Positive; traders may ride short-term moves.
📅 Perspective – Short-term play; long-term view requires caution.
________________________________________
⚠️ Disclaimer – Please Read Carefully
The information shared here is meant purely for learning and awareness. It is not a buy or sell recommendation and should not be taken as investment advice. I am not a SEBI-registered investment advisor, and all views expressed are based on personal study, chart patterns, and publicly available market data.
Trading — whether in stocks or options — carries risk. Markets can move unexpectedly, and losses can sometimes exceed the money you have invested. Past performance or past setups do not guarantee future results.
If you are a beginner, treat this as a guide to understand how the market works — practice on paper trades before risking real money. If you are experienced, always assess your own risk, position sizing, and strategy suitability before entering trades.
Consult a SEBI-registered financial advisor before making any real trading decision. By engaging with this content, you acknowledge full responsibility for your trades and investments.
💬 Found this useful?
🔼 Give this post a Boost to help more traders discover clean, structured learning.
✍️ Drop your thoughts, questions, or setups in the comments — let’s grow together!
🔁 Share with fellow traders and beginners to spread awareness.
👉 “If you liked this breakdown, follow for more clean, structured setups with discipline at the core.”
🚀 Stay Calm. Stay Clean. Trade With Patience.
Trade Smart | Learn Zones | Be Self-Reliant 📊
Waiting for CPI & FED rate cut | Priority Buy at support🟡 XAU/USD – 11/09 | Captain Vincent ⚓
🔎 Captain’s Log – News Context
US PPI yesterday : Wholesale prices dropped sharply, below forecasts → strengthening expectations of a FED rate cut.
FED probabilities : 100% odds for a -25bps cut next week, and even 16% of investors bet on -50bps.
Today : US CPI & Jobless Claims – key data to assess inflation & labor, determining the specific cut.
⏩ Captain’s Summary : FED will certainly cut rates, so Gold remains supported in its bullish trend. Short-term fluctuations may occur due to sentiment or surprises (e.g., tariff news from Trump).
📈 Captain’s Chart – Technical Analysis
Storm Breaker (Resistance) :
Bearish OB: 3645 – 3650 (near-term resistance)
Weak High: 3674 (target if breakout succeeds)
Golden Harbor (Support) :
Near support: 3622
FVG Dock: 3603
Bullish OB: 3581 – 3585 (strong mid-term support)
Market Structure :
H1 shows a short-term bearish BoS, retesting support.
Main trend remains bullish → possible pullback to 3622 or 3603 before rallying toward 3670+.
🎯 Captain’s Map – Trade Plan
✅ Buy (priority with trend)
Entry 1 (FVG): 3603 – 3605
SL: 3592
TP: 3610 – 3615 – 3625 – 365x
Entry 2 (Bullish OB): 3581 – 3585
SL: 3572
TP: 3600 – 3620 – 3640
⚡ Sell (only short scalp at resistance)
Sell Zone: 3645 – 3650
SL: 3658
TP: 3635 – 3628 – 3622
⚓ Captain’s Note
“The Golden sails remain full of wind as the FED is almost certain to cut rates. Golden Harbor 🏝️ (3622 – 3603) and the deeper OB 3581 – 3585 are safe havens to follow the bullish tide. If the ship touches Storm Breaker 🌊 (3645 – 3650) , only Quick Boarding 🚤 short scalps are recommended. The larger voyage still heads north, steering Gold toward new highs at 367x.”

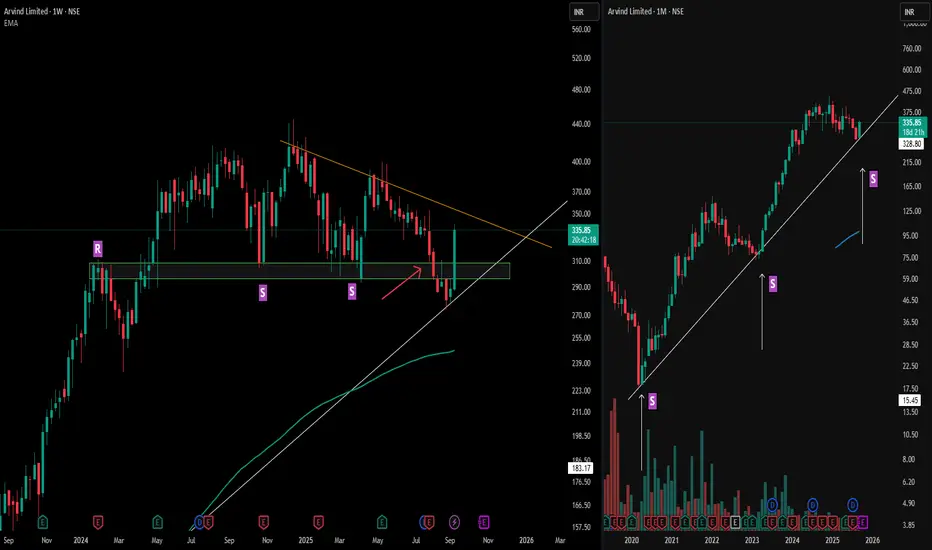
Arvind : Spotting Fake Breakdowns with Multi-Timeframe SupportArvind Limited highlights how a broader perspective can clarify deceptive price moves.
On the left (weekly), resistance ("R") flipped into support ("S") multiple times, with the orange counter trendline framing the recent structure. The red arrow marks a moment when weekly support appeared broken—a classic fake breakdown as price quickly reclaimed the zone with decisive strength.
Looking right (monthly), the MTFA view explains the recovery: a long-standing trendline support anchors the zone, helping absorb downside attempts and fueling the swift reversal. This alignment across timeframes illustrates how long-term technical structures often override short-term volatility, and why reviewing bigger picture charts is essential for pattern validation—not for prediction.
Disclaimer: This analysis is for educational purposes only and does not constitute investment advice. Always do your own research before making financial decisions.
#NIFTY Intraday Support and Resistance Levels - 11/09/2025Nifty is expected to witness a slightly gap up opening, signaling stability after recent sessions of consolidation. The index is trading within a well-defined zone, and a breakout in either direction will set the tone for intraday movement.
On the upside, if Nifty sustains above the 25,050 level, it may trigger fresh buying momentum. This could push the index towards 25,150, 25,200, and 25,250+, where higher resistance is placed. A decisive close above 25,250 will strengthen the bullish sentiment and may invite further upside in the short term.
On the downside, if Nifty slips below 24,950–24,900, selling pressure may dominate the session. This can lead to a move towards 24,850, 24,800, and 24,750 levels, where immediate support lies. A break below 24,750 could extend the decline and keep the index under pressure.
Overall, Nifty remains in a consolidation phase with both bullish and bearish opportunities depending on how it reacts around the breakout levels. Traders should focus on key support and resistance levels while maintaining strict stop-losses for risk management.