[INTRADAY] #BANKNIFTY PE & CE Levels(11/09/2025)Bank Nifty is expected to witness a slightly gap up opening, indicating a steady start after recent range-bound sessions. The index continues to consolidate near crucial resistance and support levels, and today’s movement will play an important role in setting the tone for intraday trades.
On the upside, if Bank Nifty sustains above the 54,550–54,600 zone, buying momentum may strengthen. This could lead to an upward move towards 54,750, 54,850, and 54,950+, where further resistance is expected. A breakout above 54,950 will open the possibility of an extended rally.
On the downside, if the index slips below 54,450–54,400, selling pressure may emerge. This can drag Bank Nifty towards 54,250, 54,150, and 54,050 levels, with deeper declines possible if 54,050 fails to hold.
Overall, the market remains neutral to range-bound with both bullish and bearish opportunities available around key breakout levels. Traders are advised to wait for confirmation and trade with strict stop-losses to manage risk effectively.
Technical Analysis

Tata Elxsi | Volume Breakout with Key Supports & Resistances📌 Tata Elxsi Ltd. – Closing Price: ₹5,843.50
📊 Technical Indicators Explained
Tata Elxsi is showing strong technical signals. A 20-day volume breakout 🚀 suggests big participation from traders, while a Bullish Marubozu candle 🔥 confirms strong buying momentum. The stock is clearly building momentum 💹, with possible target zones 🎯 based on Fibonacci levels. A short-term setup 📈 is visible as momentum indicators turn positive. The RSI breakout ⚡ shows renewed strength, and both SuperTrend and VWAP 🟢 are aligned on the bullish side, further adding confidence to the current breakout.
________________________________________
📈 Bullish Case – Why the stock could go up
Strong Bullish Marubozu Candle indicates momentum revival.
Breakout supported by high volumes – sign of institutional interest.
RSI & VWAP trending positive, confirming strength.
Fibonacci levels indicate potential upside zones towards ₹6,300 – ₹7,250+.
📉 Bearish Case – Potential downside risks
Any failure to sustain above ₹5,770 could trigger profit booking.
Broader market weakness or sector sentiment may weigh.
A break below ₹5,500 would weaken the bullish structure.
⚡ Momentum Case – Short-term Trading Edge
20-Day Volume Breakout highlights strong trader participation.
RSI breakout + SuperTrend signal indicate momentum strength.
Sustaining above ₹5,900–₹6,000 may lead to further positive movement towards higher levels.
📊 Support & Resistance Levels
Resistance Zones: ₹5,939 | ₹6,034.5 | ₹6,209
Support Zones: ₹5,399 | ₹5,494.5 | ₹5,669
📅 Short-term vs. Long-term Perspective
Short-term: Key resistance zones to watch are around ₹6,200 – ₹6,735, while support lies near ₹5,500.
Long-term: The stock remains in a structural uptrend. Any dip towards ₹5,200–₹5,400 may act as accumulation zones for investors with a longer horizon.
✅ Conclusion: Tata Elxsi has shown a strong breakout backed by volume & momentum.
👉 The stock is at an important juncture — while short-term traders may track key momentum levels, long-term investors can view dips as opportunities within the broader uptrend.
⚠️ Disclaimer – Please Read Carefully
The information shared here is meant purely for learning and awareness. It is not a buy or sell recommendation and should not be taken as investment advice. I am not a SEBI-registered investment advisor, and all views expressed are based on personal study, chart patterns, and publicly available market data.
Trading — whether in stocks or options — carries risk. Markets can move unexpectedly, and losses can sometimes exceed the money you have invested. Past performance or past setups do not guarantee future results.
If you are a beginner, treat this as a guide to understand how the market works — practice on paper trades before risking real money. If you are experienced, always assess your own risk, position sizing, and strategy suitability before entering trades.
Consult a SEBI-registered financial advisor before making any real trading decision. By engaging with this content, you acknowledge full responsibility for your trades and investments.
💬 Found this useful?
🔼 Give this post a Boost to help more traders discover clean, structured learning.
✍️ Drop your thoughts, questions, or setups in the comments — let’s grow together!
🔁 Share with fellow traders and beginners to spread awareness.
👉 “If you liked this breakdown, follow for more clean, structured setups with discipline at the core.”
🚀 Stay Calm. Stay Clean. Trade With Patience.
Trade Smart | Learn Zones | Be Self-Reliant 📊

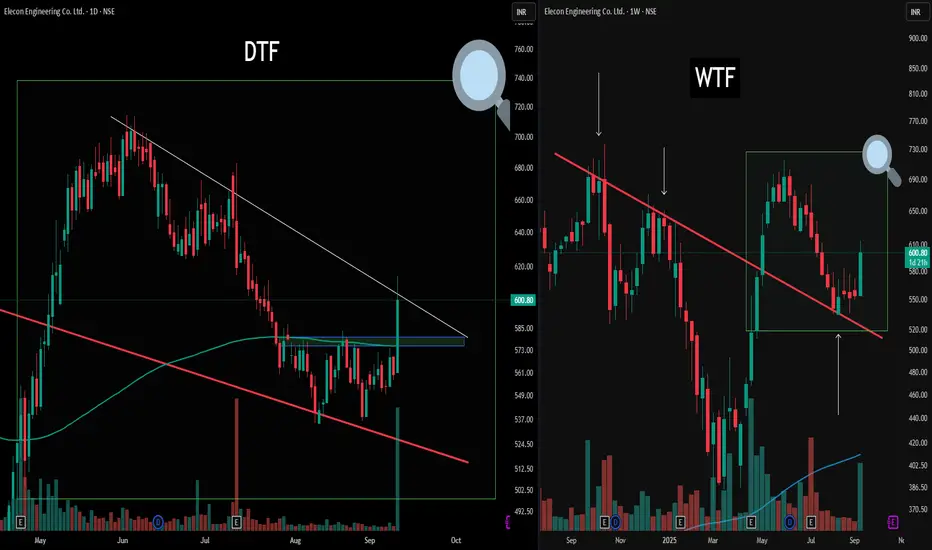
Unlocking Structure: Multi-Timeframe Mapping Today’s chart highlights the value of multi-timeframe analysis for structured observation.
On the right (WTF), the weekly perspective provides a broad structure, showcasing a clean counter trendline and its reaction zone. A green box and magnifier zoom into this region, framing the context for the daily (DTF) chart on the left.
On the DTF view, the same zone is explored in detail. Here, there's an active counter trendline (white) and a pronounced double bottom formation resting on a blue Flip zone—noted for educational reference rather than outcome prediction. Both timeframes display how structural overlaps and retests can be identified, serving as useful pattern recognition and risk management.
Disclaimer: Trading involves significant risk and is not suitable for all investors. Past performance does not guarantee future results. Always conduct your own research, consider seeking advice from a qualified financial advisor, and trade only with capital you can afford to lose.
Caution ahead of US PPI report | Priority on Sell setups🟡 XAU/USD – 10/09 | Captain Vincent ⚓
🔎 Captain’s Log – Market Context
US 10-year bond yields rebound, signaling the market is awaiting key inflation data.
At 07:30, US PPI report will be released – a crucial figure that could strongly influence FED rate expectations.
Investors are also eyeing US CPI in the coming days to assess the inflation outlook.
The US Supreme Court accepted Trump’s appeal, but this news has not yet had a notable impact on Gold.
⏩ Captain’s Summary: Ahead of inflation data, Gold often tends to correct lower due to cautious sentiment.
📈 Captain’s Chart – Technical Analysis
Storm Breaker (Key Resistance):
Bearish OB: 3654 – 3660 (short-term upper cap)
ATH Watchtower: 3700 – 3702 (Sell Zone – possible new ATH test)
Golden Harbor (Strong Support):
Buy Zone: 3601 – 3602
OB Dock: 3582 – 3585
Currently, price is around 3640 – 3645, after a technical rebound from support. High probability that Gold will retest nearby resistance before a downward correction.
🎯 Captain’s Map – Trade Scenarios
⚡ Quick Boarding (SELL – Daily Priority)
Entry 1: 3654 – 3660
SL: 3668
TP: 3654 → 3650 → 3618 → 3610
Entry 2 – ATH Test: 3701 – 3703
SL: 3711
TP: 3688 → 3675 → 3665 → 365x
✅ Golden Harbor (BUY – Only at deep support)
Buy Zone: 3601 – 3603
SL: 3592
TP: 3610 → 3620 → 3630
⚓ Captain’s Note
“The golden ship faces turbulent seas today as it sails near Storm Breaker 🌊 (3654 – 3660) . Before the fierce winds called US PPI , sailors should prioritize dropping anchor with short-term SELL positions at resistance. Golden Harbor 🏝️ (3601 – 3603) remains a safe haven below, but only when the ship corrects deeply should it dock. On this voyage, Quick Boarding 🚤 is for scalp maneuvers, while the main current is still steered by the stormy waves of inflation.”

BUY TODAY SELL TOMORROW for 5%DON’T HAVE TIME TO MANAGE YOUR TRADES?
- Take BTST trades at 3:25 pm every day
- Try to exit by taking 4-7% profit of each trade
- SL can also be maintained as closing below the low of the breakout candle
Now, why do I prefer BTST over swing trades? The primary reason is that I have observed that 90% of the stocks give most of the movement in just 1-2 days and the rest of the time they either consolidate or fall
Trendline Breakout in KIOCL
BUY TODAY SELL TOMORROW for 5%

XAU/USD – Captain Vincent Update | 15m Outlook🔎 Captain’s Log – Market Structure
On the 15-minute timeframe (M15) , price just formed a Break of Structure (BoS) above the previous accumulation zone → confirming temporary control by the Buy side.
However, the Bearish Order Block (H1 Zone) around 3655 is being tested, marking a key resistance area.
📈 Captain’s Chart – Bullish Scenario
If price holds above the OB zone 3644 – 3655 , buying pressure may continue to push the ship toward the Weak High 3674 .
Further ahead, the next destination is Storm Breaker Peak (3701 – 3708) – where strong selling reactions are expected.
📉 Captain’s Chart – Bearish Scenario
After sweeping liquidity and touching the Storm Breaker (Sell Zone) , Gold may reverse lower.
Key level to monitor: OB 3644 . If this area breaks, the market could open a deeper bearish leg.
🎯 Captain’s Map – Key Levels
Golden Harbor (Support) : 3644 – 3655 (OB retest zone)
Target (Bullish) : 3674 → 3701 – 3708
Storm Breaker (Sell Zone) : 3701 – 3708
Invalidation : Break below 3644 opens a new bearish journey
⚓ Captain’s Note
“The Golden sails have just caught new wind after a BoS , showing that the captain and crew still hold a short-term advantage. Golden Harbor 🏝️ (3644 – 3655) is the key dock to sustain the bullish trend. If Gold clears the Weak High 3674 , the ship may head straight to Storm Breaker 🌊 (3701 – 3708) , where reversal waves are likely to rise. While the short-term tide remains bullish, Storm Breaker still hides major risks – sailors must sail with strict risk management discipline.”

XAUUSD: Breaking Through ResistanceXAUUSD is currently trading within a clear uptrend channel, with strong support at 3,620. The 1-hour chart shows that gold has bounced strongly from this support level, confirming that the uptrend remains intact. With support from EMA 34 and EMA 89, XAUUSD is likely to continue its upward momentum and target higher levels.
The current uptrend channel shows the price is moving within a clearly defined range, with higher lows consecutively forming. The next resistance is at 3,680, and if gold breaks through this level, it could extend its rise toward higher targets. The 3,620 level remains a crucial support, and as long as the price stays above this level, the chances of further increases are high.
Impact of News
With the forecasted PPI dropping from 0.9% to 0.3%, this could reduce inflation expectations and weaken the USD, providing favorable conditions for gold to continue rising.

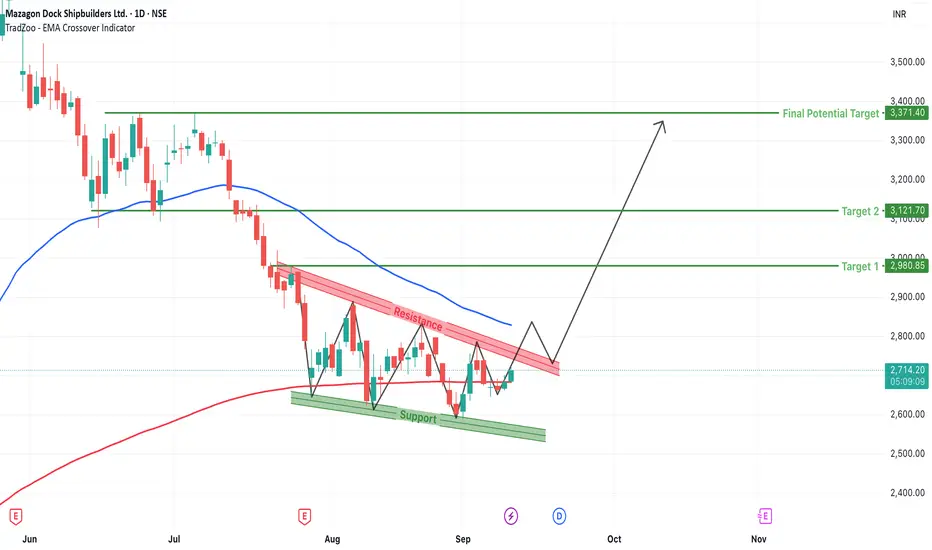
Mazagon Dock (MAZDOCK) Breakout Watch: Falling Wedge FormationMazagon Dock Shipbuilders Ltd., one of India’s premier shipbuilding companies, has recently shown signs of a technical breakout after months of downtrend. The stock had been consolidating within a falling wedge structure—a well-known bullish reversal pattern—and is now approaching a critical breakout zone that traders should closely watch.
Let’s analyze the technical setup in detail.
1. Formation of the Falling Wedge Pattern
The chart clearly highlights a falling wedge, which is formed by drawing two converging trendlines: one descending across the highs (resistance) and the other descending across the lows (support). The falling wedge is typically a bullish reversal pattern, especially when it forms after a prolonged downtrend—as is the case here.
From mid-June to early September, MAZDOCK trended lower, respecting the wedge boundaries. However, instead of a complete breakdown, price started finding support near the ₹2,500–2,600 zone, forming higher lows within the wedge—a subtle early sign of a reversal brewing beneath the surface.
2. Key Resistance and EMA Confluence
The immediate overhead resistance is defined by the upper boundary of the wedge, which is also in confluence with the 200-period EMA, currently placed around ₹2,830. This makes the ₹2,820–₹2,840 zone a crucial breakout level.
Once price convincingly breaks and closes above this level with volume confirmation, it could trigger a fresh upside rally. The current price action around ₹2,720 (+1.34%) on the breakout candle indicates building momentum.
3. Projected Targets After Breakout
Upon successful breakout, the measured move (based on wedge height) gives us three major targets:
Target 1: ₹2,980
This level is close to the psychological ₹3,000 mark and would be the first hurdle where partial profit booking may be considered.
Target 2: ₹3,121
A further extension of the breakout move. This level marks previous minor resistance and could act as a midpoint of the rally.
Final Potential Target: ₹3,371
This target is based on the maximum height of the wedge added to the breakout zone and also aligns with a historical resistance zone. A rally to this level would indicate complete bullish validation of the pattern.
4. Trade Setup for Traders
This breakout provides a favorable risk-reward opportunity for swing and positional traders. Here's a sample trade plan:
- Entry: On breakout and close above ₹2,830 (above wedge and EMA)
- Retest Entry: On pullback to ₹2,790–₹2,810 with confirmation candle
- Stop-Loss: Below ₹2,650 (invalidates the breakout structure)
- Targets: ₹2,980 / ₹3,121 / ₹3,371
- Risk-to-Reward Ratio: Approximately 1:2.5 to 1:3.5
5. Risk Management and Trader Tips
While this setup looks promising, wait for confirmation before jumping into the trade. Many false breakouts can occur, especially around key EMAs. Also, keep an eye on volume: a genuine breakout should be accompanied by higher-than-average volume.
Other tips:
Scale-in your position rather than going full size at entry.
Keep trailing your stop-loss as the price moves in your favor.
Monitor broader market indices for sentiment cues (Nifty, Bank Nifty).
6. Conclusion: A Reversal Candidate Worth Watching
Mazagon Dock has not only respected technical levels within the wedge but is also showing strength around a key resistance–EMA confluence zone. This kind of setup, supported by a classic pattern like the falling wedge, adds more credibility to the potential move.
With clear targets and a defined stop-loss zone, the current price structure offers a high-probability reversal setup. Patience is key—let the breakout confirm itself.
Gold Plan - Waiting for a pullback to Buy safely | New ATH ahead🟡 XAU/USD – 09/09 | Captain Vincent ⚓
🔎 Captain’s Log – News Context
FED : The probability of a September rate cut is now almost certain, reinforcing confidence that flows will continue moving into Gold.
Dollar : Dropped to a 7-week low due to FED rate cut expectations, adding further support for Gold.
US Economic Data : No major news today, the market focus remains on interest rates.
⏩ Captain’s Summary: Gold remains in a strong uptrend. However, Vincent advises waiting for a pullback into support to Buy safely , avoiding chasing price at higher levels.
📈 Captain’s Chart – Technical Analysis
Storm Breaker (Resistance / Sell Zone) :
Quick Boarding: 3654 – 3656 (Short-term Sell scalp)
Storm Breaker Peak: 3673 – 3675 (Sell zone – potential new ATH)
Golden Harbor (Support / Buy Zone) :
Buy Scalp Dock: 3615 – 3617
Main Golden Harbor: 3597 – 3599 (Strong support)
Price structure remains bullish after multiple BOS – Break of Structure. Current highs may trigger short-term profit-taking waves before Gold pulls back to Golden Harbor and then rallies toward ATH 367x .
🎯 Captain’s Map – Trade Scenarios
✅ Golden Harbor (BUY – Priority with trend)
Buy Scalp: 3615 – 3617 | SL: 3598 | TP: 3620 → 3623 → 3626 → 3630 → 36xx
Main Buy Zone: 3597 – 3599 | SL: 3589 | TP: 3660 → 3663 → 3666 → 3670 → 36xx
⚡ Quick Boarding (SELL Scalp – Only at resistance)
Sell Zone 1: 3654 – 3656 | SL: 3662 | TP: 3650 → 3647 → 3644 → 3640 → 36xx
Sell Zone 2 – Storm Breaker Peak (ATH test): 3673 – 3675 | SL: 3682 | TP: 3670 → 3667 → 3664 → 3660 → 36xx
⚓ Captain’s Note
“The interest rate winds from the FED continue to power the Golden sails. Golden Harbor 🏝️ (3597 – 3599) is the safe haven for sailors trusting the bullish tide. Quick Boarding 🚤 (3615 – 3617) is just a short ride before the voyage resumes. Storm Breaker 🌊 (3654 – 3675) may bring big waves, but it’s only suitable for technical scalps – as the main current still carries Gold toward new highs.”

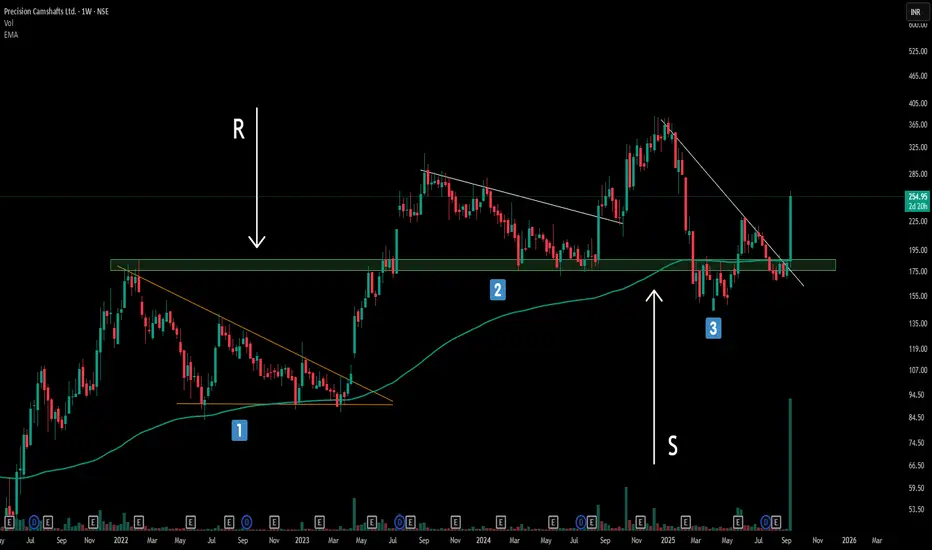
The Power of Trendline Angles : My Full time trading ExperienceBreaking Down Three Critical Trendline Structures - A Complete Analysis
Structure 1: The Power of Steep Angles (Primary Focus)
The first structure showcases what I consider the gold standard of trendline breakouts. Notice how the trendline is significantly tilted/slanted rather than following a gradual 45-degree angle.
Compressed Energy Release: Steep trendlines act like coiled springs, storing tremendous buying/selling pressure that explodes upon breakout
Key Observation: The resistance level (marked as 'R') held price down multiple times before the decisive breakout. Once broken, this level immediately flipped to become strong support (marked as 'S')—a textbook example of polarity flip dynamics.
Structure 2 & 3: Valid but Secondary Setups
While structures 2 and 3 represent legitimate continuation-based trendline breakouts, they pale in comparison to the explosive potential of Structure 1. However, they still qualify as CT (Continuation Trend) based breakout structures and shouldn't be ignored entirely
Remember: Not every trendline break deserves your attention. Focus on steep angles, exceptional volume, and clear flip confirmations for the highest probability setups. The market rewards patience and precision over frequency.
Disclaimer: Trading involves significant risk and is not suitable for all investors. Past performance does not guarantee future results. Always conduct your own research, consider seeking advice from a qualified financial advisor, and trade only with capital you can afford to lose.
XAU/USD – GOLD 08/09 | Captain VincentObserving JPY & USD | Buy still holds dominance
🔎 Captain’s Log – News Context
This morning there were no major new updates.
The US session tonight (08/09) will also not release big data.
The latest impact on the market is Japanese PM S. Ishiba’s resignation , which pressured JPY downward and slightly lifted the Dollar.
However, Gold only made a small correction and maintained strong stability.
➡️ Captain’s Summary: Dollar and JPY currently only have indirect influence, not enough to push Gold deeply lower. The main trend is still supported for a bullish rebound.
📈 Captain’s Chart – Technical Analysis
Captain’s Shield (Main Support):
Golden Harbor OB: 3542 – 3549
Main Buy Zone: 3549 – 3551
Liquidity Dock: 3573 – 3575
Storm Breaker (Resistance):
Quick Boarding: 3602 – 3604 (Short-term Sell scalp)
Storm Breaker Peak: 3632 – 3634 (Sell zone – may form a new ATH)
⏩ Price structure remains bullish (continuous BOS). Corrections are mainly liquidity grabs before pushing up to higher resistance zones.
🎯 Captain’s Map – Trade Scenarios
✅ Golden Harbor (BUY – Priority)
Buy Zone: 3549 – 3551 | SL: 3542 | TP: 3553 → 3557 → 3560 → 3563 → 35xx
Liquidity Dock: 3573 – 3575 | SL: 3565 | TP: 3578 → 3581 → 3583 → 35xx
⚡ Quick Boarding (SELL Scalp – Short-term)
Entry: 3602 – 3604
SL: 3610
TP: 3600 → 3597 → 3594 → 3591 → 3588 → 35xx
🌊 Storm Breaker (SELL Zone – New ATH)
Entry: 3632 – 3634
SL: 3640
TP: 3629 → 3625 → 3623 → 3619 → 361x
⚓ Captain’s Note
“The golden ship sails steadily as the seas remain calm this morning, with no big news waves. Golden Harbor 🏝️ (3549 – 3551) together with OB near 3542 is the safe anchorage for sailors riding the bullish trend. Liquidity Dock ⚓ (3573 – 3575) is just a temporary anchor before the bullish winds carry the ship further. Quick Boarding 🚤 (3602 – 3604) is for those who want to ride short-term waves. And if the ship touches Storm Breaker 🌊 (3632 – 3634) , it may be a new wave peak – but the grand journey is still headed North with the bullish sails full of wind.”

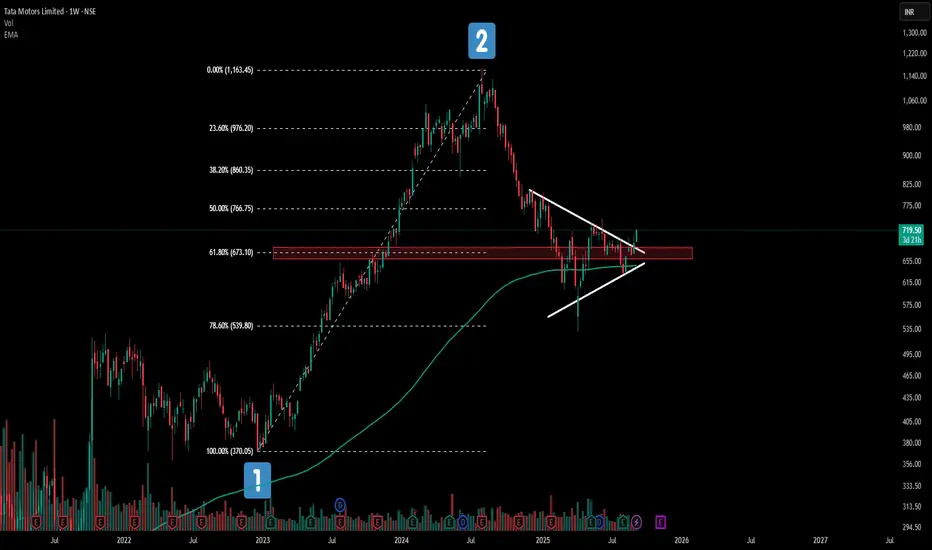
This Tata Motors Pattern Could Change Everything!Tata Motors weekly chart is painting a fascinating picture right now!
📊 Price action is dancing around the 61.8% Fibonacci retracement - a golden ratio traders love to watch.
🎯What makes this even more intriguing? The 200 EMA is playing perfect host to this consolidation party
✨While a symmetrical triangle pattern quietly takes shape. It's like watching three technical forces align in one.
Keeping it simple .
⚠️ This analysis is for educational purposes only and should not be considered as financial advice. Trading and investing in stocks involves substantial risk of loss. Please conduct your own research and consult with a qualified financial advisor before making any investment decisions
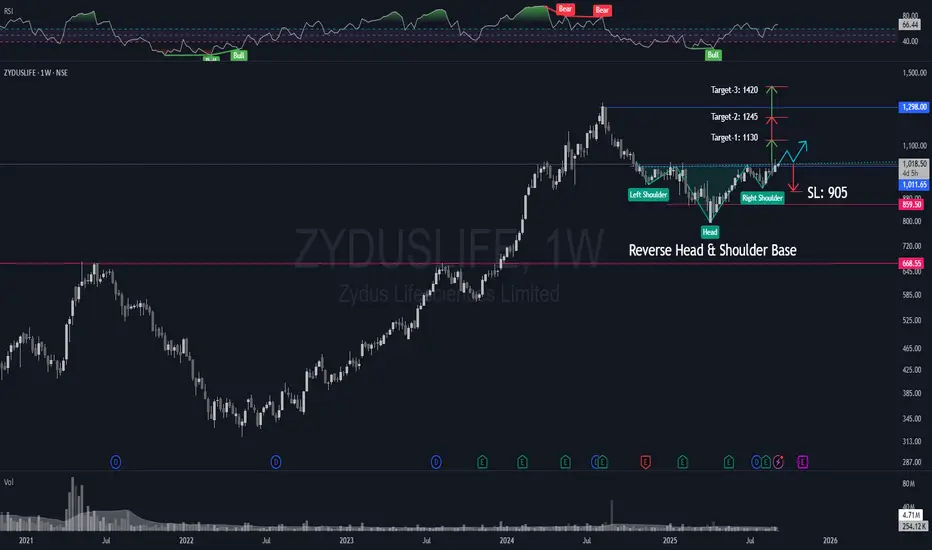
NSE:ZYDUSLIFE - Reverse Head & Shoulder Breakout (in progress)NSE:ZYDUSLIFE is showing a strong breakout (in progress) of a reserve H&S pattern on weekly charts. The stock had a nice run earlier from Jun-23 to Aug-24, and after a decent retracement, it is now ready for the next leg of the bull run. Targets and SL update in the chart.
Disclaimer: This post is for educational purposes only and must not be construed as advice to buy/sell. Please consult your investment advisor before making a financial decision. Investments are subject to market risks!
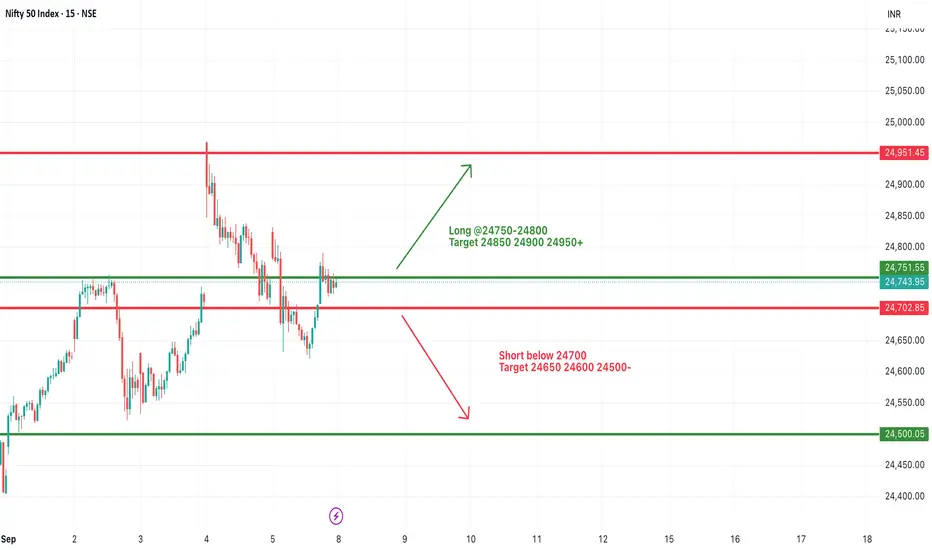
#NIFTY Intraday Support and Resistance Levels - 08/09/2025Nifty is likely to witness a flat opening today, reflecting indecisiveness among traders after recent swings. The index is trading near crucial support and resistance levels, making today’s session important for directional clarity.
On the upside, strength may build if Nifty sustains above 24,750–24,800. A successful move above this zone can trigger a rally toward 24,850, 24,900, and 24,950+. If momentum continues, it could extend further toward the 25,000 psychological mark, strengthening the bullish outlook.
On the downside, if Nifty slips below 24,700, selling pressure may intensify. A breakdown under this level could open the path toward 24,650, 24,600, and 24,500. These supports will be key for traders to watch, as failure to hold could drag the index into deeper weakness.
Overall, with a flat start on the cards, Nifty is expected to remain volatile within this range. Traders should adopt a cautious intraday approach, waiting for a clear breakout above 24,800 or a breakdown below 24,700 to initiate directional trades, while keeping strict stop-losses in place.
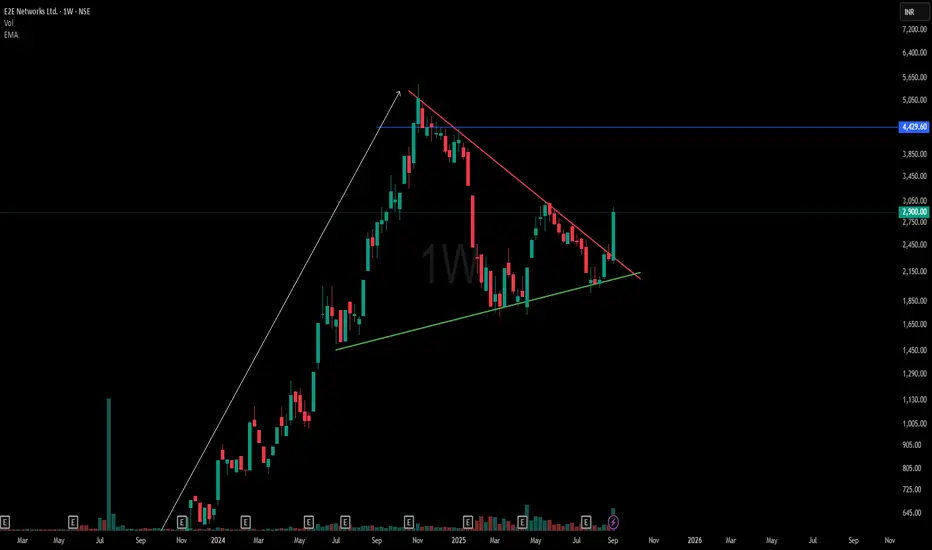
Perfect Symmetrical Triangle Chart Pattern💡 Chart Pattern Education
Symmetrical triangles are powerful continuation patterns that form when buyers and sellers reach equilibrium. The converging trendlines create a coiling effect, building pressure for the next major directional move. Studies show 68-75% success rate when traded with proper volume confirmation.
⚡ Matching the Chart shown and the above definition
✅ Higher lows trend intact on support trendline
✅ Lower highs forming clean resistance line
✅ Consolidation phase showing market indecision
✅ Volume declining as expected in triangle patterns
✅ Multiple timeframe confirmation visible
Disclaimer:
This analysis is for educational and informational purposes only and does not constitute financial advice or a recommendation to buy or sell any security. Trading involves risk, and past performance is not indicative of future results. Traders should conduct their own due diligence and consider their risk tolerance before making any trading decisions
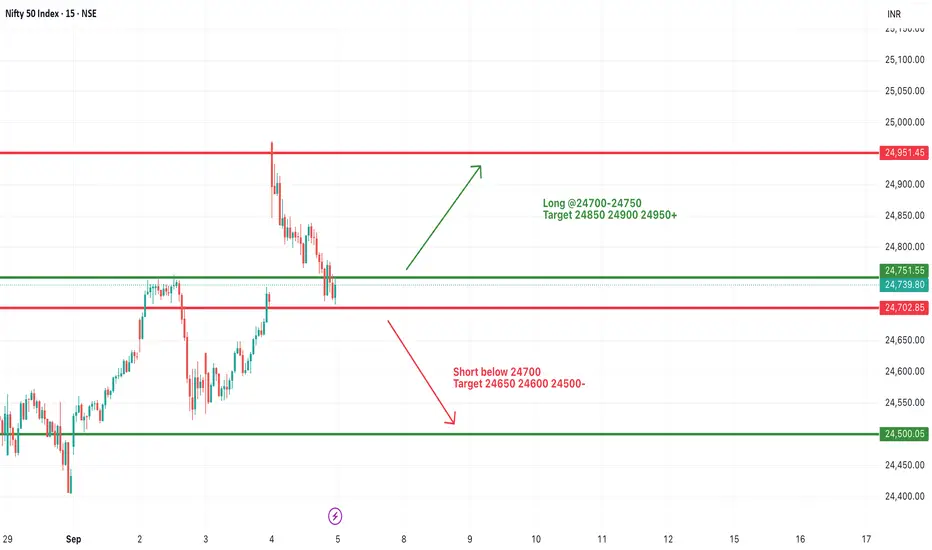
#NIFTY Intraday Support and Resistance Levels - 05/09/2025Nifty is likely to witness a slightly gap up opening, indicating a positive start to the session. The index has been consolidating in a narrow range, and today’s price action will be crucial for a directional move.
On the upside, if Nifty sustains above 24,700–24,750, it may trigger a bullish momentum. Traders can look for long opportunities in this zone with potential targets at 24,850, 24,900, and 24,950+. A breakout above 24,950 could further extend the rally, strengthening the upward bias.
On the downside, weakness may emerge if Nifty slips below the 24,700 level. A sustained move below this support could open the gates for a short opportunity, with downside targets at 24,650, 24,600, and 24,500. These levels will act as strong intraday supports and need to be watched closely.
Overall, with a slightly gap up opening, Nifty remains in a neutral-to-positive zone. A breakout above 24,750 will favor the bulls, while a fall below 24,700 may hand over control to the bears. Traders should remain cautious, trade with confirmation, and maintain proper stop-loss levels.
[INTRADAY] #BANKNIFTY PE & CE Levels(05/09/2025)Bank Nifty is expected to see a slightly gap up opening, continuing the positive sentiment from yesterday’s recovery. The index has been trading in a defined range, and today’s move will be crucial in deciding the intraday trend.
On the upside, a sustained move above 54,050–54,100 will open the door for further strength. In this case, traders can look to buy CE options with immediate upside targets at 54,250, 54,350, and 54,450+. A breakout above 54,550 will act as a major trigger for momentum, potentially extending the rally towards 54,750, 54,850, and 54,950+.
On the downside, if Bank Nifty slips below 54,450–54,400 levels, selling pressure may build up again. In that scenario, PE options can be considered, with downside targets at 54,250, 54,150, and 54,050. A further breakdown below 53,950 will add to the bearish momentum, dragging the index towards 53,750, 53,650, and 53,550 levels.
Overall, with a slightly gap up opening, Bank Nifty remains in a critical zone where both upside breakout and downside reversal are possible.

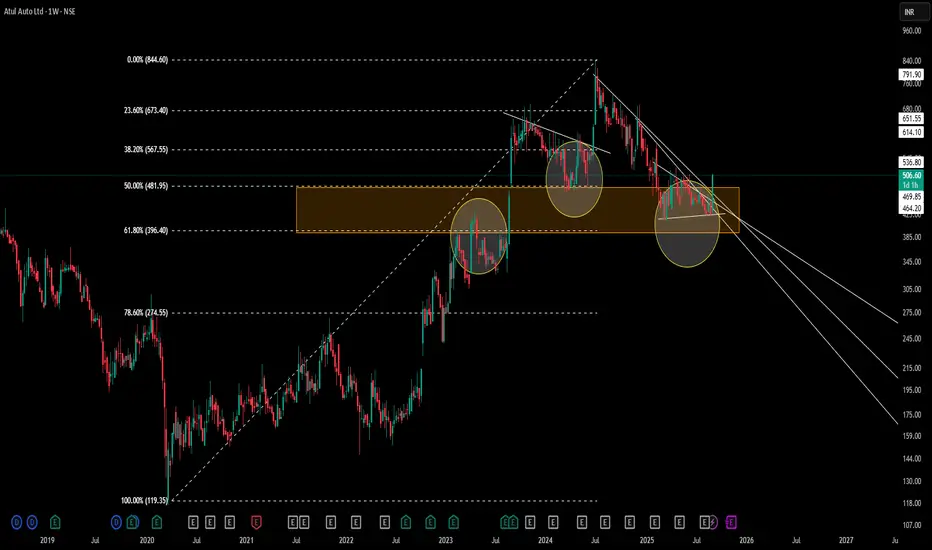
Atul Auto | MTF Fibonacci Confluence structuresWeekly Chart Analysis
– Drew a multi-timeframe Fibonacci from the 119.35 low (Mar ’20) to the 844.60 high (Oct ’24) on the Monthly time frame .
– Highlighted the 50–61.8% retracement zone (481.95–396.40) as an orange supply/demand area.
– Circles mark historical pivots where price reacted as support or resistance within this zone.
Key Observations
-Price consistently respected the 50–61.8% band during prior rallies and pullbacks.
-Recent price action formed a contracting triangle (CT) at the lower edge of the Fibonacci zone.
-Volume contraction noted inside the triangle, suggesting supply–demand equilibrium.
Disclaimer: This analysis is provided for educational and informational purposes only and does not constitute financial advice. Trading involves risk, and you should perform your own research and consider your risk tolerance before making any trading decisions.
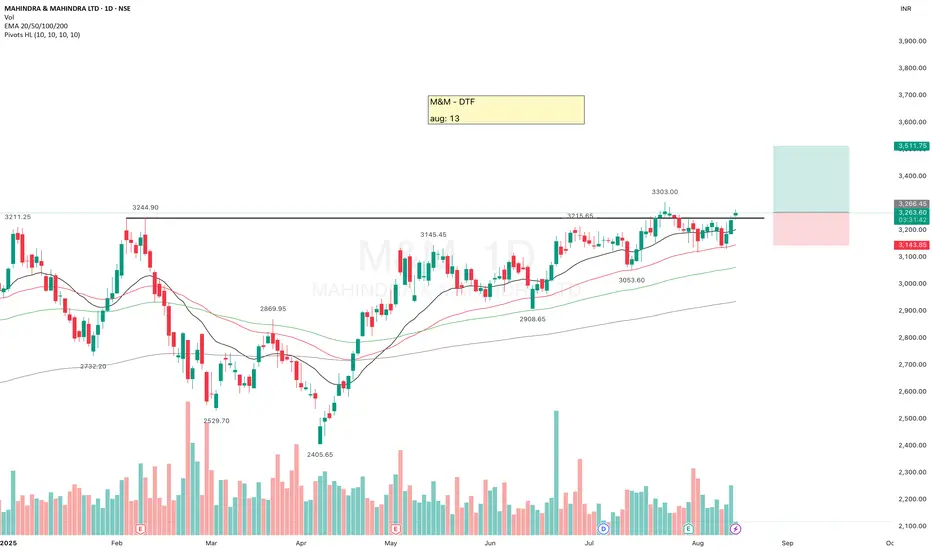
M&M (Mahindra & Mahindra)It's been a while since M&M is testing this resistance.
Looking strong, moving above key EMAs, good volume, continuously contracting near the resistance. If it sustains this level then it may give a good upside move.
Keep eyes on it.
Must use SL, it always safeguard your Capital.
✅ If you like my analysis, please follow me as a token of appreciation :)
in.tradingview.com/u/SatpalS/
📌 For learning and educational purposes only, not a recommendation. Please consult your financial advisor before investing.
XAUUSD – Gold Stalls as USD Regains StrengthThe ISM Services PMI was reported at 50.9, higher than the previous 50.1 and still above the 50 threshold – indicating that the U.S. services sector remains in expansion. This is a sign that the U.S. economy is still resilient, and the USD immediately benefited. With a stronger dollar, it’s natural for gold to come under corrective pressure.
On the 8H chart, after a sharp rally, XAUUSD was capped at the 3,579 USD resistance . From there, price showed a reversal signal and started to retreat. The nearest support lies around 3,465 USD, and if this level is broken, the probability of a deeper decline increases significantly – especially as the fundamentals continue to favor the greenback.
In the short term , I favor a bearish scenario: sell while price stays below 3,579, targeting 3,465. Only a clear close above 3,579 would bring the bullish outlook back, but for now, gold looks set for a correction.

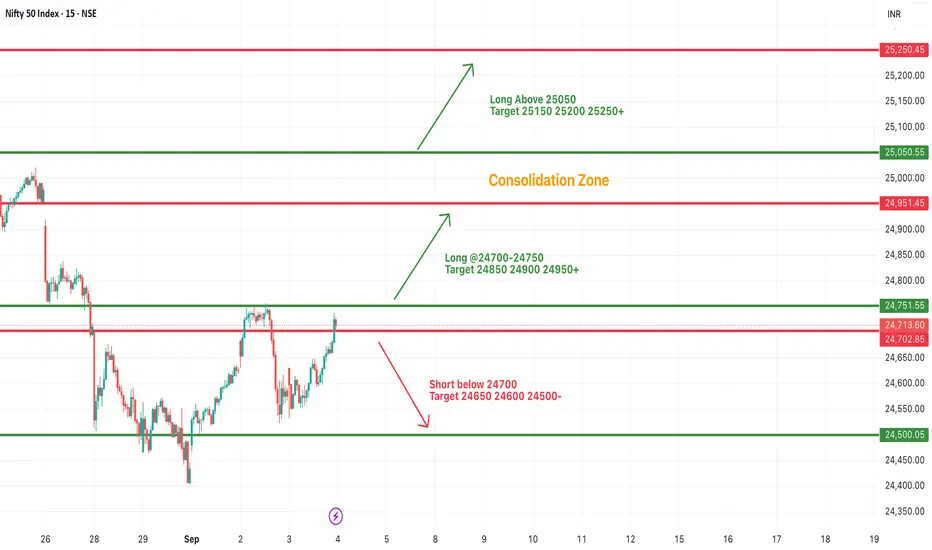
#NIFTY Intraday Support and Resistance Levels - 04/09/2025Nifty is likely to witness a gap up opening near 24,950 levels, indicating a continuation of bullish momentum from the previous sessions. The index has been consolidating in a tight range, and today’s opening could decide the next leg of the trend.
On the upside, if Nifty sustains above the 24,950–25,000 zone, it may lead to a sharp rally. In this scenario, the immediate upside targets are placed at 25,150, 25,200, and 25,250+. A breakout above 25,250 will further strengthen the bullish trend and may open the path for higher levels in the coming sessions.
On the downside, if the index fails to hold above 24,700–24,750 levels, some profit booking may drag Nifty lower. A breakdown below 24,700 could trigger weakness, with downside targets at 24,650, 24,600, and 24,500. Sustained trade below 24,500 may bring more pressure, extending the fall toward 24,350–24,300 zones.
Overall, Nifty is starting the session on a positive note with a gap up opening near 24,950, but it remains in a consolidation zone. Traders should watch for a breakout above resistance levels for bullish confirmation or a breakdown below support zones for a reversal trade. Strict stop-losses are recommended to manage volatility.
Jindal Steel Breakout Study | Momentum, Volume & Key Levels📊 STWP Stock Analysis – JINDAL STEEL (3rd Sept 2025)
Price Action:
Jindal Steel surged to a CMP of ₹1028.35, marking an impressive +5.46% gain on the day. The stock is currently riding on strong momentum with a clear bullish crossover trend, signaling further upside potential. However, traders must remain cautious as the risk level is high, fueled by sharp price swings. What adds conviction to the move is the heavy volume participation, showing strong market interest and active participation by investors.
Volume & Participation
Jindal Steel witnessed a massive trading volume of 45.2 lakh shares today, almost 2x its 20-SMA average of 19.9 lakh shares (Volx: 1.98x ). This sharp surge in participation clearly highlights the presence of strong hands in action, adding weight to the bullish move and reinforcing market conviction.
Indicator Check
The indicators are painting a mixed yet insightful picture for Jindal Steel. The RSI at 61.1 shows strong momentum, while the CCI at 109 confirms a bullish bias. However, the MACD at -1.07 signals a slight bearish crossover, which needs monitoring. Meanwhile, the Stochastic at 98 suggests the stock is overbought, hinting at possible short-term profit booking. Importantly, prices remain above all key EMAs, reinforcing the broader bullish structure.
Key levels
Resistance: 1048/1067/1105
Support: 991/953/934
📰 Latest News Snapshot — JINDALSTEL
Jindal Steel & Power is making headlines on multiple fronts. In its Q1 FY26 results (Aug 12, 2025), the company delivered a strong turnaround with net profit at ₹1,494 crore, aided by a 32% QoQ jump in EBITDA and healthier margins at 24.4%, though revenues softened to about ₹12,294 crore. On the operational side, JSPL commissioned its first continuous galvanising line (CGL-1) at Angul, Odisha, enhancing its ability to supply value-added coated steel for automobiles, appliances, infrastructure, and construction — a big step in product diversification. Meanwhile, the market responded positively as the stock surged 4–5% on heavy volumes on September 3, 2025, also factoring in its recent ₹2/share final dividend declaration.
🧭 Sentiment Outlook & Investment Perspective
Jindal Steel & Power is showing a moderately positive outlook, backed by a strong turnaround in profitability with margins and EBITDA improving, while its new galvanising line at Angul adds valuable capacity in coated steel for autos, appliances, and infrastructure — a move that strengthens its long-term product mix and earnings potential. The recent surge in trading volumes and price action highlights strong market participation, which can attract further momentum buying in the near term. However, risks remain in the form of softer revenues, exposure to the cyclical swings of steel prices and exports, and the possibility of short-term corrections after sharp rallies. In the short term, volatility may stay elevated as the stock digests its recent gains, but in the long term, the focus on higher-margin products and disciplined capacity expansion positions the company constructively for sustainable growth — making it a stock to watch with cautious optimism.
🚀 Bullish Momentum
The stock is also riding on strong technical momentum, with a Bullish Marubozu candle and an Open = Low setup, both pointing to firm buying support. A Bollinger Band breakout following a BB squeeze indicates the potential for sharp price expansion. Adding to the momentum, an RSI breakout, combined with a powerful bullish candle structure, confirms the strength of the move. The setup even aligns with a possible Buy Today, Sell Tomorrow (BTST) opportunity, making the near-term trend look decisively bullish.
📊 STWP Trade Analysis – JINDAL STEEL
JINDAL STEEL is showing strong momentum supported by volume. I will consider my entry near ₹1030 as part of a breakout setup. If the stock dips closer to ₹1015, I will look at that as a more conservative entry with tighter risk, which suits my swing trading approach.
For me, the pullback level around ₹954.25 is an important support zone where buyers might re-enter, while the invalidation level near ₹910 would signal that my bullish view has failed. On the upside, I will be watching ₹1117 and ₹1205 as possible target zones if momentum continues. 🚀
⚠️ Disclaimer – Please Read Carefully
The information shared here is meant purely for learning and awareness. It is not a buy or sell recommendation and should not be taken as investment advice. I am not a SEBI-registered investment advisor, and all views expressed are based on personal study, chart patterns, and publicly available market data.
Trading — whether in stocks or options — carries risk. Markets can move unexpectedly, and losses can sometimes exceed the money you have invested. Past performance or past setups do not guarantee future results.
If you are a beginner, treat this as a guide to understand how the market works — practice on paper trades before risking real money. If you are experienced, always assess your own risk, position sizing, and strategy suitability before entering trades.
Consult a SEBI-registered financial advisor before making any real trading decision. By engaging with this content, you acknowledge full responsibility for your trades and investments.
💬 Found this useful?
🔼 Give this post a Boost to help more traders discover clean, structured learning.
✍️ Drop your thoughts, questions, or setups in the comments — let’s grow together!
🔁 Share with fellow traders and beginners to spread awareness.
👉 “If you liked this breakdown, follow for more clean, structured setups with discipline at the core.”
🚀 Stay Calm. Stay Clean. Trade With Patience.
Trade Smart | Learn Zones | Be Self-Reliant 📊

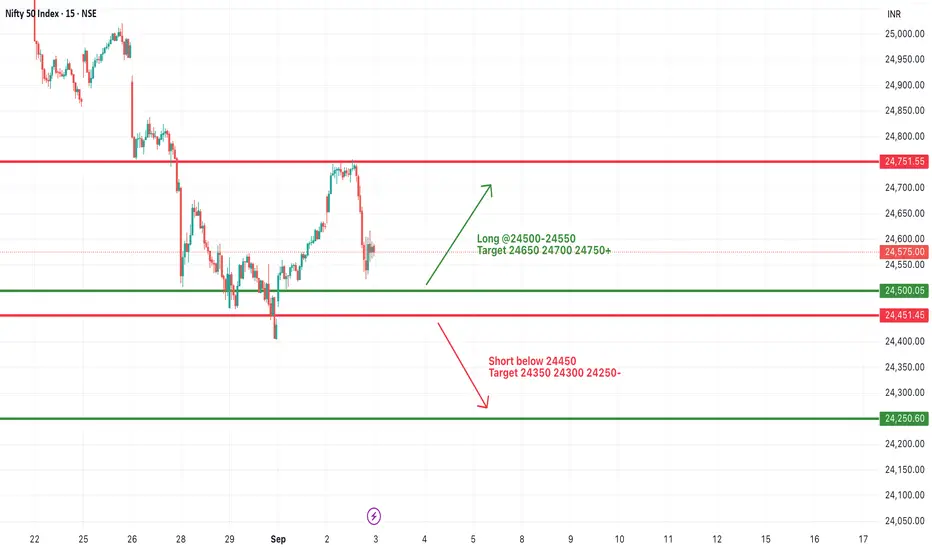
#NIFTY Intraday Support and Resistance Levels - 03/09/2025Nifty is expected to witness a slightly gap down opening today, indicating mild pressure in the index after the recent bounce. The price structure shows that the market is consolidating within a broader range, and today’s opening could set the tone for intraday moves.
On the upside, if Nifty sustains above 24,500–24,550 levels, buying momentum may return. In such a case, the index can move higher toward 24,650, 24,700, and 24,750+. A strong breakout above 24,750 will open the doors for further upward movement, potentially testing 24,850 and beyond.
On the downside, if Nifty slips below 24,450, selling pressure may drag the index lower. Key downside targets in this scenario will be 24,350, 24,300, and 24,250–24,200. Sustained weakness below 24,250 may lead to deeper cuts in the coming sessions.
Overall, today’s session is expected to start with a slightly gap down opening, keeping the index in a range-bound mood. Traders should focus on key levels to identify breakout or breakdown opportunities and maintain strict stop-losses to manage risk effectively.