XAUUSD (H1) – Monday Trading StrategyLana prioritizes selling setups until a new high is broken.
Quick summary
Technical context: Price has pulled back strongly from the All-Time High, showing short-term weakness.
Daily bias: Sell on rallies, until price breaks and holds above a new high.
Key events: Speech from U.S. President Trump and updates related to U.S.–China trade may increase volatility.
News impact – what to watch
Trump’s speech: Often drives short-term USD sentiment through comments on growth, tariffs, and inflation. Gold may react sharply to headline risk.
U.S.–China trade activity (CCPIT): Any improvement in trade sentiment can support USD in the short term, adding pressure to gold. Rising tensions would favor gold as a safe haven.
Because of this, Lana will focus on price reaction at key zones rather than predicting the news outcome.
Technical analysis (H1)
Gold printed a new All-Time High and then sold off aggressively, signaling profit-taking near the top.
Price is now consolidating within a corrective structure, where selling rallies remains the higher-probability play.
Key zones identified on the chart:
Sell zone: 4529 – 4531
Buy reaction zone: 4498 – 4500 (support)
Trading plan for Monday
Primary scenario – Sell rallies
Sell: 4529 – 4531
This zone is expected to act as resistance during the current correction.
Bias change condition:
Only shift to a bullish continuation if price breaks above the previous high and holds.
Secondary scenario – Short-term buy reaction
Buy: 4498 – 4500
This is considered a scalp-only setup, as the overall intraday bias remains bearish.
Session notes
Asian session may remain slow, while volatility is likely to increase around the scheduled events.
Best trades are expected when price returns to planned zones rather than trading in the middle of the range.
This analysis reflects Lana’s personal market view and is not financial advice.
Technical Analysis

#NIFTY Intraday Support and Resistance Levels - 29/12/2025A flat opening is expected in Nifty 50, with the index trading around the 26,050 zone, which is acting as a short-term equilibrium and consolidation area. After the recent corrective move from higher levels, price has stabilized and is now moving sideways, indicating a pause in momentum where both buyers and sellers are evenly matched. This confirms that the market is in a consolidation phase and is waiting for a clear directional trigger.
On the upside, the 26,050–26,100 zone remains the immediate resistance and a crucial breakout level. If Nifty manages to sustain above this zone, long positions can be considered with upside targets placed at 26,150, 26,200, and 26,250+. A decisive breakout above this resistance may attract fresh buying and short covering, leading to a continuation toward higher levels.
On the downside, the 25,950 level is the key support to watch. A breakdown below this level may increase selling pressure, opening the path for short trades with downside targets at 25,850, 25,800, and 25,750-. Until a confirmed breakout or breakdown occurs, traders should continue to focus on range-bound strategies, trade near support and resistance, and maintain strict risk management in this consolidation-driven setup.

[INTRADAY] #BANKNIFTY PE & CE Levels(29/12/2025)A flat opening is expected in Bank Nifty, with the index trading near 59,000, indicating continuation of the recent weak-to-range-bound structure. Price action shows Bank Nifty drifting lower from higher levels and now stabilizing near a key demand zone, suggesting that sellers are slowing down but buyers are still cautious. Overall sentiment remains neutral, and the index needs a decisive move to establish fresh direction.
On the upside, the 59,050–59,100 zone is the immediate resistance and a crucial trigger for bullish momentum. If Bank Nifty sustains above this zone, long trades can be considered with upside targets at 59,250, 59,350, and 59,450+. A breakout above this resistance may lead to short-covering and intraday buying interest toward higher levels.
On the downside, the 58,950–58,900 range remains a critical support. A breakdown below this zone may accelerate selling pressure, opening the path for short trades with downside targets at 58,750, 58,650, and 58,550-. Until a clear breakout or breakdown occurs, traders are advised to focus on level-based trading, maintain strict stop losses, and avoid aggressive positions in this consolidating and mildly bearish setup.

XAUUSD (H4) – Weekly StrategyBull trend still in control | Buy the pullback at 4430, sell reaction at 4573, target 4685
Weekly strategy snapshot
On H4, gold is still holding a strong bullish structure inside the rising channel. Price has already expanded higher, so next week I’m not chasing — I’m prioritizing a trend buy on pullback into liquidity. Above, the 1.618 Fibonacci zone is a clean area for a reaction sell / profit-taking.
1) Technical view (based on your chart)
H4 structure remains bullish: higher highs + higher lows.
Price is extended after the breakout, so mid-range entries are risky.
The chart clearly marks Sellside Liquidity – Buy 4430 as the key “reload” area.
Upside zones: Sell 4573 (Fibo 1.618) and the extension target 4685.
2) Key Levels for next week
✅ Buy zone (Sellside Liquidity): 4430
✅ Sell reaction (Fibo 1.618): 4573
✅ Extension target: 4685
3) Weekly trading scenarios (Liam style: trade the level)
Scenario A (priority): BUY the pullback with the trend
✅ Buy: around 4430 (wait for a liquidity sweep + reaction)
SL (guide): below the 4430 zone (refine on lower TF / spread)
TP1: 4530 – 4540
TP2: 4573
TP3: 4685 (if momentum continues)
Logic: After a breakout, price often returns to “collect liquidity” before the next leg higher. 4430 is the cleanest dip-buy location on this structure.
Scenario B: SELL reaction at premium Fibonacci (short-term)
✅ Sell: around 4573
SL (guide): above the zone
TP: back toward value / potentially toward 4430 if a clear correction develops
Logic: 4573 is a premium area where profit-taking often shows up. This is a reaction sell — not a long-term bearish bias.
4) Macro context (from your news) & gold impact
Trump’s comments on tariffs, a sharper reduction in the trade deficit, and strong GDP messaging can keep markets sensitive to USD / yields expectations. That can create sharp intraday swings.
At the same time, policy and geopolitical uncertainty still supports safe-haven demand — which is why the best approach remains: follow the trend, enter at liquidity.
5) Risk notes
Don’t chase at highs.
Only act at the levels: 4430 or 4573.
Max risk per trade: 1–2%.
What’s your bias for next week: buying the 4430 pullback, or waiting for 4573 to sell the reaction?

XAUUSD (H4) – Trading Rising ChannelLana focuses on pullback buys for the week ahead 💛
Weekly overview
Primary trend (H4): Strong bullish structure, price is respecting a clean ascending channel
Current state: Price is trading near ATH and Fibonacci extensions → short-term reactions are possible
Weekly strategy: No FOMO. Lana prefers buying pullbacks at value zones, not chasing highs
Market context
Recent comments from the U.S. highlight strong economic growth and confidence in trade policies. While such statements can influence USD sentiment, gold at year-end is often driven more by liquidity conditions and technical structure than headlines.
With holiday liquidity thinning out, price movements can become sharper and less predictable. That’s why this week Lana stays disciplined and trades strictly based on structure and key levels.
Technical view based on the chart (H4)
On the H4 timeframe, gold is moving smoothly within a rising channel, consistently forming higher lows. The strong impulse leg has already completed its psychological breakout phase, and price is now hovering near the upper area of the channel.
Key points:
Fibonacci extension zones near the top act as psychological resistance, where temporary pullbacks are normal.
The best opportunities remain inside the channel, around value and liquidity zones.
Key levels Lana is watching this week Primary buy zone – Value Area (VL)
Buy: 4482 – 4485
This is a value zone within the rising channel. If price pulls back here and holds structure, continuation to the upside becomes more likely.
Safer buy zone – POC (Volume Profile)
Buy: 4419 – 4422
This POC zone shows heavy prior accumulation. If volatility increases or price corrects deeper, this area offers a more conservative buy opportunity.
Psychological resistance to respect
4603 – 4607: Fibonacci extension & psychological barrier At this zone, a short-term rejection or liquidity grab is possible before the next directional move.
Weekly trading plan (Lana’s approach)
Buy only on pullbacks into planned zones, with confirmation on lower timeframes.
Avoid chasing price near ATH or psychological resistance.
Reduce position size and manage risk carefully during low-liquidity holiday sessions.
Lana’s note 🌿
The trend is strong, but discipline at the entry is everything. If price doesn’t return to my zones, I’m happy to stay patient and wait.
This is Lana’s personal market view, not financial advice. Always manage your own risk. 💛

Bitcoin Is Quiet Again — That’s Usually When Big Moves BeginBitcoin spent multiple sessions moving sideways inside a clearly defined accumulation range.
This kind of price behavior usually signals one thing, strong hands are building positions while weak hands get shaken out.
Sideways markets are not random. They are preparation phases.
Price remained compressed inside the accumulation zone, showing balance between buyers and sellers with declining volatility.
The breakout candle was decisive and impulsive, indicating acceptance above the range rather than a fake move.
After breakout, price pulled back into the prior range high, which is a classic bullish retest behavior.
As long as price holds above the breakout base, the structure favors continuation toward the expansion zone marked on the chart.
A failure back inside the range, would invalidate the breakout and shift momentum back to neutral.
If this helped you read price better, like, follow, or comment, more clean structure studies coming.
⚠️ DISCLAIMER: This analysis is for educational purposes only and is not financial advice. Markets involve risk. Always manage your position size and do your own analysis.

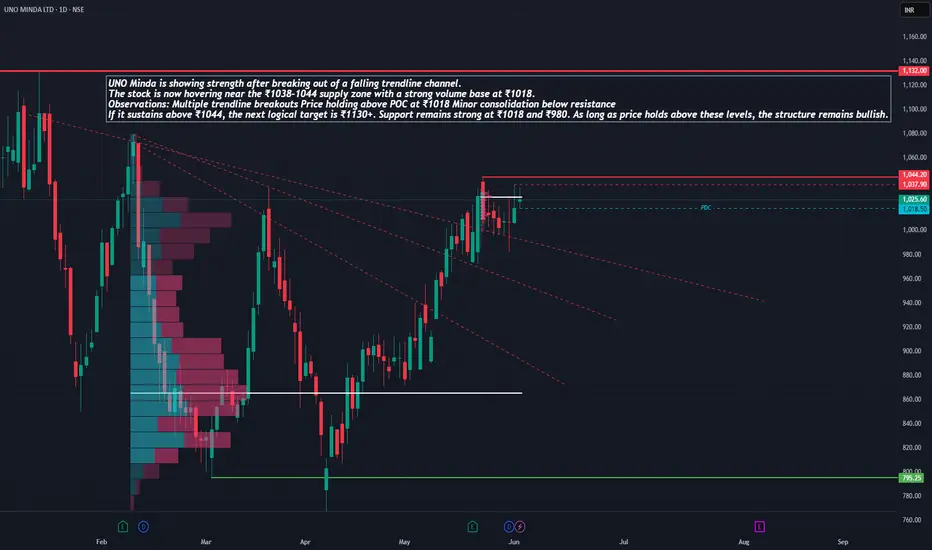
UNO MINDA – Ready to Revisit All-Time Highs?UNO Minda is showing strength after breaking out of a falling trendline channel. The stock is now hovering near the ₹1038–1044 supply zone with a strong volume base at ₹1018.
Observations:
Multiple trendline breakouts
Price holding above POC at ₹1018
Minor consolidation below resistance
If it sustains above ₹1044, the next logical target is ₹1130+. Support remains strong at ₹1018 and ₹980. As long as price holds above these levels, the structure remains bullish.
Like, comment your thoughts, and share this post
Explore more stock ideas on the right hand side your feedback means a lot to me!
Disclaimer: This post is for educational purposes only and should not be considered a buy/sell recommendation.
XAUUSD (H1) – Trading Buy LiquidityStay bullish with the rising channel, buy the pullback into liquidity
Quick view
Gold is still moving inside a rising channel. After the strong impulsive push, price is now consolidating / compressing. For today, I’m prioritizing BUY setups at liquidity + trendline retests, while keeping a reaction SELL plan at the premium Fibonacci zone above.
Macro context (why volatility can stay elevated)
Trump signing a record number of executive orders and the growing shift of power towards the executive branch increases policy uncertainty (tariffs, federal cuts, geopolitical moves). In uncertain environments, flows often rotate into safe-haven assets like gold. That said, this kind of headline risk can also move the USD sharply, so the best approach is still: trade the levels, not emotions.
Key Levels (from your chart)
✅ Buy zone Liquidity: 4410 – 4413
✅ Buy trendline retest: 4480 – 4483
✅ Sell zone (Fibo 1.618): 4603 – 4606
Today’s trading scenarios (Liam style: trade the level)
1) BUY scenario (priority)
A. Trendline retest = best structural entry
Buy: 4480 – 4483
SL: below the zone (guide: 4472–4475, adjust on lower TF / spread)
TP1: 4515 – 4520
TP2: 4580 – 4600
B. Deeper liquidity buy (if we get a sweep)
Buy: 4410 – 4413
SL: below the zone (guide: 4402–4405)
TP: 4480 → 4520
Logic: These are the cleanest liquidity areas on the chart. No chasing mid-range — I only act when price returns to the zone and reacts.
2) SELL scenario (reaction only — no chasing)
Sell: 4603 – 4606
SL: 4612
TP1: 4550
TP2: 4483
Logic: The 1.618 premium zone often attracts profit-taking. I only sell if price taps the zone and shows clear weakness on the lower timeframe.
Notes
If price keeps holding the trendline and printing higher lows → BUY bias remains stronger.
If we break the trendline and fail to reclaim it → reduce size and wait for a fresh structure.
Which side are you leaning today: buying the pullback, or waiting for 4603–4606 to sell the reaction?

XAUUSD – Bullish Channel AnalysisLana stays bullish, waiting for pullbacks to buy 💛
Quick summary
Trend: Clearly bullish, price is moving inside a well-defined rising channel
Timeframe: H1
Current state: Price is near the upper part of the channel, so a psychological reaction near Fibonacci extension is possible
Strategy: No chasing. Lana prefers buying pullbacks into value/liquidity zones
Market context
Gold remains strong into year-end, even as liquidity becomes thinner. The current push higher looks very momentum-driven, and Fibonacci extension areas often act as short-term “reaction zones” before the next directional decision.
On the longer-term side, bold forecasts like Jim Rickards’ view (gold potentially reaching very high levels in 2026) show that bullish sentiment in precious metals is still alive. Still, for Lana, short-term trading must follow structure and zones, not headlines.
Technical view: price inside a rising channel
On the chart, gold is respecting a clean ascending channel, consistently printing higher lows.
Key observations:
The upper Fibonacci extension area around 4603–4607 is a psychological barrier, where a short-term pullback can happen.
The best entries are usually found when price returns to value areas inside the channel, not at the top.
Key levels Lana is watching
Primary buy zone – Value Area (VL)
Buy: 4482 – 4485
This is a value area inside the rising channel. If price pulls back here and structure holds, continuation to the upside becomes more likely.
Deeper buy zone – Liquidity POC
Buy: 4419 – 4422 (POC)
This level shows heavy prior accumulation on the Volume Profile. If year-end liquidity causes a deeper shakeout, this zone becomes a safer area to look for buys.
Trading notes
4603–4607 is a psychological resistance zone — not a place to chase longs.
Only buy when price reaches the planned zone and shows confirmation on the lower timeframe.
With thin liquidity: reduce position size and keep risk tight.
Lana’s note 🌿
The trend is strong, but patience at the right entry matters more than catching every move. Lana follows structure, not emotions.

#NIFTY Intraday Support and Resistance Levels - 26/12/2025A flat opening is expected in Nifty 50, with the index trading around 26,140, indicating continuation of the ongoing range-bound structure. Price action suggests the market is currently oscillating between well-defined support and resistance levels, showing no immediate directional bias. This reflects a cautious tone, where buyers and sellers are evenly placed, and the index is waiting for a decisive breakout to establish momentum.
On the upside, a sustained move above 26,250 will be the key trigger for bullish continuation. If Nifty manages to hold above this level, long positions can be considered with upside targets at 26,350, 26,400, and 26,450+. A clean breakout above this resistance zone may attract fresh buying interest and strengthen bullish sentiment.
On the downside, the 26,200–26,180 zone is acting as a short-term rejection area. Failure to reclaim this zone could lead to reversal selling, with downside targets placed at 26,150, 26,100, and 26,050-. However, if the index finds support near 26,050–26,100 and shows strength, intraday long opportunities may emerge toward 26,150–26,250+. Until a clear breakout or breakdown occurs, traders should focus on level-based trades with strict risk management, avoiding aggressive directional bets in a consolidating market.

[INTRADAY] #BANKNIFTY PE & CE Levels(26/12/2025)A flat opening is expected in Bank Nifty, with the index trading around 59,150, indicating continuation of the same consolidation structure seen over the last few sessions. Price action suggests balanced buying and selling pressure near this zone, reflecting a range-bound and non-directional market at the start. Until Bank Nifty moves out of this range, traders should remain patient and avoid aggressive positions.
On the upside, a sustained move above 59,550 will be the key trigger for bullish momentum. If the index holds above this level, buy-side opportunities can be considered with upside targets placed at 59,750, 59,850, and 59,950+. A breakout above this resistance may attract fresh buying and lead to a gradual upside expansion.
On the downside, failure to hold the 59,050–59,000 support zone may increase selling pressure. In such a case, put-buying or short positions can be considered with downside targets at 58,750, 58,650, and 58,550-, where strong support is expected. Until a clear breakout or breakdown occurs, traders should continue to trade levels with strict risk management, focusing on confirmation rather than anticipation.

EUR/USD – Accumulation After Sell-Off, Structure-Based Long IdeaEUR/USD has seen a strong sell-off, followed by a sharp reaction from a well-defined support zone. This area has already proven its strength by absorbing selling pressure and pushing price higher.
After the bounce, price is now consolidating near support instead of breaking down further, indicating potential accumulation at these levels.
What Price Is Telling Us: Price is holding above the support zone with multiple rejections and overlapping candles, showing a clear loss of bearish momentum. Sellers are failing to push price lower despite earlier strength.
This type of behavior often appears before a corrective move or continuation higher, especially after an impulsive decline.
If this analysis helped you, like, follow, and comment for more clean Forex breakdowns.
Disclaimer: This analysis is for educational purposes only and does not constitute financial advice. Trading involves risk, and past performance does not guarantee future results. Please manage risk responsibly.

XAUUSD (Gold) Technical Outlook - 24/12/2025XAUUSD – Gold Technical Snapshot (Intraday)
Gold remains bullish across higher timeframes (Daily–Monthly). Price is trading near 4,492, close to the day’s high, with all major moving averages aligned upward. Momentum indicators support the uptrend, though overbought conditions suggest possible short-term pullbacks.
Key_Levels
Support: 4,480 / 4,465
Pivot: 4,495
Resistance: 4,520 → 4,550 → 4,575
Outlook & Strategy
Bias stays bullish above 4,480
Buy pullbacks near support or breakouts above 4,520
Below 4,465, expect a corrective move toward 4,440–4,410
Disclaimer: This analysis is for educational purposes only and not financial advice. Trading involves risk—always manage your risk and do your own research.

#NIFTY Intraday Support and Resistance Levels - 24/12/2025A flat opening is expected in Nifty 50, with the index trading near 26,150–26,200, indicating consolidation after the recent upside move. Price is currently holding above the short-term support zone, but lack of strong follow-through suggests the market is in a pause-and-consolidate phase, waiting for a decisive trigger to define the next direction.
On the upside, a sustained move above 26,250 will be crucial to resume bullish momentum. If Nifty holds above this level, long positions can be considered with upside targets at 26,350, 26,400, and 26,450+. A breakout above this resistance zone may attract fresh buying interest and extend the upward move.
On the downside, failure to sustain above 26,200–26,180 may lead to a reversal-based selling opportunity. In such a scenario, short positions can be considered with downside targets at 26,150, 26,100, and 26,050-, where strong intraday support is placed. Until a clear breakout or breakdown occurs, traders are advised to continue focusing on level-based trades, maintain strict risk management, and avoid aggressive directional positions.

Gold 15-Min Chart: Previous Support should act as Resistance nowHello everyone, Guy's Gold has made a sharp recovery after the recent drop, but i am expecting gold should take resistance in this area. This level has already shown rejection in the past, making it a critical decision area for the market.
The rejection near this zone suggests that sellers are still active. If Gold fails to sustain above this resistance, a pullback toward the lower support areas is likely. Such pullbacks are normal after strong impulsive moves and often provide better clarity for the next direction.
As long as price stays below this resistance, upside looks limited in the short term. A clean breakout and hold above this level is required to shift the bias back to bullish.
Disclaimer: This analysis is for educational purposes only and should not be taken as financial advice. Please do your own research or consult your financial advisor before investing.

BTC Technical Outlook – Cycle High WatchBitcoin is potentially entering the final push of the current cycle, with price action forming a Head & Shoulders (H&S) structure near the newly formed ATH. While this pattern is not confirmed yet, it does raise caution for a possible local top.
📈 Upside Scenario:
Our immediate focus remains on the $111,000 zone, which aligns with a potential liquidity grab area. A push into this region followed by strong rejection would strengthen the bearish case.
📉 Risk Zone to Monitor:
If rejection occurs near $111K, attention will shift to the neckline area, which will be crucial in confirming the H&S breakdown.
⚠️ Key Takeaway:
Bullish continuation remains valid until rejection is confirmed
$111K = key upside target & decision zone
Neckline break would confirm trend exhaustion
_Wait for confirmation. Trade the reaction, not the prediction._

#NIFTY Intraday Support and Resistance Levels - 23/12/2025A gap-up opening is expected in Nifty 50, with the index trading firmly above the recent support zone and showing improving short-term strength. Price has moved higher from the 26,050 region and is now hovering near 26,150–26,170, indicating bullish continuation after the recent recovery. The overall structure remains positive as long as the index sustains above the key demand area.
On the upside, a sustained move above 26,250 will be a crucial breakout trigger. Holding above this level can attract fresh buying interest, opening the path for long positions with upside targets placed at 26,350, 26,400, and 26,450+. Strength above this resistance may further extend the rally toward higher levels in the coming sessions.
On the intraday upside, dips toward the 26,050–26,070 zone can also act as a buying opportunity if price shows stability. From this region, a bounce can lead to targets at 26,100, 26,150, and 26,200+, keeping the bullish momentum intact.
On the downside, if the index fails to sustain above 26,200–26,180 and shows rejection, a reversal short setup may come into play. In such a scenario, downside targets are seen at 26,150, 26,100, and 26,050-, where strong support is placed. Until a clear directional breakout is confirmed, traders should trade with discipline, follow key levels closely, and manage risk strictly in a gap-up driven market environment.

[INTRADAY] #BANKNIFTY PE & CE Levels(23/12/2025)A gap-up opening is expected in Bank Nifty, with the index showing a positive bias at the start of the session while continuing to trade within the broader consolidation range formed over the last few days. Price is currently hovering around the 59,250–59,300 zone, which has been acting as a short-term balance area. This indicates that despite the expected gap-up, the market is still awaiting a strong breakout for clear directional strength.
On the upside, a sustained move above 59,050–59,100 will be the first sign of bullish continuation. Holding above this zone can open opportunities for buying, with upside targets placed at 59,250, 59,350, and 59,450+. If Bank Nifty manages to break and sustain above the 59,550 level, momentum can further accelerate toward 59,750, 59,850, and 59,950+, where strong resistance is placed.
On the downside, if the gap-up fails to hold and the index slips back below 59,050, selling pressure may emerge. In such a scenario, selling can be considered with downside targets at 58,950, 58,750, 58,650, and 58,550-. Until a decisive breakout above resistance or breakdown below support is confirmed, traders should focus on range-based trades, maintain tight stop losses, and avoid aggressive directional positions in this consolidation-driven environment.

USD/CAD – Liquidity & Structure Based Short IdeaUSD/CAD has been trading inside a well-defined rising channel for a while. Price is now approaching the upper boundary of this channel, a zone where sellers have previously stepped in with strength.
This area is not just resistance, it’s also a liquidity zone, where stop-losses of late buyers are resting above recent highs. Such zones often attract smart money activity before a directional move.
What Price Is Telling Us: Price is currently stalling near resistance instead of expanding higher. We can observe Multiple rejections near the channel top, Overlapping candles showing loss of bullish momentum and Lack of strong follow-through despite previous volume spike.
This behavior often appears before distribution or a corrective move, especially when price is trading at premium levels.
If this analysis helped you, like, follow, and comment for more clean Forex breakdowns.
Disclaimer: This analysis is for educational purposes only and does not constitute financial advice. Trading involves risk, and past performance does not guarantee future results. Please manage risk responsibly.

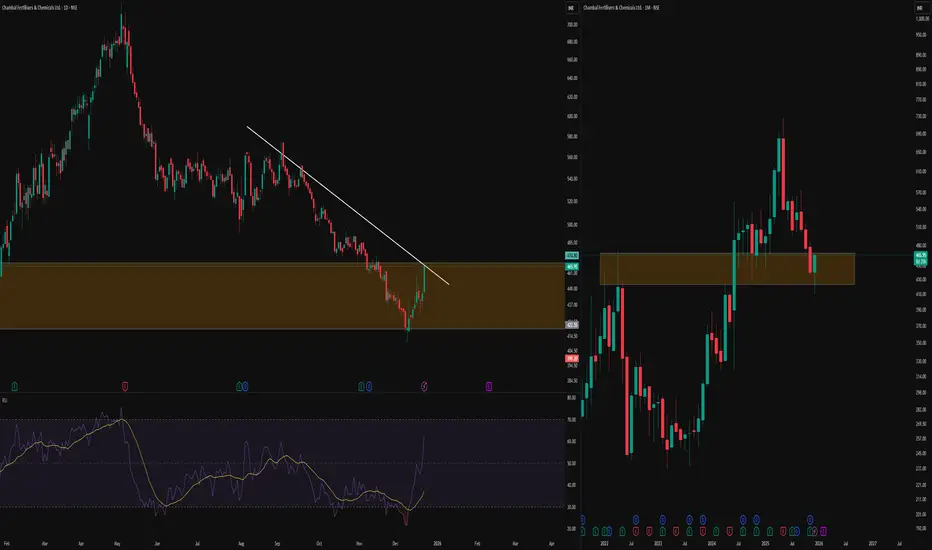
Daily vs Monthly: Counter Trendline Meets Cup Structure-This TradingView post contrasts multi-timeframe analysis, showing a clean counter trendline (CT) a white line connecting swing highs on the daily chart (left) with the monthly chart (right) revealing a classic cup pattern in the orange zone
-Key Concepts Explained
A counter trendline (CT) maps resistance from successive lower highs, highlighting areas where upward moves repeatedly stall and create liquidity zones below prior peaks. The cup breakout on monthly shows price emerging from a rounded base, followed by sustained action above the rim with multiple retests of those prior levels, demonstrating how higher timeframes contextualize lower timeframe lines.
-Educational Value
Observing CT interactions alongside cup structures illustrates price respect for dynamic resistance across timeframes, aiding in understanding market rhythm without directional assumptions. Traders use such alignments to study historical behavior at key zones.
Disclaimer: Educational content only. Not SEBI registered. No investment advice—do your own research
#NIFTY Intraday Support and Resistance Levels - 22/12/2025A gap-up opening is expected in Nifty 50, with the index opening above the crucial 26,050 level, indicating a positive bias at the start of the session. Price action over the recent sessions shows consolidation just below resistance, and this gap-up suggests an attempt to break out of the short-term range. Sustaining above 26,050 will be critical to confirm bullish intent, as this level has acted as a strong decision zone.
On the upside, a sustained hold above 26,050 can trigger fresh long positions. If strength continues, the index may move toward 26,150, 26,200, and 26,250+ in the initial phase. A further breakout above 26,250 will strengthen bullish momentum and can open higher upside targets at 26,350, 26,400, and 26,450+, where profit booking may emerge.
On the downside, if the gap-up fails to hold and Nifty slips back below the 25,950–25,900 zone, selling pressure may increase. In such a scenario, short positions can be considered with downside targets at 25,850, 25,800, and 25,750-, where strong support is placed. Until a clear follow-through is seen after the opening, traders should avoid aggressive trades, focus on confirmation above key levels, and manage risk strictly in this volatile setup.

[INTRADAY] #BANKNIFTY PE & CE Levels(22/12/2025)A gap-up opening is expected in Bank Nifty, with the index opening slightly higher but still trading within the same broader consolidation structure seen over the last few sessions. Price is currently hovering around the 59,000–59,050 zone, which continues to act as a short-term equilibrium area. This suggests that despite the positive opening bias, the market is still in a range-bound phase and needs a decisive breakout for sustained directional movement.
On the upside, a sustained move above 59,050–59,100 will be the key trigger for bullish continuation. If Bank Nifty holds above this zone, buying can be considered, with upside targets placed at 59,250, 59,350, and 59,450+. A further breakout and hold above 59,550 can accelerate buying momentum and open the path toward 59,750, 59,850, and 59,950+ levels.
On the downside, if the index fails to sustain above 59,050 and slips below the 58,950–58,900 support zone, selling pressure may emerge. In such a scenario, selling can be considered with downside targets at 58,750, 58,650, and 58,550-, where strong support is placed. Until a clear breakout or breakdown is confirmed, traders are advised to stick to range-based strategies, book partial profits at targets, and maintain strict risk management in this volatile zone.

Gold After Liquidity Grab: Short side intraday move, R you readyHello Everyone, let's analyse Gold as this once again tested a major resistance zone, but instead of giving a clean breakout, price briefly moved above the level and then quickly reversed. This move was not strength, it was a liquidity grab.
In simple words, smart money pushed price above resistance to trap breakout buyers, collect their stop-loss liquidity, and then bring price back into the range. This is why price failed to hold above the highs and started showing weakness soon after.
Right now, Gold is trading back below resistance, which keeps the short term bias cautious to bearish. If selling pressure continues, price may slowly rotate toward the lower support / demand zone, where buyers could appear again.
This chart is a good reminder that not every breakout is real. Waiting for confirmation always matters more than speed.
Disclaimer: This analysis is for educational purposes only and should not be taken as financial advice. Please do your own research or consult your financial advisor before investing.
Analysis By @TraderRahulPal | More analysis & educational content on my profile.
If this helped you understand price behavior better, like, follow, and share your view in comments.
