Eternal Ltd at a Critical Make-or-Break Zone – Long OpportunityEternal Ltd is currently trading near a well-defined demand and trendline support zone after a sharp corrective phase from its recent highs. The price action suggests that selling pressure is gradually losing strength, and the stock is attempting to stabilize around the 285–290 range. This area is technically important, as it aligns with a rising long-term trendline and acts as a base where buyers have previously stepped in.
From a moving average perspective, price is still trading below the short-term EMA, indicating that the trend reversal is not yet fully confirmed. However, the stock is holding above the major support zone and showing signs of recovery from intraday lows. A sustained move above the near-term resistance around 300–305 would be the first indication of strength and could shift the short-term bias toward bullish.
The RSI structure adds an important clue to this setup. After remaining in the lower zone for some time, RSI is attempting a bullish reversal from oversold territory. This positive divergence-like behavior indicates improving momentum and increases the probability of a relief rally. If RSI continues to move upward and sustains above the 50 zone, it would further validate the bullish case.
In the bullish scenario, once price holds above 300 on a closing basis, the stock can gradually move toward the first upside objective near 313. A breakout and hold above this level could open the path toward the next resistance around 335, followed by the extended target zone near 360 in the medium term. These targets are expected to be achieved in phases, with intermittent consolidations.
On the downside, the risk remains clearly defined. A decisive breakdown below the 280 support zone would invalidate the bullish setup and may lead to further downside pressure. Hence, this is not a confirmed breakout trade yet, but rather an early-stage opportunity near strong support where risk-to-reward remains favorable if managed properly.
Overall, Eternal Ltd is presenting a potential long opportunity near its base, supported by structure and improving momentum. Traders should wait for confirmation above resistance levels for higher conviction, while positional participants may track this zone closely with strict risk management in place.
Technical Analysis

#NIFTY Intraday Support and Resistance Levels - 15/12/2025A flat opening is expected in Nifty, with price continuing to respect the same key levels observed in previous sessions. The index remains trapped inside a well-defined consolidation range, with 25,954–26,051 acting as the immediate supply–demand zone. The lack of fresh momentum indicates that the market is waiting for a decisive trigger before choosing direction.
On the upside, a sustained move above 26,050 will be the first sign of strength. If Nifty manages to hold above this level, long opportunities can open up toward 26,150, 26,200, and 26,250+, aligning with the upper resistance zone marked on the chart. Any breakout above this zone should ideally be supported by strong volume for confirmation.
On the downside, failure to hold the consolidation zone and a move below 25,950–25,900 may invite selling pressure. In such a scenario, short trades can be considered with downside targets at 25,850, 25,800, and 25,750-, where previous buying interest was seen. Until a clear breakout or breakdown occurs, traders should expect range-bound movement, focusing on level-based trades with disciplined risk management.

[INTRADAY] #BANKNIFTY PE & CE Levels(15/12/2025)A flat opening is expected in Bank Nifty, indicating a continuation of the ongoing range-bound structure. Price is currently trading between the immediate resistance zone of 59,450–59,550 and the support zone near 59,050, showing clear signs of consolidation after the recent volatile moves. This zone has repeatedly acted as a decision area where both buyers and sellers are active, suggesting that directional clarity will come only after a decisive breakout or breakdown.
On the upside, a sustained move above 59,550 will signal strength and can be used as a buying opportunity in buying, with upside targets placed at 59,750, 59,850, and 59,950+. A strong hold above this resistance can invite fresh momentum-driven buying, pushing Bank Nifty back toward the psychological 60,000 zone.
On the downside, if the index slips below 59,450–59,400, selling pressure may increase. In that case, selling can be considered, with downside targets at 59,250, 59,150, and 59,050-. The 59,050 level remains a crucial support, and any breakdown below this zone may accelerate further weakness. Until a clear breakout occurs, traders should expect range-bound price action with intraday opportunities near the mentioned levels, keeping strict risk management in place.

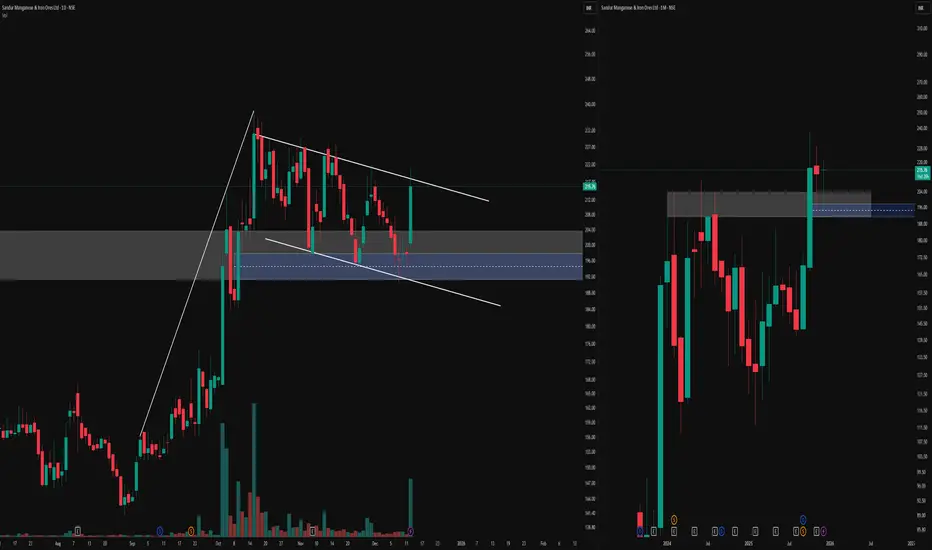
Multi‑Timeframe Flag & Fair Value Gap ObservationOn the left, the daily timeframe is highlighting a potential flag‑and‑pole structure after a strong one‑sided move.
Within this leg, a blue fair value gap has been marked, which price has interacted with multiple times, illustrating how an imbalanced area can act as a reference zone over time.
On the right, the monthly timeframe of the same instrument is added to provide broader structural context to the daily pattern.
This multi‑timeframe layout is meant purely to show how a lower‑timeframe pattern and an identified fair value gap can be viewed alongside the higher‑timeframe trend without attaching any directional bias.
Disclaimer: This post is for educational and illustrative purposes only and does not constitute investment, trading, or financial advice. Always do your own research and consult a registered financial professional before making any trading decisions.
BPCL Breaks Structure, Big Targets Ahead: Long-Term Chart TurnsBPCL is currently positioned at a highly important zone on the higher-timeframe chart where price is attempting to shift from a prolonged consolidation into a potential expansion phase. The stock has respected a long-term structure and is now trading near a critical breakout region, making it an interesting candidate for positional and long-term traders. However, the setup is still in the developing stage and requires confirmation before any aggressive long exposure.
From a structure perspective, BPCL has formed a broad base after a long corrective phase. Price action is compressing near the upper boundary of this range, suggesting that volatility expansion could occur in the coming sessions. A sustained move above the key resistance zone, accompanied by strong volume and follow-through candles, would indicate strength and increase the probability of an upside continuation toward higher targets.
In the bullish scenario, a confirmed breakout and successful retest could open the path for a gradual move toward the next resistance cluster. If momentum sustains, the stock may attempt a trend continuation move in phases rather than a straight rally. Positional traders should focus on price holding above the breakout level on closing basis, as this will be the primary sign of trend acceptance by the market.
On the other hand, if BPCL fails to break and hold above the resistance zone, the stock may slip back into its previous consolidation range. In such a case, sideways or corrective movement cannot be ruled out, and premature long positions may face drawdowns. A deeper rejection from resistance would indicate that buyers are not yet in control.
Risk management remains crucial in this setup. Since the breakout is not yet confirmed, any long exposure should be planned only after clear confirmation, with a strict stop loss below the invalidation zone. This approach helps protect capital while allowing participation in the upside if the breakout sustains.
Overall, BPCL is at a decisive technical juncture. The chart structure favors a bullish bias in the medium to long term, but confirmation is key. Traders and investors should remain patient, track price behavior around the breakout zone, and act only when the market clearly validates the move.

Angel One on the Edge: Long-Term Chart Points to 4800+The monthly chart of Angel One shows a well-defined broadening wedge pattern, where price has been repeatedly oscillating between a rising support line and a widening resistance zone. The structure has been forming for almost two years, indicating a long consolidation phase after a strong uptrend. Currently, the price is trading near the lower trendline support, which aligns with the long-term uptrend support. This zone is marked as the Buying Zone, suggesting that the risk-reward ratio is favourable for long-term buyers as long as the support remains intact.
A potential breakout above the upper wedge resistance may trigger a strong upside rally. The first major level on the upside is the Reversal Target around 3050, which is the initial confirmation level. If price sustains above this, the momentum may carry it towards the Breakout Target near 3500, which represents the first official breakout swing. Once this level is surpassed, the trend may accelerate towards Target 2 around 3900, indicating continuation of the long-term bullish structure. The complete projected move from the pattern height signals a Final Projected Target around 4840, which is the long-term positional upside expectation.
On the downside, the setup remains valid only while the price trades above the lower trendline region. A sustained close below the marked failure level would invalidate the pattern, signalling potential weakness and a breakdown of the long-term bullish structure. However, until that failure zone is breached, the pattern continues to favour a bullish breakout scenario with upward projections as highlighted.

XAUUSD (Gold) Technical Outlook - 12/12/2025XAU/USD is trading around $4,278 with a Strong Buy trend across all major timeframes, confirming a solid bullish structure. As long as price holds above the 4,257 pivot, the uptrend remains intact, supported by the price trading above all moving averages. The bullish targets for the day are 4,283 → 4,311 → 4,340, with ideal buying opportunities on dips between 4,260–4,270 or a breakout entry above 4,285. Stop-loss for dip buying is 4,247, and for breakout buying is 4,270. A bearish scenario becomes valid only if price falls below 4,257, opening downside targets toward 4,230 and 4,175, but this remains a low-probability setup.
Price: $4,278 | Trend: Strong Buy
All timeframes (30M–Monthly) show bullish momentum
Price trading above all MAs = uptrend confirmed
Bullish Scenario
Bullish above 4,257
Targets: 4,283 → 4,311 → 4,340
Buy dips: 4,260–4,270
Breakout buy: Above 4,285
Bearish Scenario (Low Probability)
Bearish only below 4,257
Targets: 4,230 → 4,175
Day Strategy
Dip Buy SL: 4,247
Breakout Buy SL: 4,270
Disclaimer: This analysis is for educational and informational purposes only. It is not financial advice. Trading in Forex, Commodities, and Crypto involves risk. Always do your own research and trade at your own responsibility.

#NIFTY Intraday Support and Resistance Levels - 12/12/2025A gap-up opening is expected today, and price is currently sitting near the upper band of the recent consolidation zone. The overall structure remains the same, with 25,954–26,051 acting as a critical zone where sellers have been active over the past few sessions. Any sustained move above 26050 can trigger a strong upside momentum, opening long opportunities toward 26150, 26200, and 26250+, as this level marks a clear breakout above the congestion area.
On the downside, if the price fails to hold above the consolidation zone and slips back toward 25950–25900, short positions may get activated again, with potential targets at 25850, 25800, and 25750-, aligning with previous demand rejections. The broader range is still intact, and today’s gap-up may simply retest the same resistance unless buyers show strong follow-through strength.

[INTRADAY] #BANKNIFTY PE & CE Levels(12/12/2025)A slightly gap-up opening is expected today, and there are no major changes from yesterday’s levels. The market is still trading within the same range, so the key zones remain intact. On the upside, a buying opportunity emerges around 59050–59100, with potential targets at 59250, 59350, and 59450+. A stronger bullish move may come only above 59550, which can extend the rally toward 59750, 59850, and even 59950+.
On the downside, weakness may appear if the price slips toward 59450–59400, where a selling setup activates with targets at 59250, 59150, and 59050-. A deeper correction comes below 58950, opening further downside toward 58750, 58650, and 58550-. Overall, the structure remains unchanged, with the same reaction zones likely to drive intraday momentum.

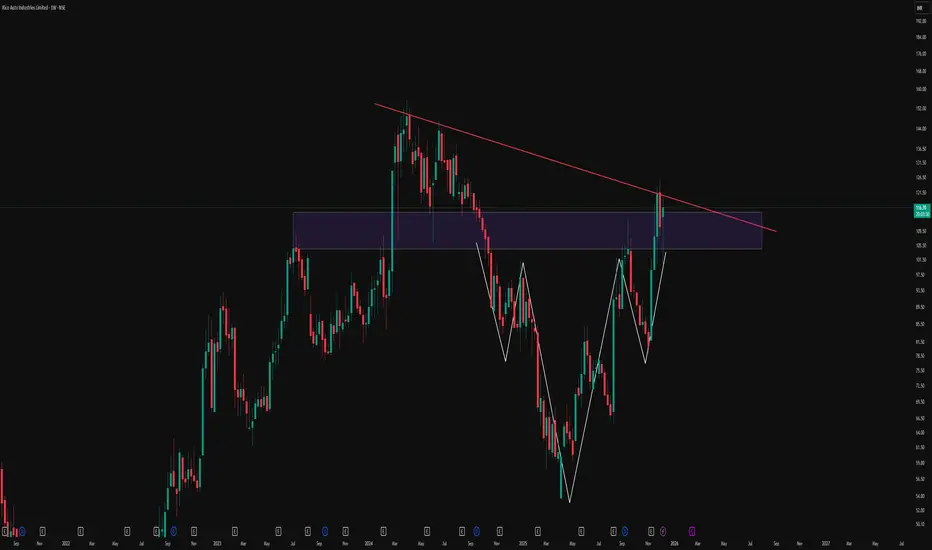
Reclaiming The Breakdown: Descending Triangle To Inverse HnSThis weekly chart of Rico Auto illustrates how structure can evolve over time and why rigid bias around a single pattern can be misleading. Price initially respected a clear descending trendline, forming a classic descending triangle and eventually breaking down below the support zone. Instead of continuing in a straight-line downtrend, the market absorbed that move and began to build a broader basing structure.
Over the following swings, price developed an inverted head and shoulders formation, highlighted here with the white structure, right inside and just below the prior breakdown area. As the pattern matured, price not only reclaimed the prior horizontal zone but also pushed back toward the original red counter-trendline that once acted as dynamic resistance. The same trendline that confirmed the initial triangle breakdown is now being revisited, showing how former breakdown structures can later turn into key decision zones rather than one-way signals.
This chart is shared purely to study how multiple patterns can co-exist and morph on higher timeframes:
-A descending triangle that initially breaks to the downside
-A subsequent inverse head and shoulders basing pattern
-A later reclaim of the old breakdown area and retest of the descending trendline
Disclaimer
This post is for educational and illustrative purposes only and is not investment, trading, or financial advice. Please do your own research and consult a registered financial professional before making any trading or investment decisions.
XAUUSD Short AnalysisAnticipating Shorts on XAUUSD
Gold has already been at its major resistance point, rejecting the upper resistance point multiple times.
Looking forward for a bearish push on gold with both short and long term PoV's as described in the chart.

LOOKING FOR GOOD SETUP AND TIGHT RANGE NSE:JAMNAAUTO
It has repeatedly rejected resistance at ₹125 on the daily chart. A decisive breakout above ₹125 could trigger strong momentum. The weekly chart also shows bullish patterns, supporting potential swing and short-term gains. With an all-time high breakout likely soon, now's the time to watch closely.
now CMP is 121.80

#NIFTY Intraday Support and Resistance Levels - 11/12/2025Nifty is likely to open with a gap-up around the 25,750–25,800 zone. This area is also your first intraday long trigger and an important support-turned-demand region. If Nifty holds the gap-up and sustains above 25,750–25,800, then upside momentum may build quickly toward 25,850, 25,900, and 25,950+, where the nearest supply and seller zones are placed.
A stronger rally will emerge only when Nifty moves above 26,050, which is the major breakout level. Once this zone is crossed with volume, Nifty can push toward 26,150, 26,200, and 26,250+. Since today is expected to open higher, Nifty may attempt to enter this broader consolidation zone, but confirmation is crucial before taking aggressive longs.
On the downside, despite the gap-up, caution is required. If the opening spike fails and Nifty slips back below 25,900–25,950, the index may trigger a short opportunity toward 25,850, 25,800, and 25,750-. A deeper weakness comes only if Nifty breaks below 25,700, which invalidates the gap-up strength. Below 25,700, short trades remain valid with targets 25,650, 25,550, and 25,500-.

[INTRADAY] #BANKNIFTY PE & CE Levels(11/12/2025)Bank Nifty is likely to open slightly gap-up today, which may give the index a positive start near the immediate resistance zone of 59050–59100. This region will act as the first crucial decision point for the day. If Bank Nifty sustains above 59050–59100, we can expect bullish momentum to pick up, triggering buying opportunities with targets toward 59250, 59350, and 59450+, where the next supply zone is placed. A stronger rally will emerge only if the index moves above 59550, which opens the door for an upside extension toward 59750, 59850, and 59950+, making this level the key breakout zone for trend continuation.
On the downside, if the gap-up fails and Bank Nifty slips below 58950, weakness will re-enter the market. Below this level, selling opportunities remain valid with targets at 58750, 58650, and 58550-, as the structure turns bearish again and selling pressure may dominate. A deeper fall can come if the index approaches the major support near 58553, which is the lower range boundary. As long as Bank Nifty trades above this level, the broader structure remains range-bound with intraday volatility.
Overall, today’s sentiment is slightly positive due to the expected gap-up, but confirmation will come only if the index sustains above the intraday breakout zones. Traders should watch 59050, 59100, and 59550 closely for upside continuation and 58950 for any downside reversal.

The Most Important Bitcoin Level of This Cycle — Don’t Miss It.Bitcoin is once again testing its multi-year rising support trendline, the same zone that has triggered every major rally since 2020. Price has repeatedly formed higher lows, showing that long-term buyers are still defending this structure.
What makes this zone special is the confluence:
A macro rising support trendline that has held for nearly 4 years.
A fresh institutional demand zone between 88k–92k.
Volume spike indicating renewed accumulation.
Rejection from macro rising resistance , resetting liquidity below.
This type of setup usually appears before expansion moves. As long as BTC holds above this macro support, the market continues to favor upside targets:
1st Target: 106,770 (conservative)
2nd Target: 124,250 (mid-term)
3rd Target: 135,800+ (macro breakout zone)
But here’s the key point:
A clean breakdown below the structure would delay the bullish cycle, until then, dips into the demand zone remain high-probability accumulation opportunities for long-term traders.
History rarely repeats perfectly…
but it often rhymes, and BTC is back at the same place where big moves begin.
Analysis By @TraderRahulPal | More analysis & educational content on my profile.
Disclaimer:
This analysis is for educational purposes only and is not financial advice. Markets can change quickly always manage risk, do your own research, and trade according to your plan.

LINKUSDT – Trendline Rejection Short Setup (1H)Price has tapped the major descending trendline and is showing rejection signs.
Market structure is still bearish, and price is reacting exactly at the trendline + previous supply zone.
🔎 Trade Idea
Bias: Short
Reason: Price retests descending trendline → shows rejection → aligns with bearish structure
Entry Zone: Current rejection area
Stop-Loss: Above the trendline + previous swing high
Target: Next liquidity zone / previous demand area
🧠 Why This Setup Makes Sense
Trendline is respected multiple times → strong dynamic resistance
Price failed to break structure convincingly
Clean risk–reward setup
Lower highs still intact
Overall market sentiment is neutral-to-bearish
⚠️ Risk Note
This idea is for educational purposes only.
Market conditions can change quickly—manage your risk carefully.

GRMOVER cmp 465NSE:GRMOVER
ITS A GOOD SETUP AND 20 50 200 EMA ALL KEY EMA Up now trading on 9ema support and tight range and near all time high brekout if u pick its a good to buy its only education purpose not recommended buy or sell

#NIFTY Intraday Support and Resistance Levels - 10/12/2025Nifty is likely to open gap-down today, indicating continued weakness in the short term as the index remains below the consolidation zone and is struggling to reclaim the upper resistance levels. A gap-down start around 25900–25880 keeps the bearish sentiment intact, and any early pullback may face selling pressure near 25950–25900, which is now acting as a supply zone. As long as Nifty trades below this band, short positions remain favorable with downside targets of 25850, 25800, and 25750-, where the next minor support lies. If selling pressure continues, a breakdown below 25700 will open the door for a deeper fall toward 25650, 25550, and 25500-, making this the major level to watch for a trending move.
On the upside, a recovery will only gain strength if Nifty sustains above 26050, triggering fresh long opportunities toward 26150, 26200, and 26250+, but with global cues weak and a gap-down expected, a strong upside push looks less likely during the initial session. Overall, the market bias remains bearish unless Nifty re-enters the consolidation zone and shows strength above 26000. Traders should focus on breakdown levels rather than reversal trades, as opening volatility after a gap-down can create sharp intraday movements favoring the downside.

[INTRADAY] #BANKNIFTY PE & CE Levels(10/12/2025)Bank Nifty is likely to open gap-down today, indicating continued weakness as the index remains stuck within a broader consolidation range. A gap-down start near the lower support zones may initially attract some buying interest, but overall sentiment remains cautious. If the market sustains below 58950, the bearish setup becomes active, and selling positions can perform well with downside targets of 58800, 58700, and 58600-. This zone has acted as support earlier, so a clean breakdown can accelerate selling momentum toward deeper levels.
On the upside, if the index recovers after the gap-down and stays strong above 59050–59100, the buying zone activates with targets of 59250, 59350, and 59450+. However, upside movement may remain limited unless Bank Nifty decisively crosses 59550, which opens a stronger bullish continuation toward 59750, 59850, and 59950+.
But with a gap-down expectation and weak global cues, the preferred intraday bias remains mildly bearish unless the market shows strong recovery signs in the first hour.
Overall, traders should watch 58950 closely — a breakdown will favor sellers, while a bounce above 59050–59100 could offer a quick pullback opportunity. The opening volatility will decide whether Bank Nifty stays in range or heads into a trending move.

ERIS - Bullish Momentum Revival💹 Eris Lifesciences Ltd (NSE: ERIS)
Sector: Pharmaceuticals | CMP: 1701.30 | View: Bullish Momentum Revival
Chart Pattern: Falling Wedge Pattern
Candlestick Pattern: Strong Bullish Momentum Candle
Swing High: 1910
Swing Low: 1506
Price Action
Eris Lifesciences has delivered a decisive shift in structure with a wide-range bullish candle emerging directly from the 1506–1530 demand zone. The move invalidates the recent weakness and successfully wipes out the liquidity sweep below prior lows. The strong candle, accompanied by a 52-week volume breakout, signals aggressive participation by stronger hands. Price has reclaimed the mid-Fibonacci levels and is now approaching the early breakout zone of the falling wedge structure, indicating a transition from compression toward directional expansion.
STWP Trade Analysis:
Bullish Breakout Level: 1740
Stop Loss: 1523
Momentum: Strong
Volume: Extremely High – Institutional Participation
Eris Lifesciences has delivered a powerful reversal from the 1506–1530 demand zone, triggering a breakout attempt supported by exceptional volume. The strong bullish candle reflects aggressive buying, reclaiming key mid-Fibonacci levels and rejecting the earlier liquidity sweep, which now appears to be a fake breakdown. Indicators across the board confirm strength — RSI breakout, MACD crossover, Bollinger Band expansion, and BB Squeeze-Off — all signalling the transition from compression to expansion. Buyers have clearly taken control and are defending higher lows with conviction.
VCP Analysis
The stock has displayed volatility contraction through a prolonged falling wedge, compressing steadily over multiple months. Each contraction phase has shown reduced amplitude, culminating in a sharp volume expansion today. This behaviour aligns with the early ignition stage of a VCP breakout. The surge in volume confirms that this is likely not a random upswing but a structural shift backed by institutional intent. Sustaining above 1708 keeps the VCP bias firmly intact.
STWP Support & Resistance
Supports:
• 1579 – Active demand zone, recently defended with strength
• 1457 – Medium-term structural support
• 1377 – Strong historical accumulation zone
Resistances:
• 1781 – First supply zone; momentum checkpoint
• 1861 – Upper mid-range rejection band
• 1983 – Major structural resistance; breakout gateway
These levels define the range in which the stock will oscillate before confirming its next directional leg.
STWP Stock Analysis:
Final Outlook:
Momentum: Strong | Trend: Neutral(Bullish Bias Developing) |
Risk: Moderate | Volume: Extremely High
Eris Lifesciences has staged a clean reversal after weeks of downward drift, with today’s candle marking a decisive shift in structure. The 52-week volume breakout confirms strong institutional activity, while the open=low candle and wide-range body highlight solid buyer dominance. Multiple technical triggers have aligned — RSI breakout, MACD bullish crossover, Bollinger Band breakout, BB Squeeze-Off, and a liquidity sweep below prior lows — collectively signalling the beginning of a fresh directional phase. The Fibonacci structure reinforces this momentum: price has reclaimed the 0.382 and 0.50 retracements, with room toward the 0.618 and 0.786 levels at 1755 and 1823. Sustaining above 1708 strengthens the upward outlook, opening the path toward higher resistances at 1781 → 1861 → 1983. The falling wedge breakout attempt, supported by the massive volume spike, indicates that the stock is transitioning from a prolonged compression into an early expansion cycle. As long as price holds above the layered demand zones at 1579 → 1457 → 1377, the bullish structure remains firmly intact. Traders should observe how the stock behaves on shallow dips toward 1660–1579. Healthy retests or tight pullbacks within this band often act as high-probability continuation setups in strong momentum environments.
⚠️ STWP Legal Disclaimer
This document is strictly for educational and informational purposes. All examples, charts, levels, and option structures discussed are illustrative and are not intended as buy, sell, or hold recommendations. STWP does not provide investment advice, trading tips, signals, or personalized financial guidance of any kind, nor is it a SEBI-registered intermediary or research analyst. The analyses, illustrations, and risk–reward structures included here are generic in nature and based on publicly available data and observed market behaviour, which may change without notice. Financial markets involve significant risk; derivatives in particular carry the potential for substantial losses. Option premiums, implied volatility, open interest, delta, and other market variables can fluctuate rapidly and unpredictably.
Readers are solely responsible for their trading decisions, capital management, and risk assessment. Before making any investment or trading decision, please consult a SEBI-registered investment advisor. STWP, its representatives, and affiliates shall not be liable for any direct or indirect loss arising from the use of this material. Historical patterns or past market behaviour do not guarantee future outcomes, nor should any part of this document be interpreted as a promise of performance, accuracy, or returns.
Position Status: No active position in this instrument at the time of analysis.
Data Source: TradingView & NSE India.
💬 Found this useful?
🔼 Boost this post to support structured learning
✍️ Share your thoughts or questions in the comments
🔁 Forward this to traders who value clean technical studies
👉 Follow for disciplined, structured, STWP-style analysis
🚀 Stay Calm. Stay Clean. Trade With Patience.
Trade Smart | Learn Zones | Be Self-Reliant 📊

WELENTWELENT is forming a bullish structure. After multiple rejections at resistance, it finally broke out, retested, and is turning bullish again.
There’s good volume and tight contraction near the SHS. If it sustains above 560, there’s a strong probability of an upside move.
Keep this stock on your watchlist.
✅ If you like my analysis, please follow me here as a token of appreciation :)
in.tradingview.com/u/SatpalS/
📌 For learning and educational purposes only, not a recommendation. Please consult your financial advisor before investing.

KAYNES - Oversold Demand-Zone Reversal Attempt💹 Kaynes Technology India Ltd (NSE: KAYNES)
Sector: Electronics Manufacturing | CMP: 4331 | View: Oversold Demand-Zone Reversal Attempt
Price Action
Kaynes witnessed a sharp vertical decline from the 7800 supply belt and has now landed directly on its major multi-month demand zone between 3710–3900. The latest session delivered a wide-range bullish reaction candle, signalling early evidence of absorption after a heavy liquidation phase. Price is currently stabilizing within a critical structure where further downside may ease if demand continues to hold.
VCP Analysis
The stock has moved from a wide high-volatility decline into the first compression point at the lower demand cluster. Although not a textbook VCP, the pattern resembles early-stage volatility contraction after a capitulation event. Buyers have shown intent inside the zone, and any narrowing of daily ranges around 4000–4300 may signal the beginning of a reclaiming structure.
STWP Trading Analysis
Momentum indicators show downward fatigue — RSI is deep oversold and beginning to curl, MACD histogram reflects slowing bearish force, and Stochastic is trying to reverse from lower bounds. Price behaviour suggests the initial capitulation may be complete, as the sudden spike in volume indicates potential strong-handed accumulation. The trend remains broadly negative, but the first signs of stabilization are visible. Sustaining above 3884 keeps the recovery sequence alive; losing it can re-open downside continuation.
Fibonacci Analysis
Using the swing high at 7822 and swing low at 3712:
0.236 Retracement: 4682
0.382 Retracement: 5282
0.5 Retracement: 5767
Kaynes currently trades below all key retracement levels. A clean push above 4606–4682 (Fib 0.236 region) is essential to unlock further retracements. These levels will act as layered resistance zones during the potential upside path.
STWP Support & Resistance
Strong Supports: 3884 (Primary demand support) | 3437 | 3161
Overhead Resistances: 4606 | 4882 | 5329
Price is positioned directly above major structural support with massive volume backing — a region where reversals traditionally form if sustained accumulation continues.
STWP Volume & Technical Setup
Volume hit an exceptionally high reading, reflecting a potential capitulation or institutional absorption event. Such spikes often mark the beginning stages of a base. The EMAs are widely stretched — a characteristic of trend exhaustion — and may gradually compress if price stabilizes. The volume–price behaviour hints at shift in market tone, where forced selling may have met deep-pocket buyers at the demand floor.
⚠️ STWP Legal Disclaimer
This document is strictly for educational and informational purposes. All examples, charts, levels, and option structures discussed are illustrative and are not intended as buy, sell, or hold recommendations. STWP does not provide investment advice, trading tips, signals, or personalized financial guidance of any kind, nor is it a SEBI-registered intermediary or research analyst. The analyses, illustrations, and risk–reward structures included here are generic in nature and based on publicly available data and observed market behaviour, which may change without notice. Financial markets involve significant risk; derivatives in particular carry the potential for substantial losses. Option premiums, implied volatility, open interest, delta, and other market variables can fluctuate rapidly and unpredictably.
Readers are solely responsible for their trading decisions, capital management, and risk assessment. Before making any investment or trading decision, please consult a SEBI-registered investment advisor. STWP, its representatives, and affiliates shall not be liable for any direct or indirect loss arising from the use of this material. Historical patterns or past market behaviour do not guarantee future outcomes, nor should any part of this document be interpreted as a promise of performance, accuracy, or returns.
Position Status: No active position in this instrument at the time of analysis.
Data Source: TradingView & NSE India.
💬 Found this useful?
🔼 Boost this post to support structured learning
✍️ Share your thoughts or questions in the comments
🔁 Forward this to traders who value clean technical studies
👉 Follow for disciplined, structured, STWP-style analysis
🚀 Stay Calm. Stay Clean. Trade With Patience.
Trade Smart | Learn Zones | Be Self-Reliant 📊

Will GOLD Hold the Key Suppor? Watching for a Push Toward 4195Gold continues to trade within a tight intraday range. The 4180–4175 area is acting as a solid support zone, with buyers consistently stepping in on dips. On the upper side, supply remains active around 4200–4196, keeping price capped for now.
As long as Gold holds above the 4175–4180 support region, there is a reasonable probability of another attempt toward the 4195 level. A clean push above 4196 could open the door for buyers to retest 4200 and potentially higher. However, a breakdown below 4175 would invalidate this short-term bullish bias.
📌 Key Levels
Support: 4180–4175
Resistance / Supply: 4196–4200
Upside Target: 4195+
📈 Bias: Mildly bullish above 4175; neutral-to-bearish if broken.
⛔ Disclaimer: This is not financial advice. Always manage risk and trade based on your own analysis.
Your feedback drives our content and keeps everyone trading smarter. Let’s make those pips together! 🚀
Happy Trading,
– The InvestPro Team
