ETH/BTC Just Flipped Its Macro Structure: Is The $ETH Rally NextETH/BTC Just Flipped Its Macro Structure: Is The CRYPTOCAP:ETH Rally Next?
ETH/BTC Has Finally Broken Its Multi-Month Downtrend, Printing A Higher High And Signaling A Potential Shift From Bearish To Bullish Market Structure.
🔹 Breakout: 0.03205
🔹 Retest Zone: 0.0270–0.0260
🔹 Key Support: Above Previous Lower Low
The Critical Move Now Is The Retest.
If ETHBTC Holds 0.0270–0.0260, Forms A Higher Low And Defends The Rising Trendline,
The Next Expansion Could Target: 0.040 | 0.0500 | 0.060–0.0
Technicaltrader
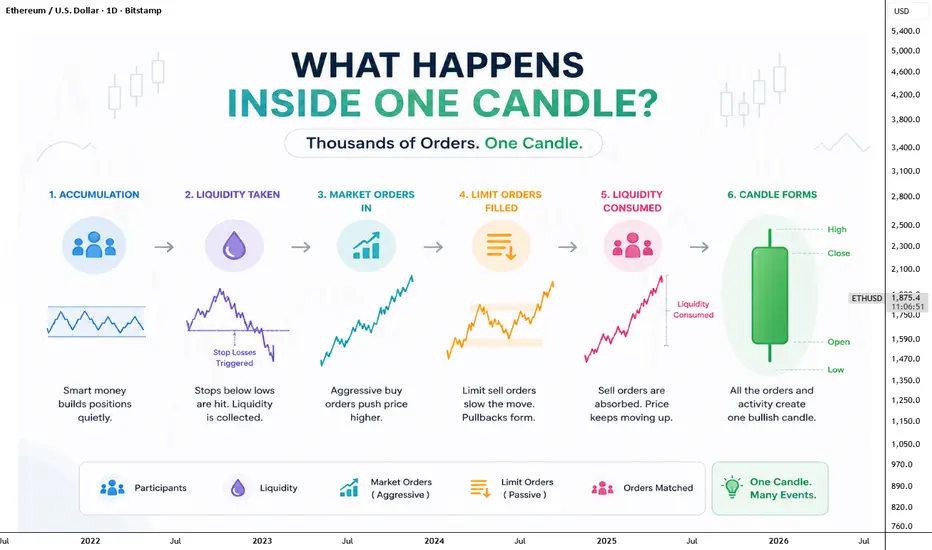
What Really Happens Inside One Candle?When traders look at a chart, they usually see a green or red candle and immediately decide whether buyers or sellers were stronger. But a single candle is much more than a colored bar on the screen. It is the final result of thousands of buy and sell orders, stop losses, limit orders, and market orders interacting with each other within a short period of time. Every candle tells a story that most traders never see.
A bullish candle, for example, does not simply mean buyers entered the market.
ETHUSD | Daily Bullish Continuation SetupEthereum is respecting a well-defined ascending trendline, showing strong buyer control on the daily timeframe. As long as price remains above the trendline, the bullish structure stays intact.
📊 Trade Setup
Entry: ~1,920
Stop Loss: 1,838
Target 1: 2,140
Final Target: 2,355
🔍 Technical Confluence
✅ Higher highs & higher lows
✅ Trendline support holding strong
✅ Healthy pullback after impulsive move
✅ Favorable Risk-to-Reward (1:5+)
📌 Trade Plan
Buy only while the daily trendline remains valid
Ethereum Next Move Will Decide Everything: $10K Rally or $1K ?Ethereum Next Move Will Decide Everything: $10K Rally or $1K Crash?
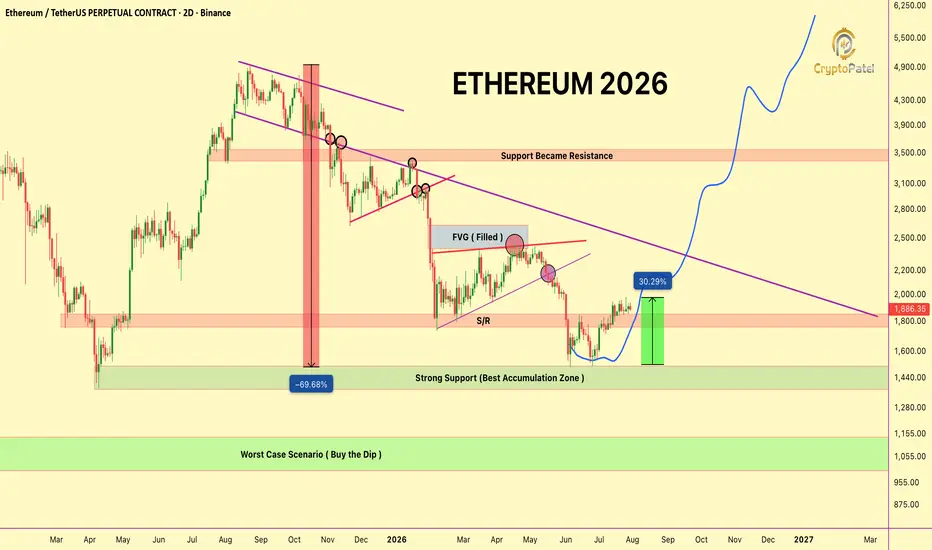
CRYPTOCAP:ETH is currently trading around $1,900, delivering a strong recovery from the $1,500 accumulation zone that I highlighted earlier. The $1,500–$1,600 accumulation range has now produced approximately 30% upside, exactly as anticipated. I hope many of you were able to capitalize on the setup.
Now the focus shifts to the next major high-timeframe hurdle.
The $2,400–$2,500 region remains the most critical resistance o
ETH/BTC Is Inches Away From Breaking A 5-Year Resistance.ETH/BTC Is Inches Away From Breaking A 5-Year Resistance.
This could become one of the biggest technical breakouts of the cycle.
Why does it matter?
Historically, major Altseasons begin when CRYPTOCAP:ETH starts outperforming BTC. A confirmed breakout on the ETH/BTC chart could trigger a massive rotation of capital into altcoins.
Current Setup:
👉 5-Year Resistance: Almost Broken
👉 Accumulation Zone: 0.028–0.021 BTC
👉 Target: 0.075 BTC (≈170% from 0.028 BTC, ≈257% from 0.021 BTC)
👉 Stop Loss
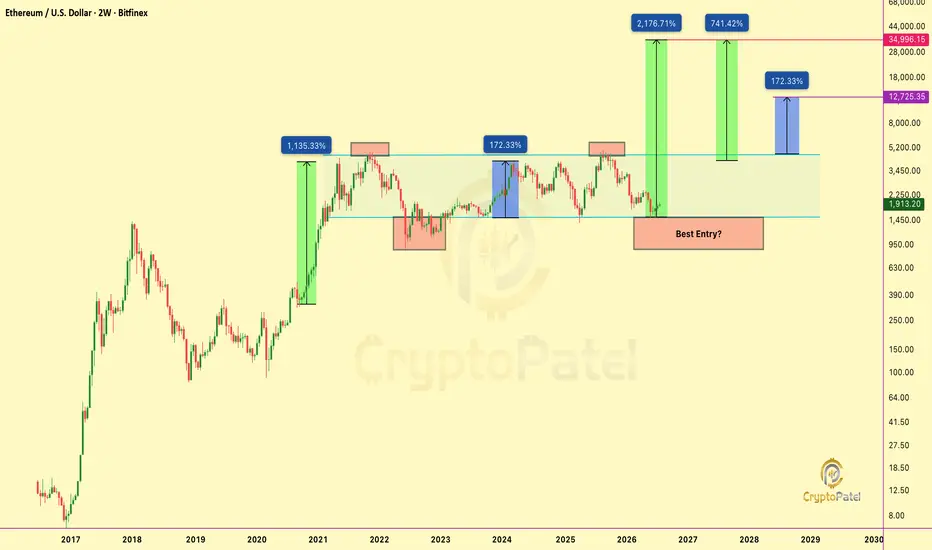
This 6-Year Ethereum Pattern Could Decide Next Crypto SupercycleThis 6-Year Ethereum Pattern Could Decide The Next Crypto Supercycle
CRYPTOCAP:ETH Is Trading Inside A 6-Year Cycle Range While Sitting At The Bottom Of A Massive HTF Bull Flag Channel.
This Is Where Long-Term Wealth Is Built, Not Where Retail Chases Pumps.
If This Structure Breaks Out, The Next Major Target Is Around $12K, While The Full HTF Bull Flag Projects As High As $35K In The Long Run.
Best Accumulation Zone: $1,500–$1,000.
Targets: $7K | $10K | $15K | $25K | $35K
Now I Understand
This ETH/BTC Chart Will Decide the Next Altseason: Here's My ComThis ETH/BTC Chart Will Decide the Next Altseason: Here's My Complete Roadmap
After months of tracking this chart, I believe ETH/BTC has finally confirmed a major HTF trend reversal.
This isn't just another bullish tweet. Here's why this matters.
1️⃣ The first bullish confirmation came when ETH/BTC defended the 0.618 Fibonacci retracement and produced a strong HTF reaction.
That confirmed buyers were protecting one of the most important support levels of the entire cycle.
2️⃣ The second conf
ETHUSD | 1H | Trendline Retest Buy SetupBias: Bullish 📈
ETH has pulled back into a confluence support zone, where multiple technical factors align:
✅ Rising trendline support
✅ Previous horizontal demand zone
✅ Strong bullish market structure remains intact
The recent rejection from support suggests buyers are defending this level. As long as price holds above the marked support, I expect continuation toward the next resistance.
📊 Trade Setup
Entry: 1898.86
Stop Loss: 1881.91
Target: 1943.57
Risk : Reward: ~1 : 2.6
🔍 Trade Idea
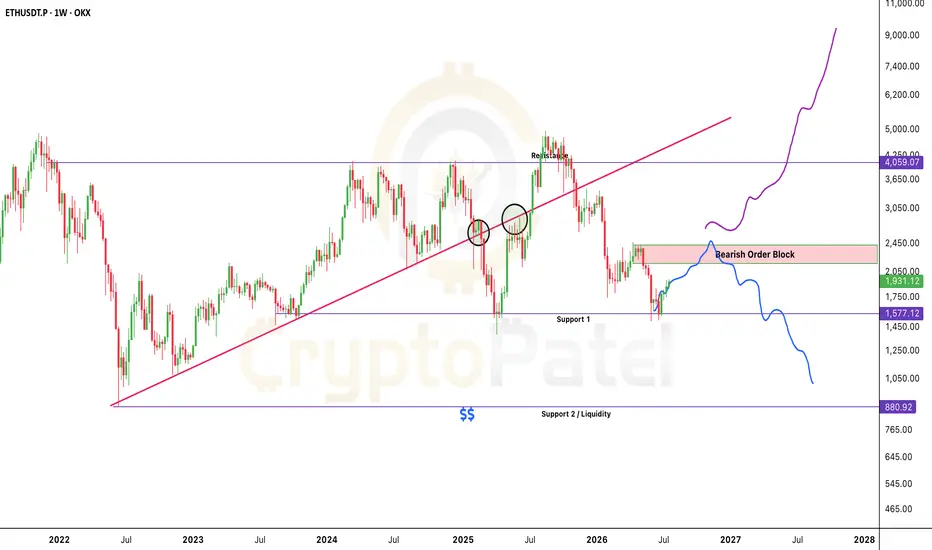
Ethereum $10K Or $1K? This Zone Will Decide Everything.Ethereum $10K Or $1K? This Zone Will Decide Everything.
My technical outlook on CRYPTOCAP:ETH :
Ethereum is likely to extend its recovery toward the $2,160–$2,400 region. This is a major HTF Bearish Order Block + Fair Value Gap (FVG), making it the most important resistance zone on the chart.
Bullish scenario:
A confirmed HTF close above $2,400 would invalidate the current bearish structure and shift the HTF trend bullish, opening the door toward $7K–$10K.
Bearish scenario:
If ETH gets rejec
ETH/BTC Will Decide When Altseason Starts: Must Read for AltsznETH/BTC Will Decide When Altseason Starts, And The Chart Just Made Its Move
Most traders are focused on BTC/USD and ETH/USD.
Very few are watching the chart that has historically signaled when Ethereum is ready to outperform Bitcoin.
Here's What Stands Out:
🔹 Another ~80% macro correction: Nearly identical to previous cycles.
🔹 Price is holding the historical Accumulation zone.
🔹 Strong reaction from 0.618–0.786 FIB Golden Pocket.
🔹 Higher lows are beginning to form, suggesting accumulation ra
Ethereum Is At A Decision Point: The Next Move Could ?Ethereum Is At A Decision Point: The Next Move Could Define The Trend For Weeks.
CRYPTOCAP:ETH Is Rebounding From The Recent Low, But The Bigger Picture Hasn't Changed.
Price Is Now Approaching A Major Daily Bearish Order Block + Fair Value Gap Around $1,900–$2,000, A Zone Where Sellers Could Step Back In.
My View:
🔹 Bullish Above $2,150(Major HTF Breakout)
🔹 Bearish Below $2,050 Until Proven Otherwise
🔹 Lose $1,730, And A Retest Of $1,500 Becomes Increasingly Likely
This Looks Like A Reli
ETHUSD Weakens Below $1,600 as Sellers Stay ActiveEthereum has lost the key $1,600 area, and the latest price action still favours sellers. The market is sliding lower after every weak recovery, which suggests buyers are not strong enough yet to reverse the trend.
Crypto sentiment also remains under pressure due to tech-sector weakness, large liquidations, and a stronger US Dollar driven by hawkish Fed expectations.
Trade Setup:
Sell Zone: $1,590 – $1,620
Stop Loss: $1,665
Take Profit 1: $1,500
Take Profit 2: $1,450
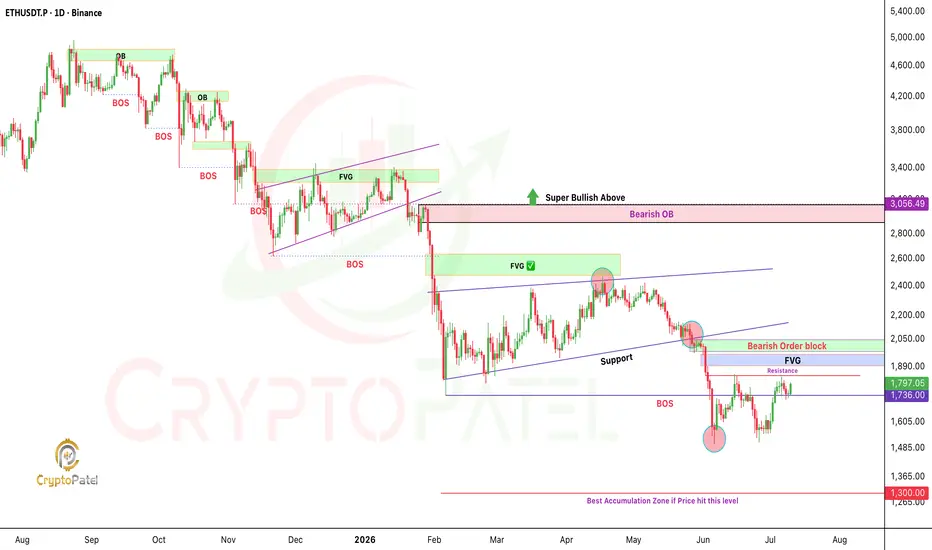
Ethereum Breakdown Risk: $1,300–$1,400 Flush Zone Still in PlayThe crypto market sell-off accelerated last week, and Ethereum is now showing clear relative weakness compared to Bitcoin.
What stands out is that ETH broke to a new low late in the week, while BTC did not.
That divergence could trigger a short-term pause in the decline, but for now, the broader structure still looks bearish rather than bullish.
The major warning sign came in May, when Ethereum failed to make a new high while Bitcoin did. That was an early sign of weakness.
Now, ETH appears
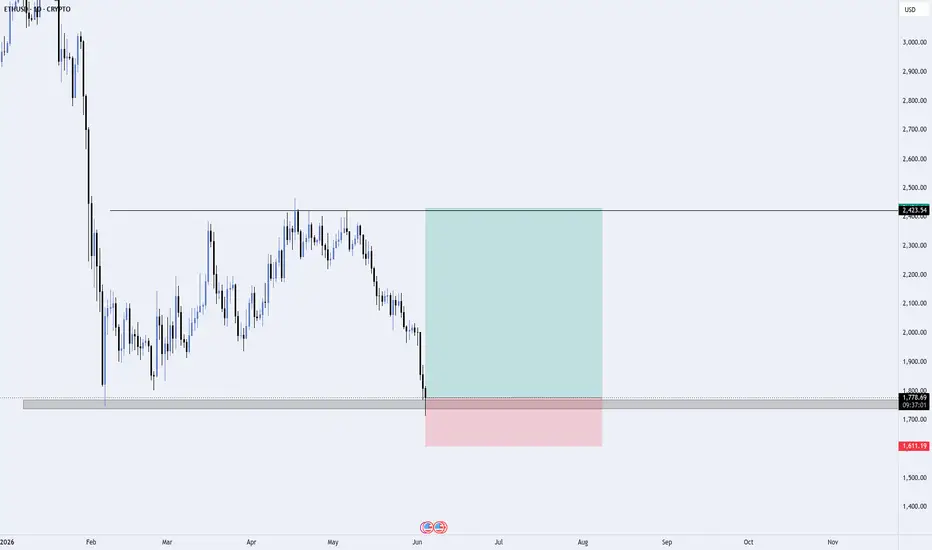
ETHUSD Long SetupWatching ETH at a major daily support zone around $1,780. Price has returned to a key demand area that previously attracted strong buying pressure.
Entry: $1,780
Stop Loss: $1,611
Target: $2,423
Risk-to-Reward: 1:3.8
The idea is based on support holding and a potential mean-reversion move back toward the previous resistance range. I will look for bullish confirmation before adding full size.
Trade your plan, manage your risk.
This is my personal analysis, not financial advice.
ETHUSD SHOWING A GOOD DOWN MOVE WITH 1:10 RISK REWARD ETHUSD SHOWING A GOOD DOWN MOVE WITH 1:10 RISK REWARD
DUE TO THESE REASON
A. its following a rectangle pattern that stocked the market
which preventing the market to move any one direction now it trying to break the strong resistant lable
B. after the break of this rectangle it will boost the market potential for break
C. also its resisting from a strong neckline the neckline also got weaker hald the price is ready to break in the outer region
all of these reason are indicating the same thing
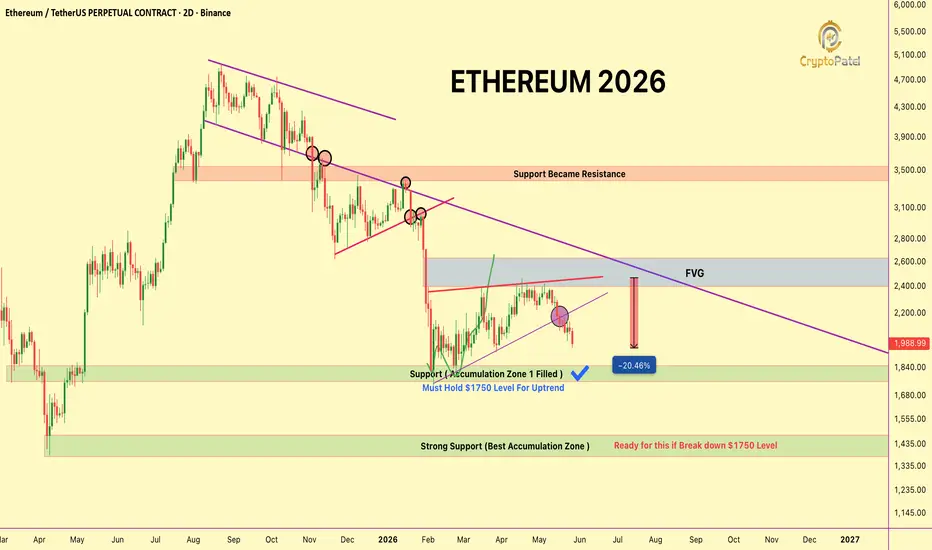
$ETH Down 20% From My FVG Level - Here My Next PlanCRYPTOCAP:ETH Down 20% From My FVG Level. Here Is Exactly Where I Am Buying For $10K-$15K Target
ETH/USDT Playing Out Exactly As Called
ETH rejected clean off the FVG at the $2400-$2600 zone, just like I mapped out. Price is now down nearly 20% from that level and sitting back below $2000.
Structure stays bearish until we reclaim $3050. No reason to fight that.
Here Is My Game Plan From Here:
Price needs to hold $1750 to keep the bullish long term case alive. My first entry is already fille
ETH Reclaims Key Structure ,Trend shifting from bearish to bulli
ETHUSD reacted strongly from the key demand zone after sweeping liquidity below support, showing clear buyer strength entering the market. Price reclaimed the short-term structure and is now holding above the 2090–2100 support area, indicating a possible shift from bearish momentum to bullish continuation.
The recent bullish impulse suggests sellers are losing control while buyers attempt to build higher lows. If price breaks and sustains above the 2115–2140 resistance region, bullish continua
Ethereum Price Structure Analysis [21/05/2026: Thursday]Probable Scenario Analysis for the 21st of May 2026. The day is Thursday.
(1) Bullish Scenario:
Firstly, the price needs to give a breakout above the level of 2150. If the price sustains above the level 2150, then the probable bullish targets would be - 2175, 2200, 2225, and 2250. Keep an eye on the level 2150.
(2) Bearish Scenario:
Ethereum is not set up to short unless it starts to trade below the level of 2100. Level 2100 is a strong support. It looks like Ethereum bulls are defendin
ETH/USD - Liquidity Sweep Into DemandEthereum is currently showing a Bearish Market Structure on the 30-minute timeframe after a decisive Break of Structure (BOS) below $2,228. However, price has now entered a major Demand Zone ($2,210 – $2,230) where it is currently hunting for liquidity.
The Bear Case: Price remains below the BOS line and the 200-EMA, keeping the primary trend downward. Heavy institutional selling and recent ETF outflows support this bearish pressure.
The Bull Case (Liquidity Sweep): The price is currently "swe
ETH/USD Bearish Continuation Idea | Descending Channel Rejection📌 Overview
ETH is currently trading inside a well-defined descending channel on the 1H timeframe, showing signs of weakness after rejecting from the upper trendline resistance.
Price failed to sustain bullish momentum and is now reacting from a key dynamic resistance area, suggesting a possible continuation toward lower levels.
This setup is based on a bearish continuation scenario within the existing downtrend structure.
📍 Analysis
🔹 Descending Channel Structure
ETH continues to respect t
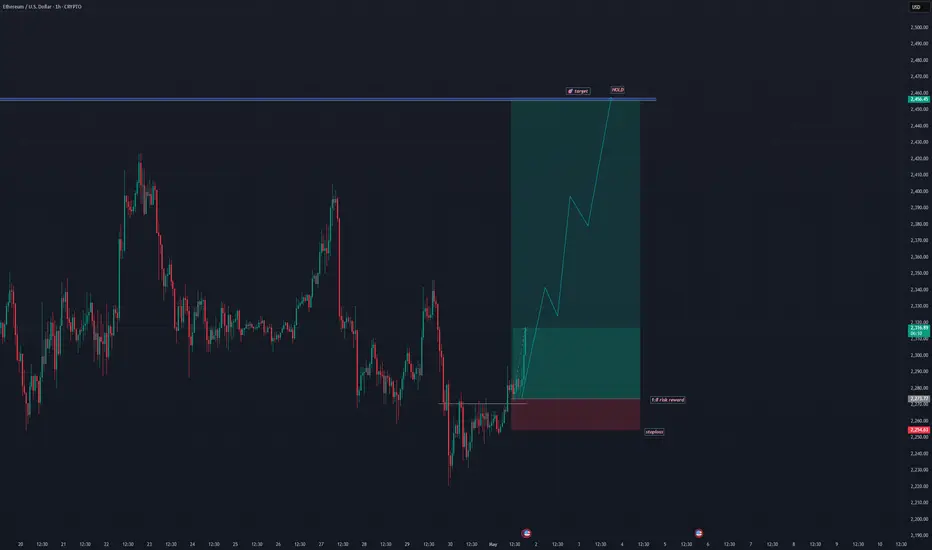
ETH Pullback Could Be Setting Up Bullish ContinuationEthereum is undergoing a short-term correction after falling from around 2,407 USD to near 2,279 USD in just a few sessions. The heavy volume during the decline suggests the market may be clearing liquidity before the next major move.
Despite short-term weakness, ETH has not invalidated its medium-term uptrend yet. The most important support remains around 2,260–2,240 USD.
Holding this zone could allow Ethereum to recover toward 2,340 USD and later 2,400 USD+. However, a strong breakdown below
ETH/USD: Massive Accumulation or One Last Shakeout?Market Outlook:
Ethereum is currently stuck in a tight consolidation range on the Daily timeframe, trading around $2,327. After the aggressive sell-off in early February, the price has been printing higher lows, indicating that bulls are slowly stepping back into the market. We are approaching a "Make or Break" zone.
Technical Analysis (Daily TF):
The Accumulation Zone: Since March, ETH has been building a solid base between $2,100 - $2,200. This area is acting as a massive demand cluster w
ETHUSD - Bulls Loading Up Just Below BreakoutETH on the 4H chart is forming a cup and handle pattern. The rounded bottom came after the drop into the 1,937 area, and from there, the Crypto has been slowly climbing back up. That kind of recovery usually shows steady buying rather than a quick bounce. Now, ETH is pulling back slightly, which is the handle part. This pullback looks controlled, not aggressive, so it feels more like a pause than any real weakness.
At the moment, price is just moving in a tight range and drifting a bit lower.
ETHUSD SHOWING A GOOD UP MOVE WITH 1:8 RISK REWARD ETHUSD SHOWING A GOOD
UP MOVE WITH 1:8 RISK REWARD
DUE TO THESE REASON
A. its following a rectangle pattern that stocked the market
which preventing the market to move any one direction now it trying to break the strong resistant lable
B. after the break of this rectangle it will boost the market potential for break
C. also its resisting from a strong neckline the neckline also got weaker hald the price is ready to break in the outer region
all of these reason are indicating the same thing it