Diffusion Engineers cmp 357.70 by Daily Chart view since listedDiffusion Engineers cmp 357.70 by Daily Chart view since listed
- Support Zone 325 to 345 Price Band
- Resistance Zone 365 to 385 Price Band
- Volumes are seen spiking above the average traded quantity
- Price trending and respecting the rising Rising Support Trendline
- Dotted Falling Resistance Trendline Breakout seems been attempted
- Multiple Bullish Rounding Bottoms rejected at Resistance Zone neckline
- Price reversed multiple times and backed out by strong Resistance Zone since listed
- Breakout above Falling Resistance Trendline from ATH level seems well sustained for now
- Price Breakout only possible by continued Volumes increase and few days closure above Resistance Zone
Technicaltrendanalysis

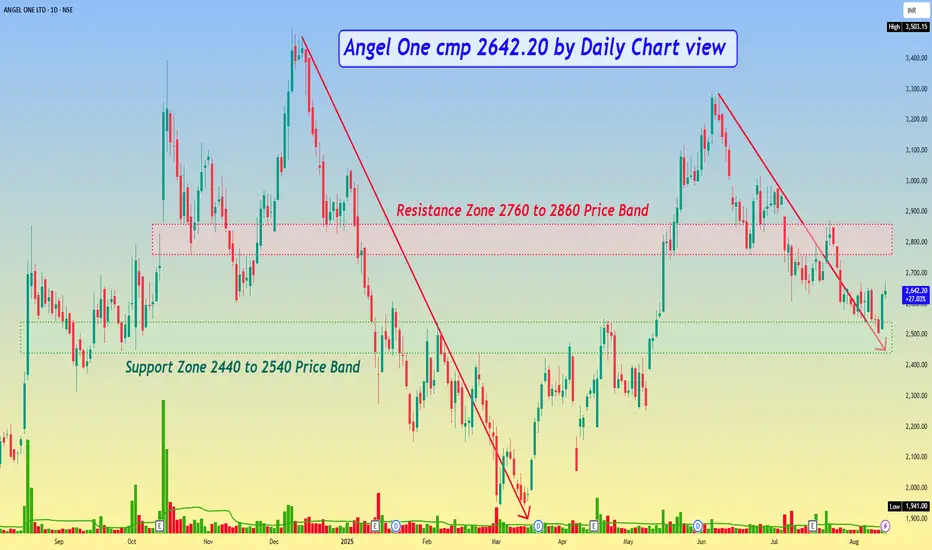
Angel One cmp 2642.20 by Daily Chart viewAngel One cmp 2642.20 by Daily Chart view
- Support Zone 2440 to 2540 Price Band
- Resistance Zone 2760 to 2860 Price Band
- Falling Resistance Trendline Breakout seems sustained
- Price reversal has taken upwards momentum post quick test retest of the Support Zone
- [ b]Will history repeat itself but from an early stage basis last Breakout from Falling Resistance Trendline
- Hoping for a breakout above Resistance Zone unlike breakdown, that occurred recently in last week of July 2025
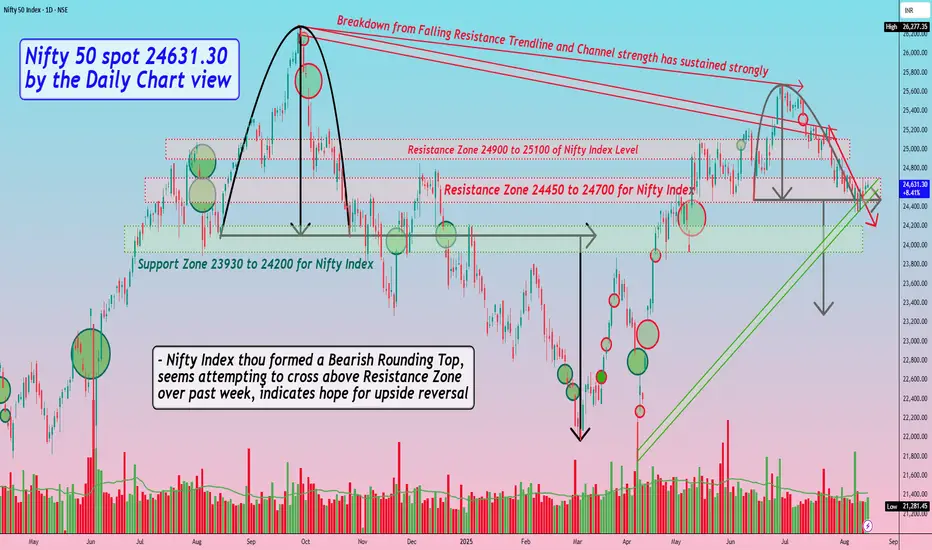
Nifty 50 spot 24631.30 by Daily Chart view - Weekly updateNifty 50 spot 24631.30 by Daily Chart view - Weekly update
- Support Zone 23930 to 24200 for Nifty Index
- Resistance Zone 24450 to 24700 for Nifty Index
- Breakout from above one of the Tiny Falling Resistance Trendline seems well sustained
- Rising Support Channel seems back in supportive role and maintained by current status of Nifty Chart setup
- Nifty Index thou formed a Bearish Rounding Top, seems attempting to cross above Resistance Zone over past week, indicates hope for upside reversal
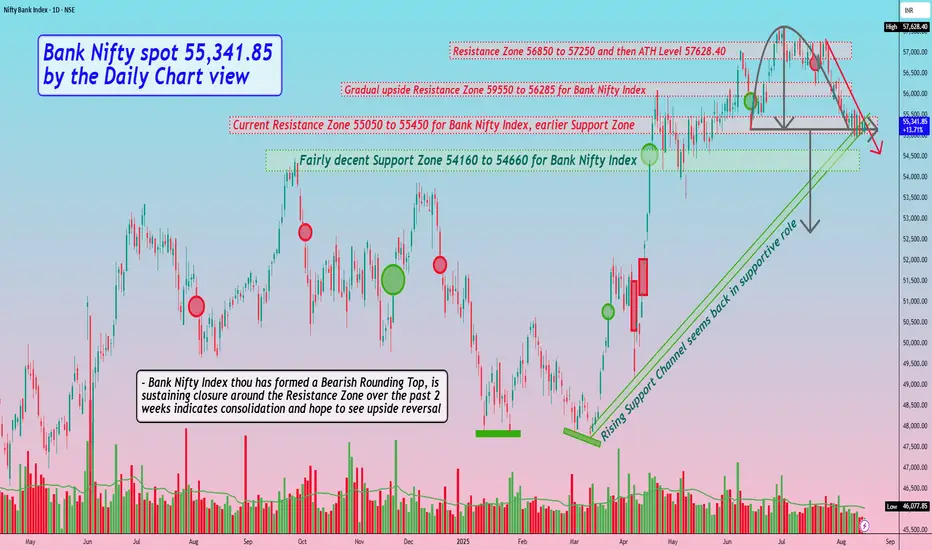
Bank Nifty spot 55,341.85 by the Daily Chart view - Weekly updatBank Nifty spot 55,341.85 by the Daily Chart view - Weekly update
- Fairly decent Support Zone 54160 to 54660 for Bank Nifty Index
- Current Resistance Zone 55050 to 55450 for Bank Nifty Index, earlier Support Zone
- Falling Resistance Trendline is yet a hurdle to cross over along with the current Resistance Zone
- Rising Support Channel seems back in supportive role and gives indicative feeling of probable upside reversal, so hope for the best to happen
- Bank Nifty Index thou has formed a Bearish Rounding Top, is sustaining closure around the Resistance Zone over the past 2 weeks indicates consolidation and hope to see upside reversal
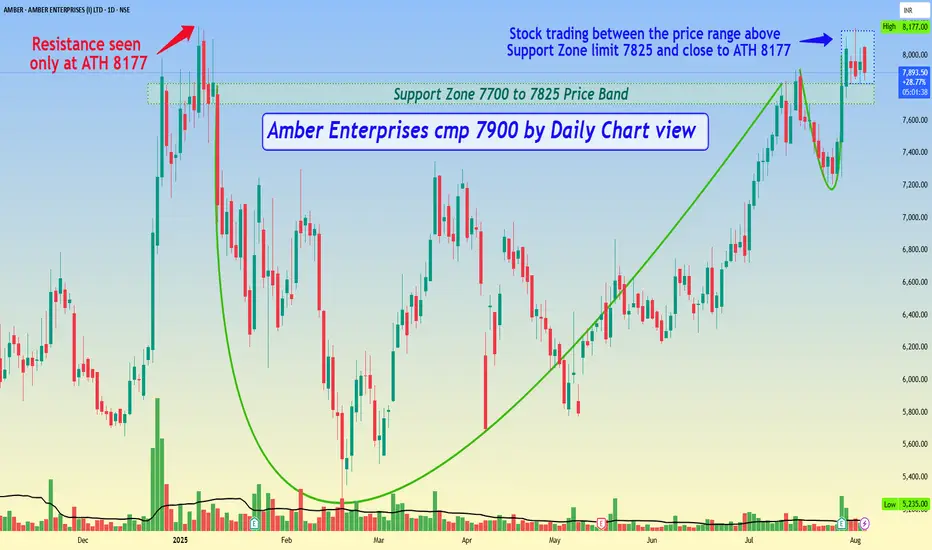
Amber Enterprises cmp 7900 by Daily Chart viewAmber Enterprises cmp 7900 by Daily Chart view
- Support Zone 7700 to 7825 Price Band
- Resistance seen only at the ATH 8177 level
- Volumes syncing closely and at times well above average traded quantity over past few days
- Stock is trading between the price range from above Support Zone limit 7825 and close to ATH 8177
- Bullish Rounding is made over close to 7 mths timeframe, indicative of huge upside breakout probability
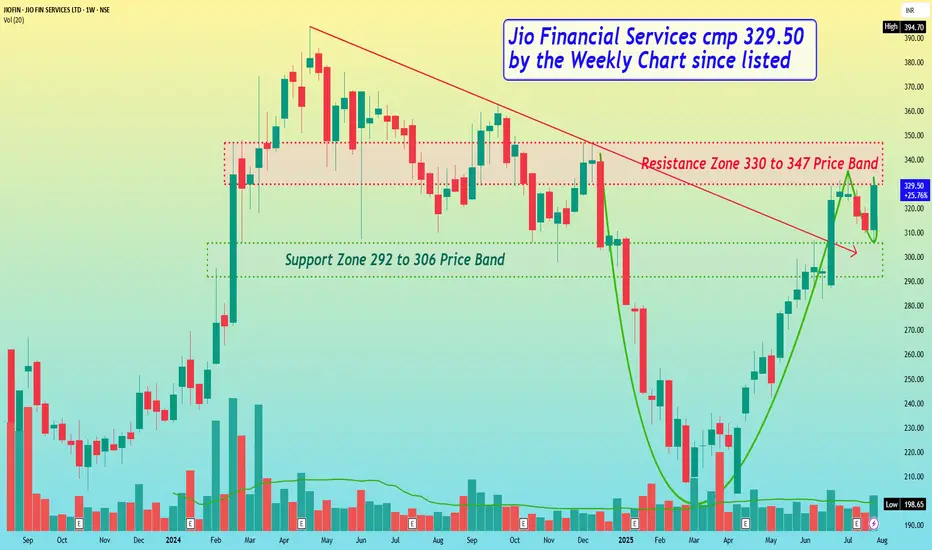
Jio Financial Services cmp 329.50 by the Weekly Chart since listJio Financial Services cmp 329.50 by the Weekly Chart since listed
* Support Zone 292 to 306 Price Band
* Resistance Zone 330 to 347 Price Band
* Price Breakout from Falling Resistance Trendline
* Volumes getting in sync with average traded quantity
* Bullish Cup and Handle done with Resistance Zone neckline
Skipper cmp 516.25 by Daily Chart viewSkipper cmp 516.25 by Daily Chart view
- Support Zone 480 to 507 Price band
- Resistance Zone 545 to 570 Price Band
- Bullish Cup and Handle done with Resistance Zone neckline
- Price Breakout above Falling Resistance Trendline needs to sustain
- Tremendously Huge Volumes traded on Friday by demand based buying

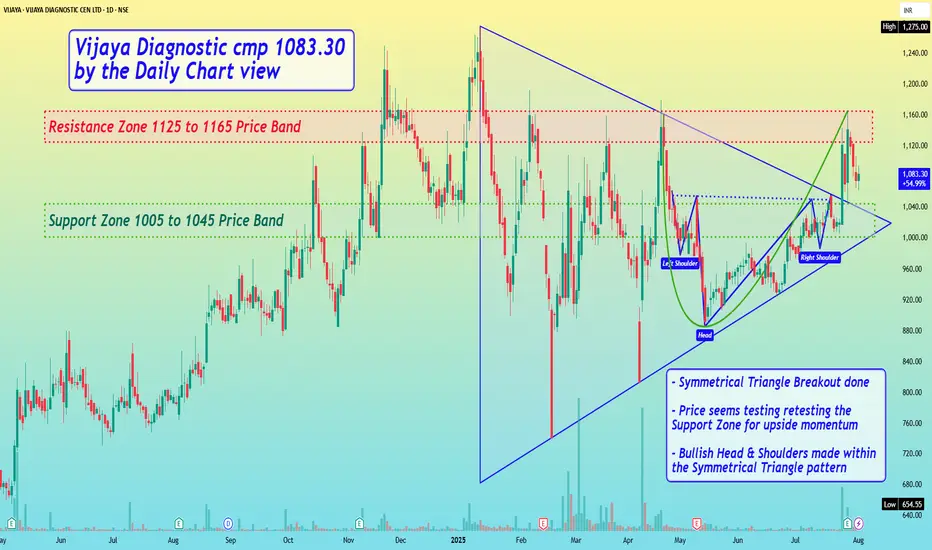
Vijaya Diagnostic cmp 1083.30 by the Daily Chart viewVijaya Diagnostic cmp 1083.30 by the Daily Chart view
- Support Zone 1005 to 1045 Price Band
- Resistance Zone 1125 to 1165 Price Band
- Symmetrical Triangle Breakout done
- Price seems testing retesting the Support Zone for upside momentum
- Bullish Head & Shoulders made within the Symmetrical Triangle pattern
- Bullish Rounding Bottom done over Head & Shoulders and again within Symmetrical Triangle pattern
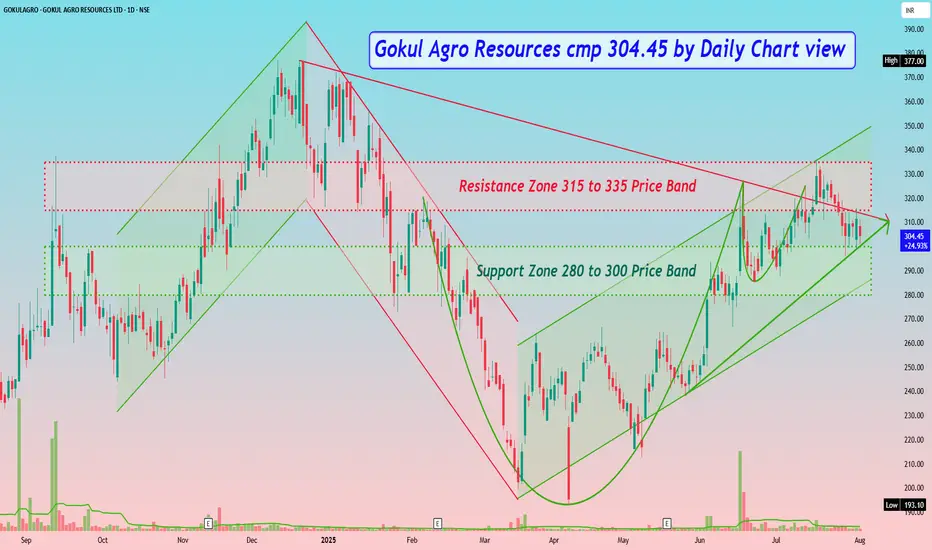
Gokul Agro Resources cmp 304.45 by Daily Chart viewGokul Agro Resources cmp 304.45 by Daily Chart view
- Support Zone 280 to 300 Price Band
- Resistance Zone 315 to 335 Price Band
- Falling Resistance Trendline hurdle need be crossed for breakout
- Rising Support Trendline seems well respected by current momentum
- Price traversing inside the Rising Support Channel is indicating bullishness
- Chart has formed Bullish Cup & Handle pattern by the Resistance Zone neckline
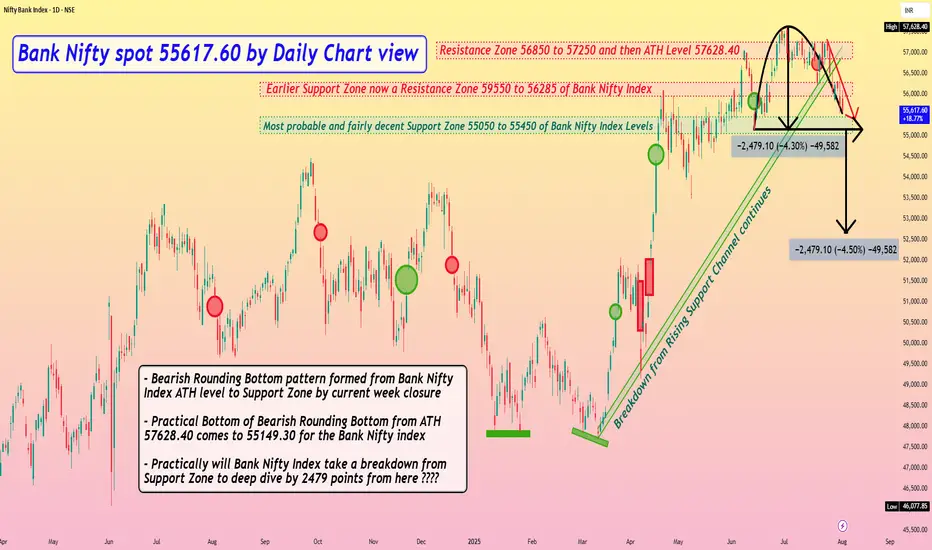
Bank Nifty spot 55617.60 by Daily Chart view - Weekly updateBank Nifty spot 55617.60 by Daily Chart view - Weekly update
- Resistance Zone 56850 to 57250 and then ATH Level 57628.40
- Earlier Support Zone now a Resistance Zone 59550 to 56285 of Bank Nifty Index
- Most probable and fairly decent Support Zone 55050 to 55450 of Bank Nifty Index Levels
- Bearish Rounding Bottom pattern formed from Bank Nifty Index ATH level to Support Zone by current week closure
- Practical Bottom for the Bearish Rounding Bottom from the ATH 57628.40 comes to 55149.30 for the Bank Nifty index
- Practically will the Bank Nifty Index take a breakdown from the Support Zone to deep dive below by 2479 points from here ????
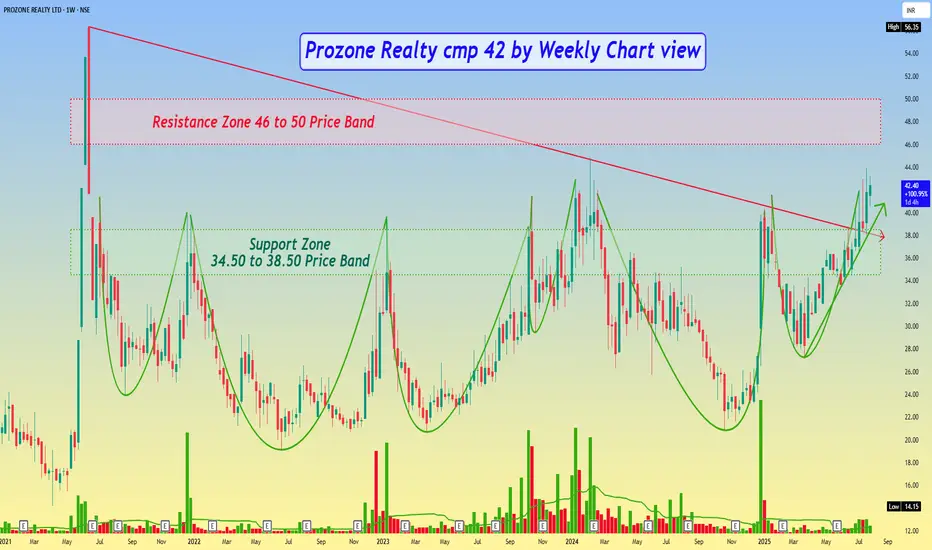
Prozone Realty cmp 42 by Weekly Chart viewProzone Realty cmp 42 by Weekly Chart view
- Support Zone 34.50 to 38.50 Price Band
- Resistance Zone seen at 46 to 50 Price Band
- Falling Resistance Trendline Breakout has well sustained
- Support Zone got tested retested over the past few weeks
- Multiple Bullish Rounding Bottoms made around Support Zone
- Volumes are well above average traded quantity over past few weeks
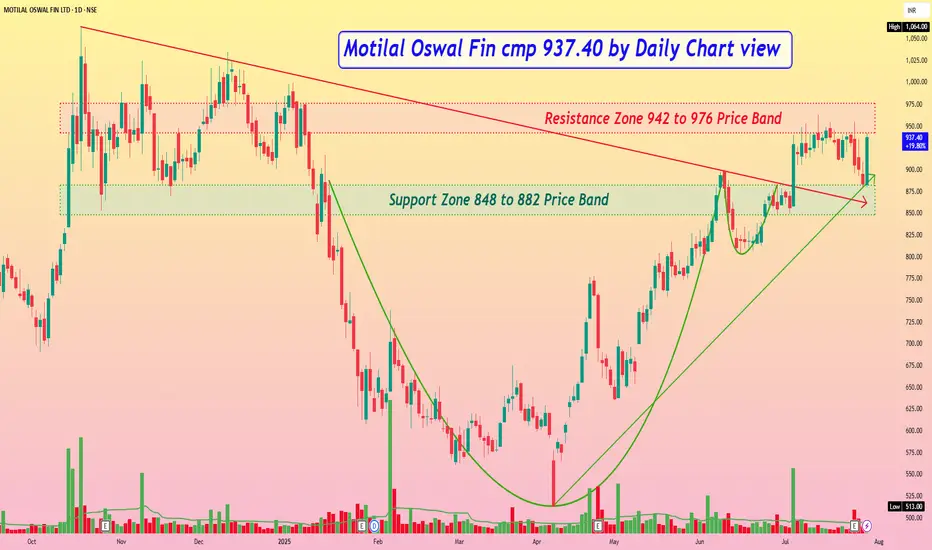
Motilal Oswal Fin cmp 937.40 by Daily Chart viewMotilal Oswal Fin cmp 937.40 by Daily Chart view
- Support Zone 848 to 882 Price Band
- Resistance Zone 942 to 976 Price Band
- Bullish Cup and Handle completed at Support Zone neckline
- Support Zone seen to be tested retested over the past 2 days
- Falling Resistance Trendline Breakout done a while back and sustained
- Selling pressure is seen around the Resistance Zone hurdle acting strongly
- Resistance Zone Breakout necessary for fresh upside as Price retraced multiple times
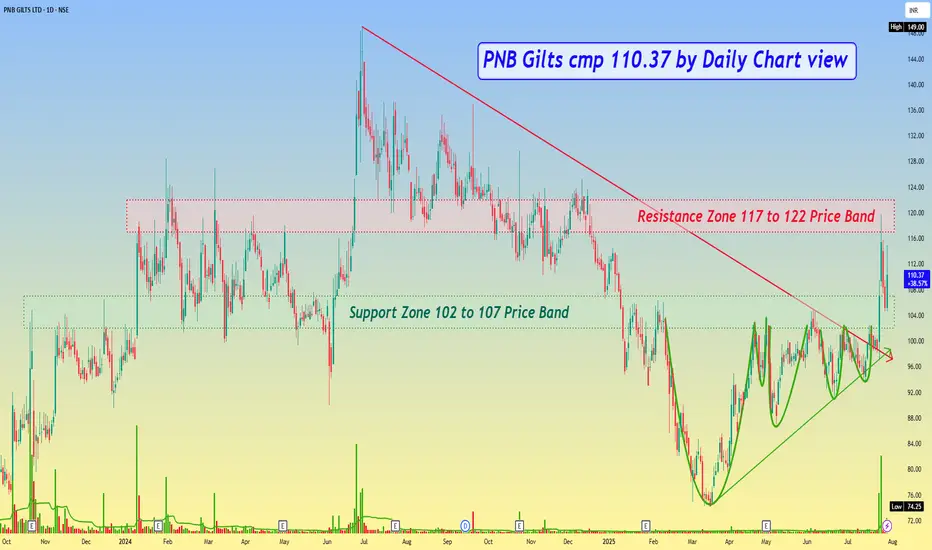
PNB Gilts cmp 110.37 by Daily Chart viewPNB Gilts cmp 110.37 by Daily Chart view
- Support Zone 102 to 107 Price Band
- Resistance Zone 117 to 122 Price Band
- Volumes are seen spiking heavily over past few days
- Support Zone is getting tested retested since last week
- Bullish Technical Chart indicates decent breakout probability
- Falling Resistance Trendline Breakout is seen to be well sustained
- Very closely considerate VCP pattern has formed below the Support Zone
- Majority Technical Indicators BB, EMA, SAR, MACD, RSI, SuperTrend trending positively
Godfrey Philips cmp 8942.50 by Daily Chart viewGodfrey Philips cmp 8942.50 by Daily Chart view
- Support Zone 8450 to 8650 Price Band
- Resistance Zone 9150 to 9400 Price Band
- Rising Support Trendline has been well sustained
- Price reversing basis Support Zone test retest over past 3 days
- Volumes attempting sync with avg traded qty thou the profit booking
- Technical Indicators BB, EMA, SAR, MACD, RSI, SuperTrend turning positive

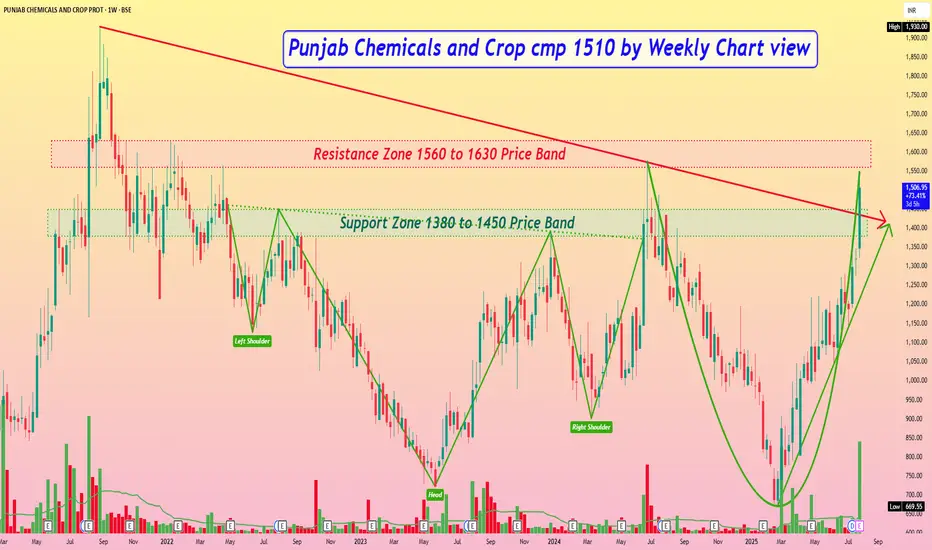
Punjab Chemicals and Crop cmp 1510 by Weekly Chart viewPunjab Chemicals and Crop cmp 1510 by Weekly Chart view
- Support Zone 1380 to 1450 Price Band
- Resistance Zone 1560 to 1630 Price Band
- Volumes spiked heavily today by demand based buying
- Bullish Head & Shoulders followed by Bullish Rounding Bottom patterns
- Resistance Zone neckline hurdle crossing needed for fresh upside breakout momentum
- Falling Resistance Trendline Broken and Rising Support Trendline sustained indicates good bullishness
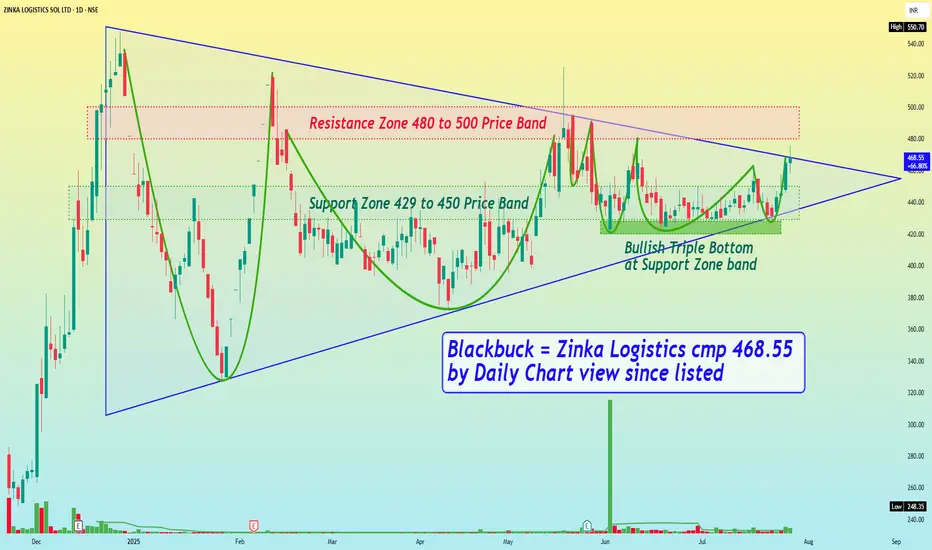
Blackbuck = Zinka Logistics cmp 468.55 by Daily Chart view sinceBlackbuck = Zinka Logistics cmp 468.55 by Daily Chart view since listed
- Support Zone 429 to 450 Price Band
- Resistance Zone 480 to 500 Price Band
- Symmetrical Triangle Breakout been attempted
- Closely considerate VCP pattern formation seems done
- Volumes are in close sync with the average traded quantity
- Technical Indicators BB, EMA, MACD, RSI, SAR showing positive trend
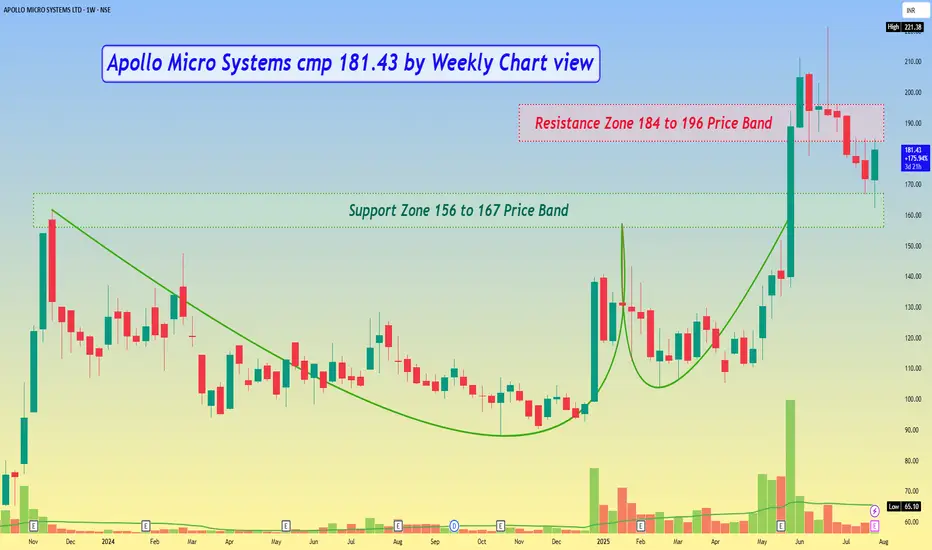
Apollo Micro Systems cmp 181.43 by Weekly Chart viewApollo Micro Systems cmp 181.43 by Weekly Chart view
- Support Zone 156 to 167 Price Band
- Resistance Zone 184 to 196 Price Band
- Support been tested retested since last week
- Volumes gradually closing in with avg traded quantity
- Price staging above EMA 20, 50, 200 with positive MACD, RSI, SAR
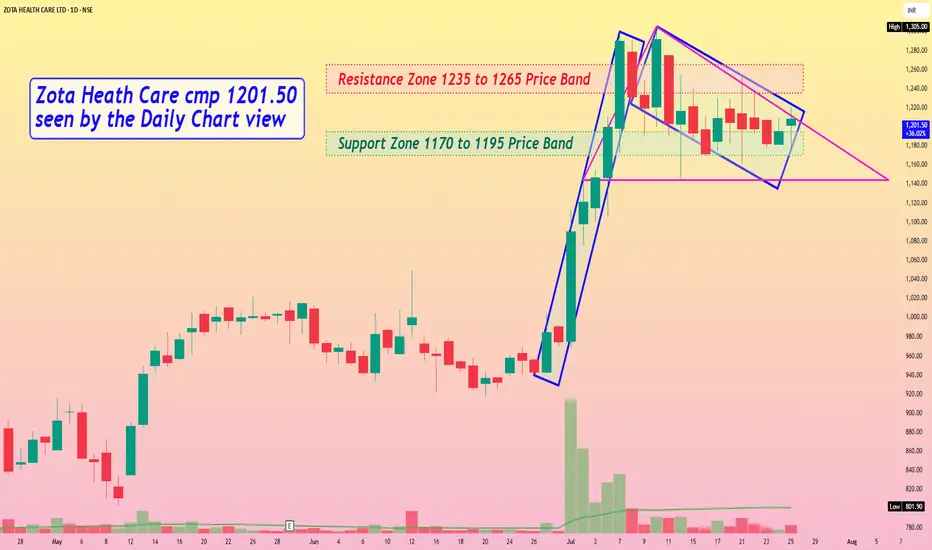
Zota Heath Care cmp 1201.50 seen by the Daily Chart viewZota Heath Care cmp 1201.50 seen by the Daily Chart view
- Support Zone 1170 to 1195 Price Band
- Resistance Zone 1235 to 1265 Price Band
- Volumes are steady need to increase for fresh upside
- Stock seems testing retesting Support Zone price band
- Bullish Pole and Flag pattern seem done after hitting ATH level
- Symmetrical Triangle Pattern too seems formed after ATH level
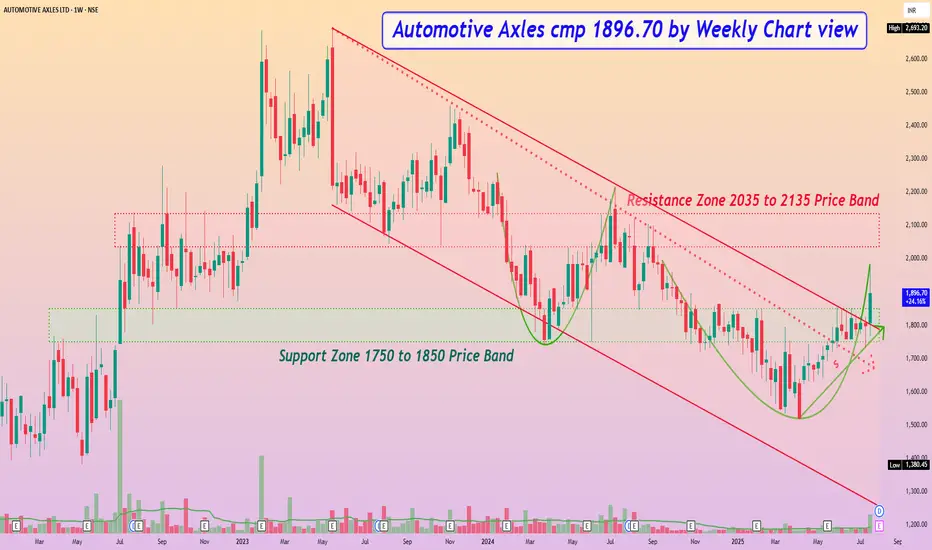
Automotive Axles cmp 1896.70 by Weekly Chart viewAutomotive Axles cmp 1896.70 by Weekly Chart view
- Support Zone 1750 to 1850 Price Band
- Resistance Zone 2035 to 2135 Price Band
- Falling Resistance Channel and Trendline Breakout well sustained
- Volumes surged by good demand based buying over the last week
- Bullish Rounding Bottom formed under the Resistance Zone price band
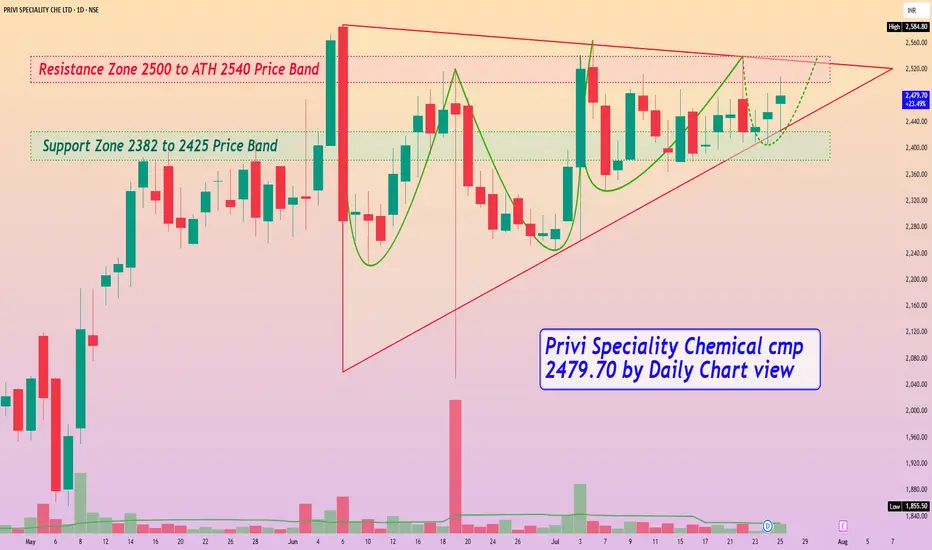
Privi Speciality Chemical cmp 2479.70 by Daily Chart viewPrivi Speciality Chemical cmp 2479.70 by Daily Chart view [/ b]
- Support Zone 2382 to 2425 Price Band
- Resistance Zone 2500 to ATH 2540 Price Band
- Ascending Triangle pattern Breakout in the making process
- Very considerate VCP pattern seems formed on the stock chart
- Volumes seen getting in close sync with the average traded quantity
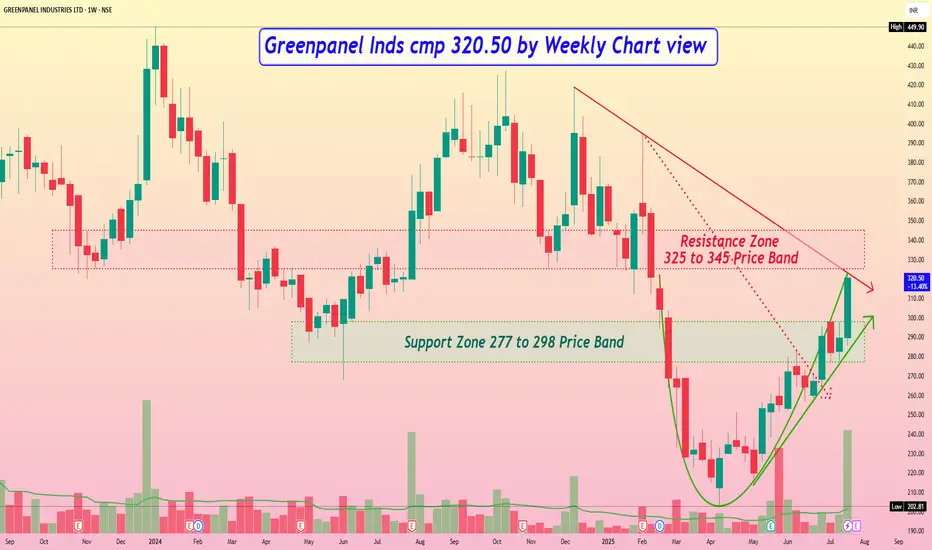
Greenpanel Inds cmp 320.50 by Weekly Chart viewGreenpanel Inds cmp 320.50 by Weekly Chart view
- Support Zone 277 to 298 Price Band
- Resistance Zone 325 to 345 Price Band
- Bullish Rounding Bottom with Resistance Zone neckline
- Rising Support Trendline seems well respected by price momentum
- Volumes have surged very heavily over past week by demand based buying
- 1st Falling Resistance Trendline Brake out done and 2nd Trendline Breakout attempted
- Most common Technical Indicators like BB, EMA, MACD, RSI, SAR are showing positive trend
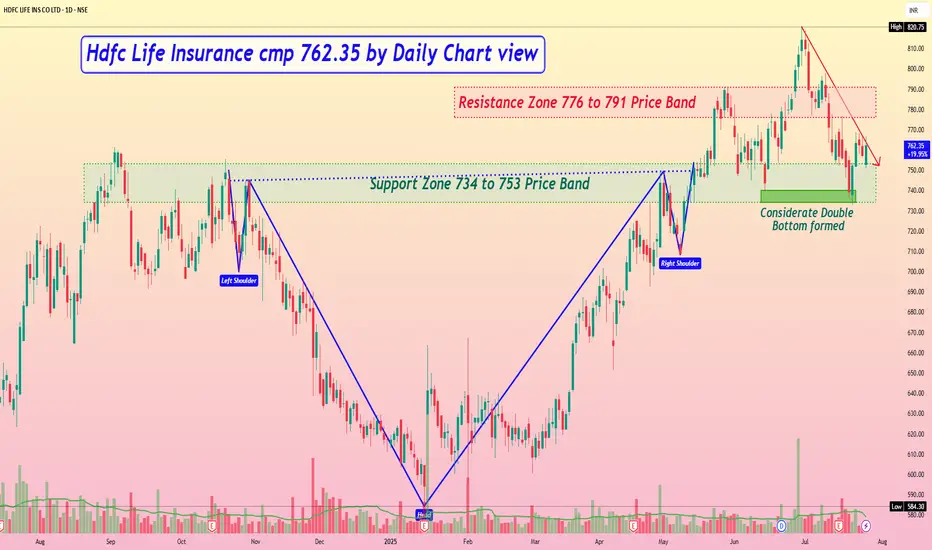
Hdfc Life Insurance cmp 762.35 by Daily Chart viewHdfc Life Insurance cmp 762.35 by Daily Chart view
- Support Zone 734 to 753 Price Band
- Resistance Zone 776 to 791 Price Band
- Bullish Head & Shoulders done at Support Zone neckline
- Considerate Double Bottom formed at the Support Zone price band
- Falling Resistance Trendline acting as hurdle for upside Price movement
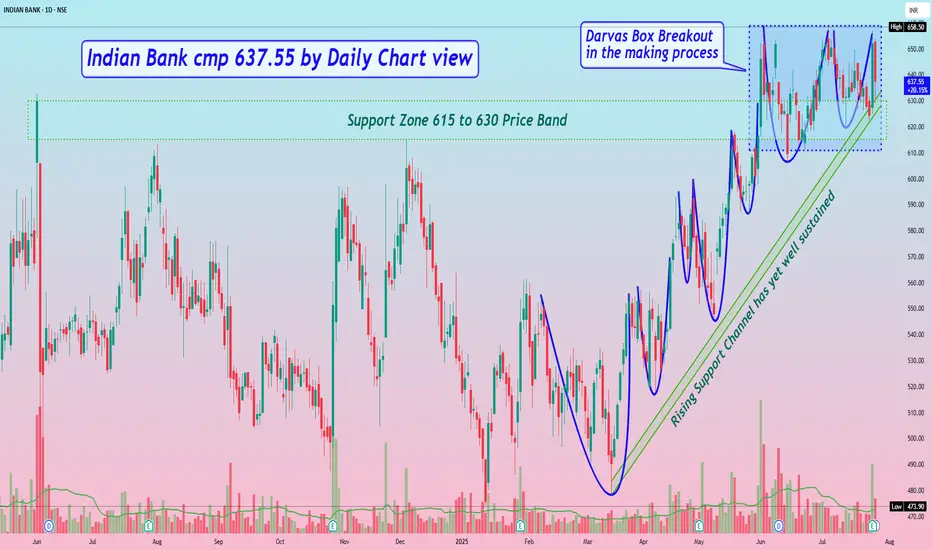
Indian Bank cmp 637.55 by Daily Chart viewIndian Bank cmp 637.55 by Daily Chart view
- Support Zone 615 to 630 Price Band
- Resistance only at ATH 658.80 price level
- Darvas Box Breakout in the making process
- Rising Support Channel has yet well sustained
- Support Zone has been tested retested well enough
- Repeated Bullish Rounding Bottoms at Support Zone neckline
- Considerate VCP pattern formed from Rising Price Channel start point