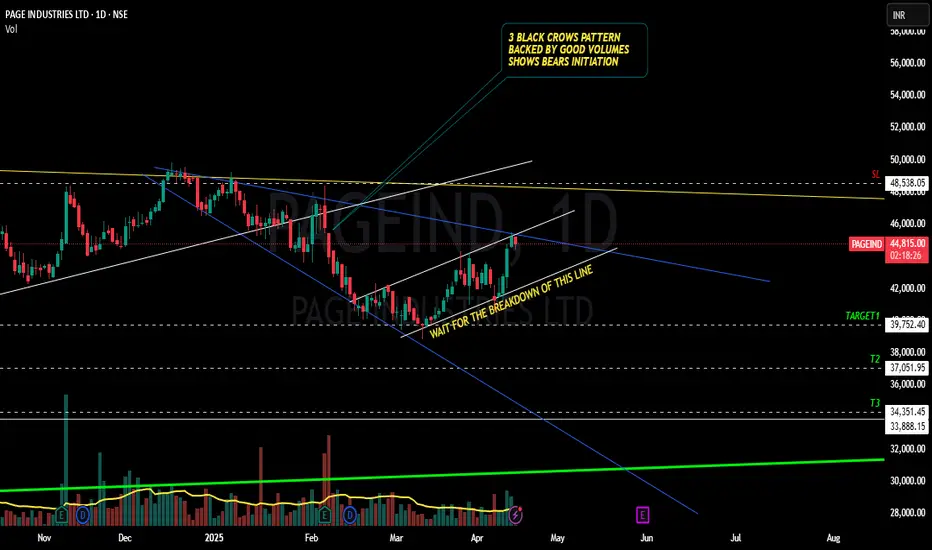
PAGEIND - BEARS READY TO TEAR JOCKEY DOWN TO 20% FALL???YES!!!!! Chart patterns made me think of the above titled opinion.
REASONS FOR MY IDEA
1.MONTHLY CANDLE BREAKDOWN WITH GOOD VOLUME
2. OCT 2022 Highs not tested even during 2024 bullish phase shows weakness
3. Weekly candle too shows a voluminous breakdown as shown below
4. 3 BLACK CROWS pattern in the daily time frame recently adds to the woes
5. I will mostly wait for the white trendline break for the entry.(though it is now at the resistance trendline , recent bullish candles may delay the down rally)
6. Given the sl , target are extreme levels.....will update after the white line breakdown.
LET THE MARKET DECIDE.....WE WILL WAIT AND WATCH!!!!!
This is just my opinion.....not a tip nor advice.
THANK YOU!!!!!!
Three Black Crows
Three Black Crows: How to Spot and Profit from Bearish ReversalsHello Traders!
I hope you’re all doing great! Today, we’ll discuss the Three Black Crows candlestick pattern, one of the most reliable bearish reversal patterns you can find in technical analysis. If you're serious about identifying potential trend reversals, understanding this pattern is essential.
The Three Black Crows is a powerful bearish signal that typically marks the end of an uptrend. It consists of three consecutive long red (or black) candles that close progressively lower, showing strong selling pressure and a shift in momentum. This pattern is particularly effective when it forms at a key resistance level, and it can lead to significant price declines.
What is the Three Black Crows Pattern?
The Three Black Crows candlestick pattern signals the reversal of an uptrend. The pattern forms when:
The first candle is a large red candle, closing near the low of the day.
The second candle opens below the first one and closes lower.
The third candle opens lower than the second one and closes near its low.
Each candle in the sequence is characterized by strong bearish price action, and their alignment suggests that bears are gaining control.
Key Characteristics of the Three Black Crows Pattern
Bearish Trend Reversal: Three long red candles following an uptrend suggest a shift in momentum from buyers to sellers.
Strong Resistance Zone: The pattern is more reliable when it forms near a strong resistance level, where the price has struggled to move past in the past.
Closing at the Low: Each of the three candles closes near their respective lows, showing increasing selling pressure.
Volume Confirmation: Volume should ideally increase with each successive candle, confirming that bears are taking control.
How to Trade the Three Black Crows Pattern
Entry Point: After the formation of the third candle, consider entering a short position once the price breaks the low of the third candle. This confirms the bearish trend.
Stop Loss: Place your stop loss just above the high of the third candle to minimize risk in case of a false breakout.
Profit Target: Measure the distance from the high of the pattern to the low of the third candle. Project this distance downward from the breakout point to estimate your profit target.
Real-World Application: Tata Consultancy Services Case Study
In the chart of Tata Consultancy Services (above), we can see a classic example of the Three Black Crows pattern. The price formed a resistance zone and then saw the three consecutive bearish candles break the support, confirming the bearish trend reversal. The huge fall after the pattern’s confirmation indicates the power of this candlestick formation.
Risk Management Considerations
Position Sizing: Adjust your position size based on your risk tolerance and make sure it fits within your overall portfolio strategy.
Stop Loss Placement: Place your stop loss above the third candle to avoid potential losses from a false breakout.
Confirmation with Volume: Always wait for volume confirmation before entering the trade. Volume should increase as the pattern forms.
What This Means for Traders
The Three Black Crows is an excellent pattern to spot potential trend reversals, especially after an uptrend. This pattern works best when combined with other technical indicators like trendlines, support and resistance, and moving averages to confirm the trend reversal.
Look for the pattern at resistance levels to identify high-probability bearish reversals.
Confirm with volume to increase the reliability of the pattern.
Use proper stop loss placement to manage your risk and ensure a favorable risk-to-reward ratio.
Conclusion
The Three Black Crows candlestick pattern is a reliable bearish reversal signal that can help traders capitalize on price declines. By identifying the pattern correctly, waiting for confirmation, and applying solid risk management strategies, you can improve your trading success.
Have you traded using the Three Black Crows pattern?
Share your experiences in the comments below! Let’s keep learning and growing together!


Bajaj Finserv Weak Candlestick Pattern!Three Black Crows Candlesticks Pattern Formed On daily Chart, The Bears Use This Opportunity To Create Three Consecutive Bearish Candles, Sell Positional ~ 1522, With Stop ~ 1562, For Target ~ 1350, Expected Target Jan Expiry.

Three Red Crows in ASIAN PAINTS LTDAsian paints have completed three red crowd patterns and started small corrections.
Asian paints strong support is 3052. and I think if the market breaks support it can go up to 2936.
If the support is not broken, the market will move to the 3150 level.
T1= 3150 ( if the market will not break support )
T1=2936 ( if the market will break support)
Thank you
@Money_Dictators

Cummins - sell nowsell from 858 to 875
easy target 825
t2 - 802
Disclaimer : This is my personal analysis for study purpose not intended for trading

trade for next weekadd on radar for next week
based on three black crows
When a Three Black Crows is seen at the top of an uptrend,
it could be one of the most powerful reversal patterns and trend signals.
entry condition - short @ open, preferable below close of 3rd bar
1st target - 525-521
521 being one month low can behave as good support
further targets will be posted later
disclaimer - trade @ own risk

look for 3385 target - shortersreasoning 👇
3 black crows pattern during downtrend
breakout - lower bollinger band
lower low, lower highs
disclaimer - trade @ own risk

Nestle resumed it's downtrend after a pullbackNestle is on a downtrend.
It broke below the 200 DMA with strong volumes. It has pulled back right till the 200 DMA where it was met with resistance.
And now we've 3 strong red candles successively (three black crow candlestick pattern suggestive of bearishness)
And the resistance can be seen right at the trendline that I've drawn.
Tgt: 15200
SL: use trailing stoploss just above the next candle.


WHAT HAPPENED WITH MARUTI? 10000 to 6800 Journey!Maruti reached its 52W high at 10,000 and has been faaling continuously since then. The way Maruti % fell shocked alot of people, However it was not all that difficult to determine the fall and I will share, how I proceeded and made money in Maruti 5.71% .
On 25 July, Maruti reached its prior top weeks high zone of 9900-10000 again. It was a good resistance and If it is broken with Good volumes, Maruti can go upto 12K-13K, The next day Maruti reversed from the resistance zone and created a Double Top (as shown in the chart), also the Day Candle formed a Bearish Engulfing Pattern which indicates the start of the downfall.
Double Top Pattern is a fairly successful pattern and Share is expected to reach the neckline at 8200-8300 zones before changing its direction.
Maruti immediately the next day formed a large 500 points Bearish Candle which gave me good profits, And I continued waiting for my Initial target of 8200 (Neckline). In the meanwhile share gave a lot of green candles, But I since I was already in profits, I had margin of bear some green Candles.
Each time Maruti showed a couple of green candle, a Big Red candle wiped out gains forming Bearish Engulfing Pattern repetitively, which posted my confidence. Share reached up to 9000 after that Rose 250 points.
I though of squaring off position but the prior experience showed that there has not been 3 consecutive green candles in the past 9 months, So I decided to wait for the next day. Maruti reversed and showed red candles for the next 3 days and formed a 3 Blacks Crows pattern, which is sign of huge fall coming.
Near 14 September One Gap Up for formed, but the next day there was a Gap Down thereby forming a Evening Star Pattern.
On 19 September, Share finally reached my initial target of 8200 after I squared off and decided to play a LONG STRANGLE, to up my possibilities of winning. I took a Put and a Call at 3% Difference.
Soon The share broke the neckline and started to go more downwards, I squared up my call and waited for gains in Put.
Every person has different way of Analyzing. But the idea is to hold onto your faith and continue with your strategy. Even the basic Candlestick patterns have the ability to reap you awesome results.
Thanks, i hope this is Helpful.
Keep sharing the list of shares you want an analysis on. Thanks :)

RAYMOND: SELL at 818.15 SL 825 TGT 782RAYMOND is a SELL on NSE around 818.15 with SL at 825 and Target of 782
Recent Fresh Shorts initiated with 78% OI and a CS pattern of Three Black Crows Bearish.

Tomorrow onwards heavy fall or heavy rise in Nifty!Tomorrow on NSE:NIFTY , if a red bearish bar appears, then it will be a three black crow pattern which will confirm long bearish phase!
However if a big green bar emerged from day's opening price, it will be a Three line Strike pattern, which is a highly bullish pattern with 84% accuracy rate! See also my other posting in link below.

THREE BLACK CROWS Divergence and Wolfe Wave!Divergence, THREE BLACK CROWS & Wolfe Wave all are pointing a good short at this level for a target of 840 on or before 25.01.17. Good Risk reward ratio!

DLF Forming Bullish Candlesticks Pattern The price action is been trading between trendlines and forming bullish candlesticks pattern at the bottom of trendline or resistance line. For past three days, it is been falling and formed a Three black crows bullish pattern. Now, it can move up tomorrow as shown in the chart to confirm the pattern as it is also previously done. Buying pressure at resistance trendline is high enough to take prices up. In case it fails to do it then I expect there is higher selling pressure than buying of it at current levels.
Lets look forward to tomorrow to unfold this mistry, any opinions are welcome. Regards
