Sbilife Getting ready for the rally ahead?!!!Chart patterns suggest me the above titled opinion
1. Weekly time frame shows a three white soldiers (month of april 2025) with good volume support....now the consolidation happening
2. In daily time frame, it is travelling in a expanding channel pattern , currently at the support line at the bottom
3. We need a confirmation for the rally with a Breakout candle....which we can expect during the result release.
4.If we make our entry now, we can make our stoploss as daily candle close out of the channel
5. Best entry is to wait for the Breakout and enter with SL below the breakout candle
6.Target levels as mentioned in the chart.
With strong fundamentals and decent valuations, Sbilife is one of the best options for long term bet in the insurance sector!!!
This is just my opinion ....not a tip nor advice..
Thank you!!!!
Three White Soldiers

ELECTCAST : Swing Trade#ELECTCAST #ThreeWhiteSoldiers #fairvaluegap #stage1breakout #breakoutstock #Trendingstock
ELECTCAST : Swing Trade
>> Low PE Stock
>> Stage 1 Breakout & Retest done
>> TWS & FVG Visble
>> Liquidity Sweep Visible
>> Volumes Dried up
>> Stock gaining strength
Swing Traders can lock profit at 10% and keep Trailing
Please Boost, comment and follow us for more Learnings.
Note : Markets are still Tricky and can go either ways so don't be over aggressive while choosing & planning your Trades, Calculate your Position sizing as per the Risk Reward you see and most importantly don't go all in
Disc : Charts shared are for learning purpose only, not a Trade recommendation. Do your own research and consult your financial advisor before taking any position.

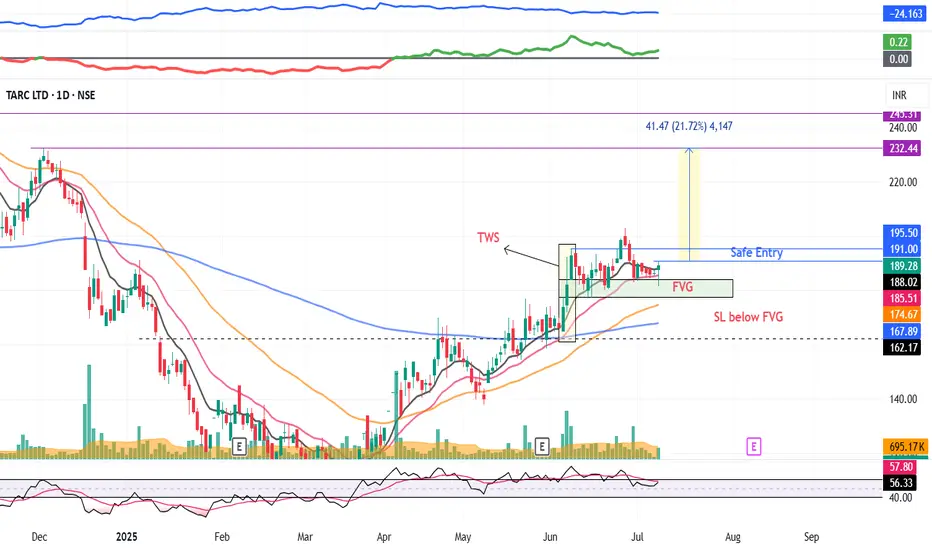
TARC: Swing Pick (Breakout Candidate)#Tarc #swingtrade #threewhitesoldiers #fvg #fairvaluegaps #trendingstock #breakoutstock
TARC : Breakout Candidate
>> Up-trending stock
>> TWS Visible
>> Bounce back from FVG
>> Trending setup
>> Good Volume & Strength
>> Risk Reward Favorable
Swing Traders can lock profit at 10% and keep Trailing
Please Boost, comment and follow us for more Learnings.
Disc : Charts shared are for learning purpose only, not a Trade recommendation. Do your own research and consult your financial advisor before taking any position.
SBIN : Swing Trade#SBIN #swingtrade #threewhitesoldier #trendingsetup #breakoutstock #momentumstock
SBIN : Swing Trade
>> TWS Visible
>> Trending setup
>> Cup and Handle formation
>> Breakout Candidate
>> Good Strength & Volume
>> Good Risk Reward Trade
Swing Traders can lock profit at 10% and keep trailing
Disc : Charts shared are for Learning purpose not a Trade recommendation.
Consult a SEBI Registered Advisor before taking position in it.

CHALET Hotels : Swing pick#CHALET #swingtrade #breakout #threewhitesoldiers #trendingstock
CHALET : Swing Trade
>> TWS Visible
>> Trending Setup
>> Good Strength in Stock
>> Volumes Dried up, Expansion imminent
>> Quick 10-15% upside potential
Swing Traders can lock profit at 10% & Keep Trailing
Disc : Charts shared are for Learning purpose and not a Trade recommendation. Consult a SEBI Registered Advisor before taking position in it.

NACL Industries - Range Breakout Trade Setup🔥 NACL Industries - Range Breakout Trade Setup 🚀
📍 Breakout Level: ₹116
📍 Current Market Price (CMP): ₹121
📍 Stop Loss (SL): ₹96.5 (📉 Closing basis)
📍 Target 1 (T1): ₹166 🎯
📍 Target 2 (T2) (Positional): ₹255 🎯🎯
🔍 Why This Trade?
✅ Range Breakout 📈: Stock has broken out of a 3-year-old consolidation range!
✅ Big Money Inflow 💰: Breakout supported by high volume, indicating institutional buying.
✅ Bullish Pattern 📊: Formation of 3 White Soldiers on March 25 in DTF– a strong bullish signal! 🚀
✅ Sector Strength 🌱: Agrochemical sector is gaining momentum, boosting the stock.
✅ Price Action 🏆: Stock consolidated at all-time high levels before breaking out.
✅ Technical Strength 🛠️: Trading above key moving averages – momentum is on our side!
✅ No Overhead Resistance 🚧: No major hurdles ahead, potential smooth uptrend!
📊 Risk-Reward Calculation
🔹 Risk (SL at ₹96.5): ₹121 - ₹96.5 = ₹24.5
🔹 Reward 1 (T1 at ₹166): ₹166 - ₹121 = ₹45 🎯
🔹 Reward 2 (T2 at ₹255): ₹255 - ₹121 = ₹134 🎯🎯
🎯 Target 📏 Risk: Reward Ratio
T1 (₹166) 1:1.8
T2 (₹255) 1:5.4
📌 Trade Plan
👨💻 For Conservative Traders:
🔹 Entry: Small quantity at CMP (₹121) and add on successful retest of ₹116.
🔹 SL: ₹96.5 (Closing basis).
🔹 Target 1: ₹166 (Partial profit booking 📈).
🔹 Target 2: ₹255 (Hold for positional gain 🏆).
⚡ For Aggressive Traders:
🔹 Entry: Full deployment at CMP (₹121) if risk is well managed.
🔹 SL: ₹96.5 (Closing basis).
🔹 Exit Strategy: Trailing SL or partial booking at T1 (₹166), hold for T2 (₹255) 🚀.
⚠️ Key Risks to Consider
🔴 Fundamental Weakness: Poor ROCE (-0.04%) and ROE (-10.8%) → Purely technical trade!
🔴 Market Condition: 📉 Nifty still below 200 DMA, caution required!
🔴 Macroeconomic Factors: 🌍 Global uncertainties (e.g., Trump tariffs) may impact sentiment.
🚨 Final Note
📌 This is a high-risk, high-reward trade. Strict SL adherence is crucial! 🚨
💡 If you’re not comfortable with deep SLs, stay on the sidelines or enter lightly.
📈 Market remains uncertain—trade cautiously & manage risk wisely! 🛑
💬 What’s your take on this trade? Drop your thoughts below! ⬇️
🔹 Disclaimer: This is NOT financial advice. Do your own research before making any trade decisions. 📊

Mastering the Three White Soldiers Pattern: A Bullish ReversalHello Traders!
I hope you're doing great in your trading journey! Today, we will be diving into the Three White Soldiers chart pattern, a powerful bullish reversal pattern that can help you spot a potential trend shift. This pattern typically occurs after a downtrend, signaling a strong reversal. If you can spot it early, it offers a high-reward trading opportunity. Let’s break down the pattern and how to use it effectively.
What is the Three White Soldiers Pattern?
The Three White Soldiers pattern consists of three consecutive long bullish candles that close progressively higher. This pattern typically appears after a downtrend and signifies a potential reversal. The pattern shows a strong shift in market sentiment, where buyers are stepping in to push the prices higher.
Key Characteristics of the Three White Soldiers Pattern
Trend Reversal: The pattern forms after a strong downtrend, signaling a potential trend reversal.
Three Consecutive Bullish Candles: The pattern consists of three long bullish candles, each closing higher than the previous one.
Strong Closing Prices: Each candle should close near its high, indicating strong buying pressure.
Volume Confirmation: The pattern is more reliable when accompanied by increasing volume, showing strong interest in the reversal.
How to Trade the Three White Soldiers Pattern
Entry Point: Consider entering a long position once the third candle closes, confirming the reversal.
Stop Loss: Place your stop loss below the low of the first candle in the pattern to limit potential losses.
Profit Target: For setting targets, measure the height of the pattern (distance between the low of the first candle and the high of the third candle) and project this distance upwards from the entry point to set your profit target.
Real-World Application: TCS Case Study
In the chart of Tata Consultancy Services (TCS) , we see a clear Three White Soldiers pattern forming after a downtrend. The price closed progressively higher over three consecutive days, breaking key resistance levels and signaling a potential bullish trend. Traders entering after the confirmation of the pattern would have witnessed a substantial upward move, with a clear Stop Loss and Profit Target in place.
Risk Management Considerations
Position Sizing: Adjust your position size according to your risk tolerance and overall portfolio.
Stop Loss Placement: Place your stop loss below the low of the first candle to manage risk in case the pattern fails.
Volume Confirmation: Confirm the pattern with increasing volume to ensure the strength of the reversal.
What This Means for Traders
The Three White Soldiers pattern is an excellent tool for identifying trend reversals and can be a powerful signal when used in conjunction with other technical indicators. Remember to always look for confirmation with volume and manage your risk effectively.
Look for the pattern after a significant downtrend to identify potential bullish reversals.
Use volume to confirm the strength of the pattern and increase the reliability of your trade.
Implement stop loss placement to minimize risk while targeting a favorable risk-to-reward ratio.
Conclusion
The Three White Soldiers pattern is a reliable bullish reversal signal that can offer excellent trading opportunities when combined with other technical indicators. By understanding its key characteristics, waiting for confirmation, and managing risk appropriately, you can increase your chances of making profitable trades.
Have you traded using the Three White Soldiers pattern?
Share your thoughts and experiences in the comments below! Let’s keep learning and improving our trading strategies!

Three White Soldiers | Educational | Colpal The Three White Soldiers candlestick pattern is commonly used in technical analysis.
The pattern identifies potential bullish reversals in a downtrend or a period of consolidation. Traders often use the pattern and other technical analysis tools, such as support and resistance levels, trend lines, and volume indicators, to confirm the trend’s strength and potential entry and exit points.
The Three White Soldiers pattern can be used on various time frames, from short-term intraday charts to longer-term weekly or monthly charts, depending on the trading strategy and goals.
Disclaimer: This is for educational purpose. Definition and details can be found on any other search engine / books/ articles etc.

Kabra Extusion : Breakout Candidate#kabraextru #swingtrade #breakout #TWS #chartpatterns #trendingetup
Kabraextru : Swing Trade
>> TWS = Big Players Present
>> VCP formation Visible
>> Breakout Candidate
>> Good Strength & Volumes
>> Good Upside Potential
Swing Traders can Lock Profit at 10% and keep trailing
Note: In Current Market Scenario even best of Setup's can FAIL, Hence Trade only Good Setups with proper Risk Management & Position Sizing
Disclaimer : This is not a Trade Recommendation, Charts Shared are for Learning & Study Purpose.

CONCOR: Price Action for DiwaliFollowing a substantial downtrend in CONCOR has recently exhibited a bullish reversal pattern characterized by three consecutive green candlesticks ( Three Green Soldiers ) on the daily timeframe. This formation suggests a significant shift in stock movement, indicating that buyers have gained control and are exerting upward pressure on the stock. Such a pattern is typically interpreted as a strong signal that the preceding downtrend may be reversing into an uptrend.
In conjunction with the daily analysis, the weekly chart reveals that CONCOR has retraced from the 38.2% Fibonacci level. Based on historical performance, this retracement level is often recognized as a key area of support and is frequently associated with strong potential reversal points. The confluence of the candlestick pattern and the Fibonacci retracement level strengthens the case for a bullish outlook on the stock.
Considering the current market conditions and technical indicators, CONCOR appears to present a favourable opportunity for accumulation at the current market price . For those considering an entry point, a prudent stop-loss level has been identified at 711 , which allows for an optimal risk-reward scenario. The target price will be 1153 , reflecting a potential long term resistance.
Disclaimer: The information contained in this report is intended solely for informational and educational purposes, and should not be interpreted as financial advice. It is imperative that investors conduct their own thorough research and consider their individual financial situations before making any investment decisions.

IIFLSEC : Momentum Stock#IIFLSEC #tws #FVG #breakout #trendingstock
IIFLSEC : Swing Trade
>> TWS & FVG Visible
>> Bounce back from FVG
>> Trending setup
>> Good Strength & Volumes
>> Low PE Stock
Swing Traders can lock profit at 10% & keep Trailing
Please give a Boost or comment if u r Liking the analysis & Learning from it. Keep showing ur Love by following
Disclaimer : This is not a Trade Recommendations & Charts/ stocks Mentioned are for Learning/Educational Purpose. Do your Own Analysis before Taking positions.

Zomato Looking Good after Piercing Candle.NSE:ZOMATO Looking good after forming piercing candle with good volumes today on daily timeframe, can go to 300 will be hurdle to watch.
Disclaimer: This analysis is intended solely for informational and educational purposes and should not be interpreted as financial advice. It is advisable to consult a qualified financial advisor or conduct thorough research before making any investment decisions.

IIFLSEC : Bounce Back from FVG#IIFLSEC #Threewhitesoldiers #fairvaluegap #momentumpick #Trendingstock
IIFL Securities : Swing Trade
>> Trending Setup
>> Stock in Uptrend
>> TWS & FVG Visible
>> Price Respecting FVG and showing Bounce back
>> Upside Potential upto 20%
>> Low PE Stock
Swing Traders can lock Profit at 10% and keep trailing.
If u Like the Analysis, Boost the Idea and Follow us
Disclaimer : Charts shared for Learning Purpose only, not a Trade Recommendation.

Rane Engine : Momentum Stock#Raneengine #threewhitesoldiers #fairvaluegap #momentumpick #trendingstock #Swingtrade
Rane Engine : Momentum Trade
>>TWS & FVG Visible
>> Bounce back form FVG Visible
>> Trending Setup
>> Good Strength & Volume Expansion soon
>> Potential of more than 20% upside
Swing Traders can lock profit at 10% and keep Trailing.
If u Like the Analysis, Boost it and Follow us for such Trade Ideas
Disclaimer : Stock Charts shared are for Learning Purpose and not a Buy or Sell Recommendations.

IZMO : Breakout CandidateSwing Setup
IZMO : Risky Trade but worth it
>> Huge TWS Visible on the Left Side
>> Price currently near Bottom of TWS, Spike Expected
>> W pattern also visible which can breakout
>> Inside Bar forming at the Bottom of W pattern
>> Highlighted supply zone : Almost 12% till there
>> If Breaks Supply zone, Another 12% on cards
>> Trendline Breakout also coinciding with W pattern Breakout
>> SL u can consider 380 levels
Risky Trade but so much Learnings, Chart filled with lot of concepts....which is actually lot of confirmations
Totally Worth Trading this setup with low Risk
Swing Traders can lock 10% profit & keep trailing
Please give a Boost or comment if u r Liking the analysis & Learning from it. Keep showing ur Love by following
Disclaimer : This is not a Trade Recommendations & Charts/ stocks Mentioned are for Learning/Educational Purpose. Do your Own Analysis before Taking positions.

EMS Limited : Breakout Candidate#EMSLIMITED #breakoutstock #breakouttrading #vcppattern #asymmetricaltriangle #chartpatterns #TWS
EMS Ltd : Breakout Candidate
>> Ascending Triangle Pattern
>> VCP Pattern Visible
>> Good Strength & Volume may Expand in coming Days
>> Moving Avg Tending Setup
>> Low Risk High Reward Trade
As per the Setup it shud give a minimum upside of 15-17%.
Swing Traders can lock 10% profit & keep trailing
Please give a Boost or comment if u r Liking the analysis & Learning from it. Keep showing ur Love by following
Disclaimer : This is not a Trade Recommendations & Charts/ stocks Mentioned are for Learning/Educational Purpose. Do your Own Analysis before Taking positions.

Kokuyo camlin : Breakout Stock#kokuyocmln #breakoutstock #tws #fvg #patterntrading #chartpattern #inverseheadandshoulder
Kokuyo Camlin : Swing Trade / Short term(1-3 Months)
>> Breakout Stock
>> TWS Visible
>> Stock Bouncing from FVG Area
>> Good Strength & Volumes might Pickup soon
>> Low Risk High Reward Trade
Swing Traders can lock profit at 10% and keep trailing.
Please give a Boost or comment if u r Liking the analysis & Learning from it. Keep showing ur Love by following
Disclaimer : This is not a Trade Recommendations & Charts/ stocks Mentioned are for Learning/Educational Purpose. Do your Own Analysis before Taking positions.

HFCL : Breakout Stock#hfcl #swingtrade #vcppattern #threewhitesoldier #trendingstock #Fairvaluegap
HFCL : Breakout Stock
>> Vcp pattern visible
>> Higher Low formation seen
>> Demand ⬆️ Supply 🔻
>> Good Strength & Volume buildup
>> Bounced back from FVG area
>> Moving Average Trending setup
I m expecting a minimum 20% move in a short span of time.
Swing Traders can lock 10% profit & keep trailing
Please give a Boost or comment if u r Liking the analysis & Learning from it. Keep showing ur Love by following
Disclaimer : This is not a Trade Recommendations & Charts/ stocks Mentioned are for Learning/Educational Purpose. Do your Own Analysis before Taking positions.

BASML : Swing Trade#BASML : #SwingTrade
>> TWS Recently
>> Inverse Head & Shoulder Pattern Visible
>> Trending setup
>> Good Strength & Volumes Buildup
>> Low Risk High Reward Trade
Swing Traders Book 10% and keep trailing
🚧 Only for Quick 8-10% , not to Hold Longer
🛑Fundamentally stock is not that Good, Stock Picked Purely on Technical Analysis....so can be a Risky Bet
Stock can show Quick 8-10-15% ka quick momentum then fall back
See Upside Potential is 18% so we can easily target 10%

BEPL : Breakout Candidate (Holding 1-3 Months)#BEPL #Swingtrading #trading #patterntradinng #chartpattern
BEPL : Positional Trading (Holding 1-3 Months)
>> Breakout Stock
>> Monthly Cup & Handle Breakout
>> TWS + Flag pattern + FVG Visible on daily
>> Trending Stock in Momentum
>> Good Strength & Volumes Recently
>> Big Player Entered in stock
Swing Traders can lock 10% profit & keep trailing
Please give a Boost or comment if u r Liking the analysis & Learning from it. Keep showing ur Love by following
Disclaimer : This is not a Trade Recommendations & Charts/ stocks Mentioned are for Learning/Educational Purpose. Do your Own Analysis before Taking positions.

HDFCBANK FUTHDFCBANK FUT made 3 soldiers reversal pattern on an hourly chart.
Could be bought with mentioned stoploss & target with very good Risk:Reward ratio.
Not to be missed.

Nifty Pharma- Three White Soldiers BULLISH REVERSAL!Attached: Nifty Pharma Index Weekly Chart as of 7th April 2023
With the Week gone by,
Price has formed the 'Three White Soldiers' Candlestick Pattern on the Weekly Chart
This has MAJOR IMPLICATIONS
(Note: the 'Three White Soldiers' is a Bullish Candlestick Pattern that is used to predict the Reversal of the current Downtrend in a pricing chart.)
What Does This Mean for Investors & Traders?
- Money is flowing back into the Pharma Sector and Stocks
- There is a Trend Change of the previous Bear Trend to start of a New Bull Trend
- In addition to the Candlestick Reversal Pattern, Price has also given a Trend Line Breakout (marked as Dotted Trend Line on Chart) which is another sign for a Trend Reversal
Hence,
Bulls are now chasing the Pharma Sector so if you want to make Money on the Long Side, this is the Sector to be in !
..........................
FYI: I have already shared a Bullish Stock Pick within the Pharma Sector in my Related Ideas below. Check it out to know more.

SILVER- Relative Strength says Buy!XAGUSD
Another Bullish Signal for Silver🥈
Attached: XAGUSD/ Nifty 50 Weekly Chart as of 31st March 2023
- This Relative Strength Chart indicates that the Outperformance of Silver over Equity (Nifty 50) has started 📈
-It is similar to the Signal on Gold🥇 that I had shared on New Year's Day and you can see how fabulously well that Gold Buy Signal played out for us ‼️
- Expect the same for Silver as I have been saying that Silver has to catch up with Gold
So if Not Already in Silver,
Get In As Soon As Possible or you will miss the Move 🚀!
Note:
In my previous post on Silver, I highlighted an Inverted Head & Shoulder Breakout BUY SIGNAL
Since that post, Silver is up 6.60% and counting....
